
Key risk events today:
BoE Governor Mark Carney Speaks; FOMC Members Clarida and Kashkari Speak.
EUR/USD:
Europe’s single currency ceded further ground to the US dollar Wednesday, shedding 0.42% and clocking near-two-week lows a few points north of the 1.11 handle.
On the data front, US ADP surged into the year end, showing 202,000 private payrolls were added to the US economy, beating the consensus 160k. Some desks stated the data introduced upside risks for Friday’s official employment situation report.
In addition to this, according to the Wall Street Journal, President Trump said Iran appears to be backing away from conflict with the US and signalled no further US military strikes, after an Iranian missile barrage on US bases that seemed calibrated to avoid further escalation.
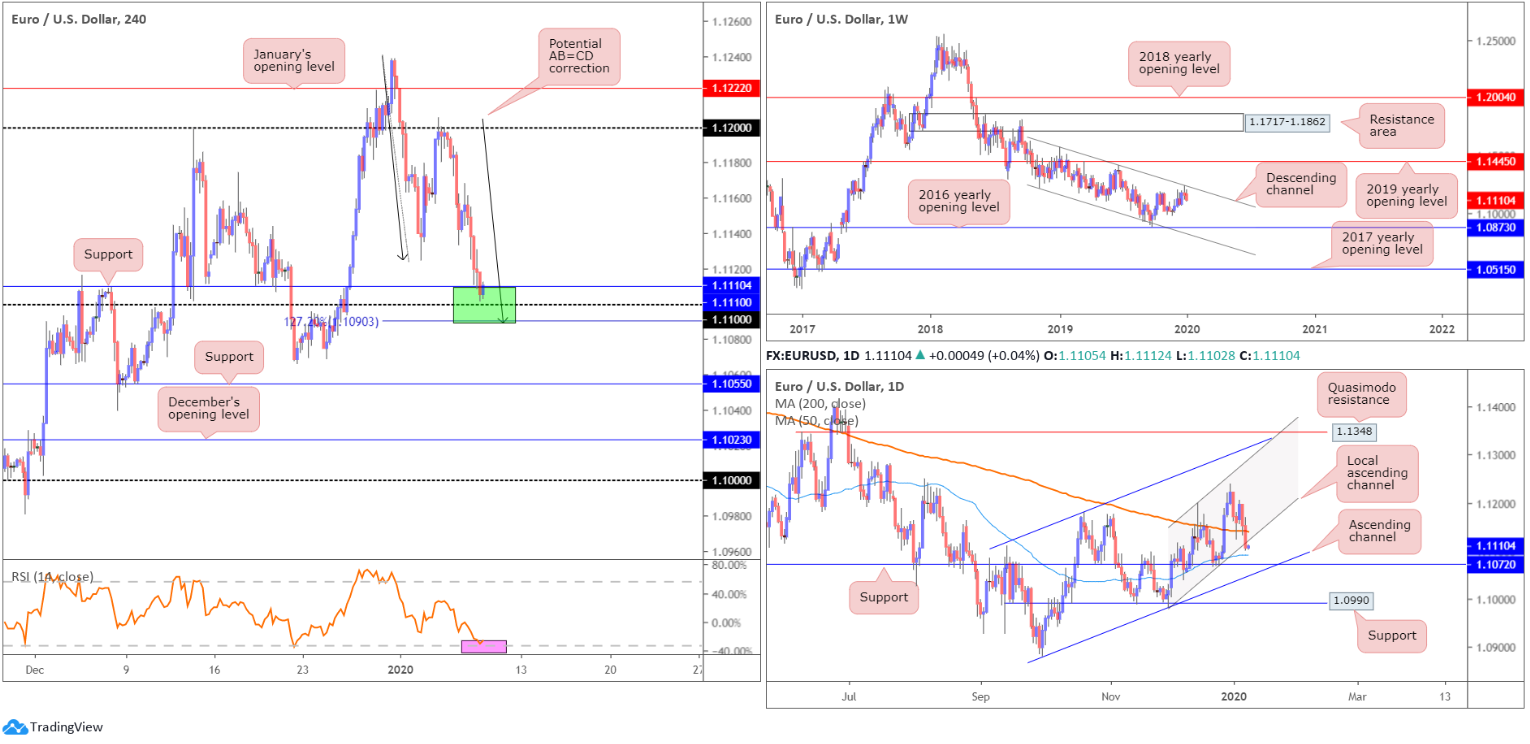
Supporting the 1.11 handle, based on the H4 timeframe, additional confluence is visible by way of support priced in at 1.1110 and a 127.2% AB=CD (black arrows) bullish correction at 1.1090. Also worthy of note is the relative strength index (RSI) seen entering oversold territory.
Weekly movement, as highlighted in previous writing, is testing channel resistance, extended from the high 1.1569. Noticeable downside objectives fall in around the 2016 yearly opening level at 1.0873 and channel support, taken from the low 1.1109.
A closer reading of price action on the daily timeframe witnessed Wednesday’s decline puncture the 200-day SMA (orange – 1.1140) and a local channel support, extended from the low 1.0981. The 50-day SMA (blue – 1.1091) stands nearby as possible support, closely followed by support coming in at 1.1072 and larger channel support, taken from the low 1.0879.
Areas of consideration:
Although weekly price appears to be strengthening its grip off channel resistance, nearby support based on the daily chart around 1.1072 is likely a concern for sellers. Add this to the fact H4 support is seen between 1.1090/1.1110 (converges with the noted 50-day SMA), and there’s a chance buyers may attempt a recovery today.
Entering long from 1.1090/1.1110 with protective stop-loss orders tucked beneath 1.1090 is, of course, an option today. Conservative traders, though, may opt to wait for more of a decisive turn out of the zone before committing. As for upside targets, AB=CD traders typically favour the 38.2%/61.8% Fibonacci retracements of legs A-D – reduce risk to breakeven at 38.2 and take-profit at 61.8. Eyeing much higher than these Fibonacci targets is chancy, given where we’re coming from on the weekly timeframe.
GBP/USD:
Overall outlook remains unchanged due to yesterday’s lacklustre performance.
Sterling held up reasonably well against a stronger buck Wednesday, maintaining a position marginally above 1.31. However, price action remains choppy across the board, and the pound may be prone to more Brexit headlines in wake of UK PM Johnson’s date with new EC President von der Leyen.
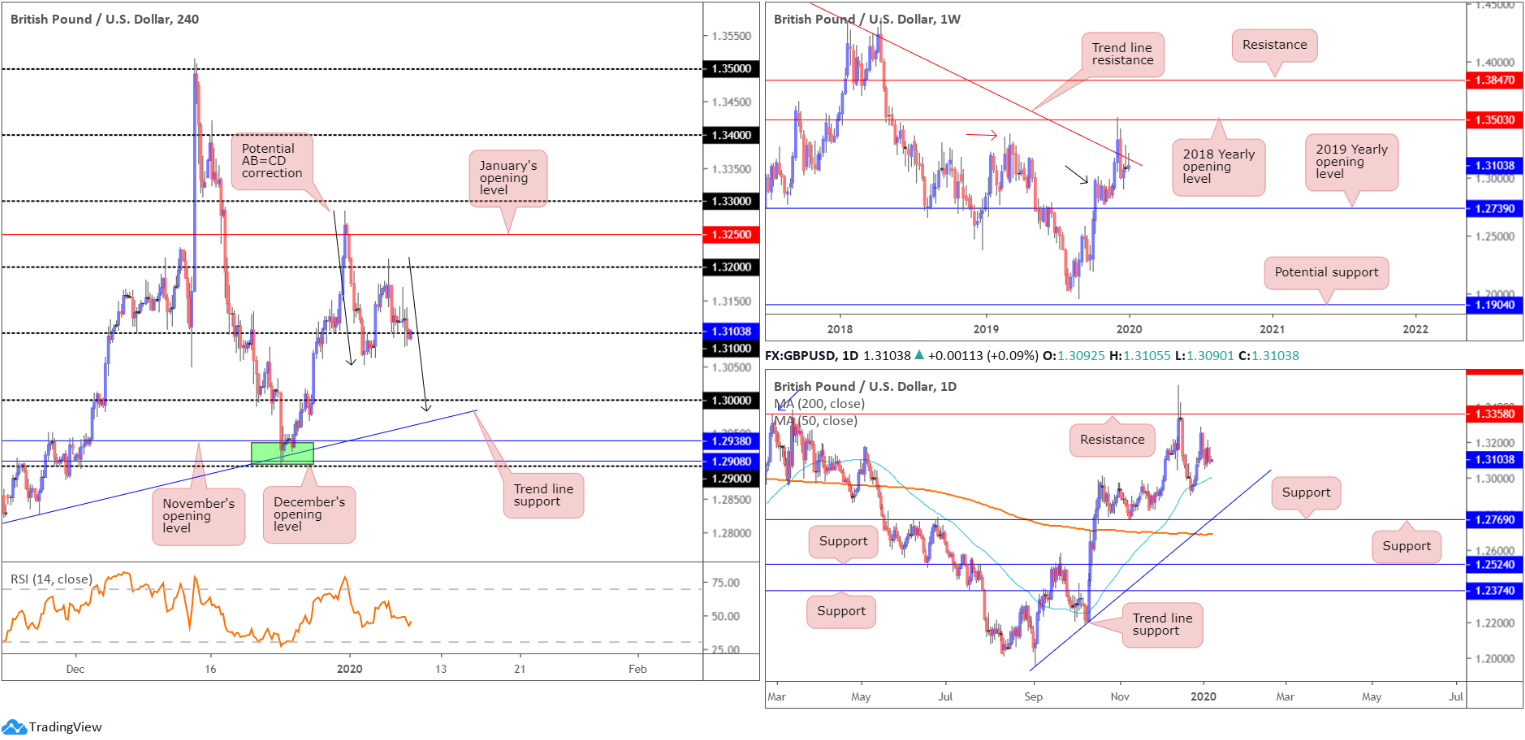
South of 1.31, H4 price has 1.3060ish as potential support, though beyond here limited support is visible until reaching the key figure 1.30. Note this level also comes together with a potential AB=CD bullish correction (black arrows) at around 1.2982 and a trend line support, extended from the low 1.2768.
Meanwhile, on the weekly timeframe, buyers and sellers continue to square off between long-standing trend line resistance, pencilled in from the high 1.5930, and nearby demand around the 1.2939 region (black arrow), likely seduced by the recent break of the notable high at 1.3380 (red arrow).
The 50-day SMA (blue – 1.3004) remains reasonably dominant support on the daily timeframe. Another layer of support that may eventually the fight, though, is 1.2769, which happens to merge closely with trend line support, pencilled in from the low 1.1958 and the 200-day SMA (orange – 1.2688). With respect to resistance, the only level of interest right now sits at 1.3358, capping upside since mid-June 2019.
Areas of consideration:
Although the level may not hit today, 1.30 is an obvious point of direction for many buyers in this market, considering its local (H4) confluence and also the 50-day SMA aligning closely with the round number.
A decisive close beneath 1.31, followed up with a retest as resistance, may also be of interest to some traders today. While 1.3060 highlights possible support, a retest at the underside of 1.31, shaped by way of a H4 bearish candlestick signal, is likely enough to drive through any buying opposition, targeting 1.30 as the take-profit zone.
AUD/USD:
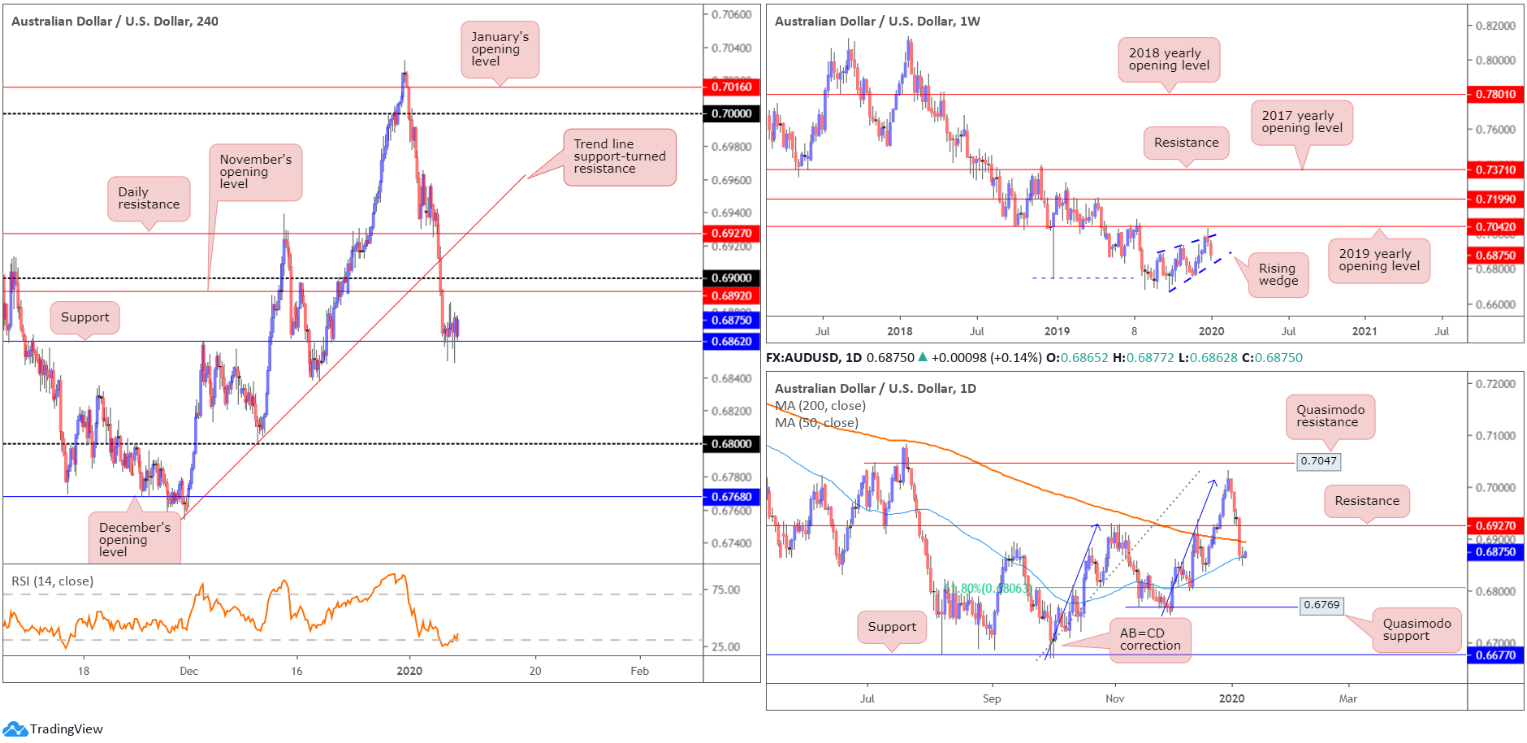
Wednesday’s data published by the Australian Bureau of Statistics showed building permits advanced 11.8% in November, following October’s decline of 7.9% (consensus: 2.1%). Although prompting an initial wave of AUD/USD bidding, the pair remained somewhat stale throughout the day off H4 support coming in at 0.6862, confirmed by the relative strength index (RSI) testing oversold territory.
What’s interesting from a technical perspective is daily structure shows the 50-day SMA (blue – 0.6865) aligns with the said H4 support. Beyond the current 50-SMA, we see possible support emerging off the 61.8% daily Fibonacci retracement at 0.6806, closely trailed by daily Quasimodo support at 0.6769.
Weekly action, since registering a bottom in late September at 0.6670, has been busy carving out what appears to be a rising wedge formation, typically considered a continuation pattern. Recent selling witnessed price decline back into the rising wedge, with a break lower possible given the primary downtrend in this market has faced a southerly bearing since early 2018.
Areas of consideration:
Although weekly price is suggestive of further declines, an intraday long position off the current H4 support at 0.6862 remains an option. Knowing the level boasts a connection to the 50-day SMA, an intraday advance to at least November’s opening level on the H4 at 0.6892/200-day SMA (orange – 0.6894) is certainly a possibility.
An alternative to higher prices is a break of the current H4 support, as suggested on the weekly timeframe. This may re-open bearish themes towards the 61.8% daily Fibonacci retracement 0.6806 and the 0.68 handle on the H4 chart. Remember, AB=CD traders short the bearish pattern on the daily timeframe (blue arrows) will largely be targeting the said 61.8% Fibonacci level.
USD/JPY:
A sharp unwind of safe-haven premiums witnessed a marked improvement in market sentiment Wednesday.
In a press conference, US President Donald Trump stated no Americans were harmed in the Iranian missile strikes, adding Iran appears to be backing away from conflict with the US. According to the market’s response, this was interpreted towards de-escalation, prompting a risk-on environment.
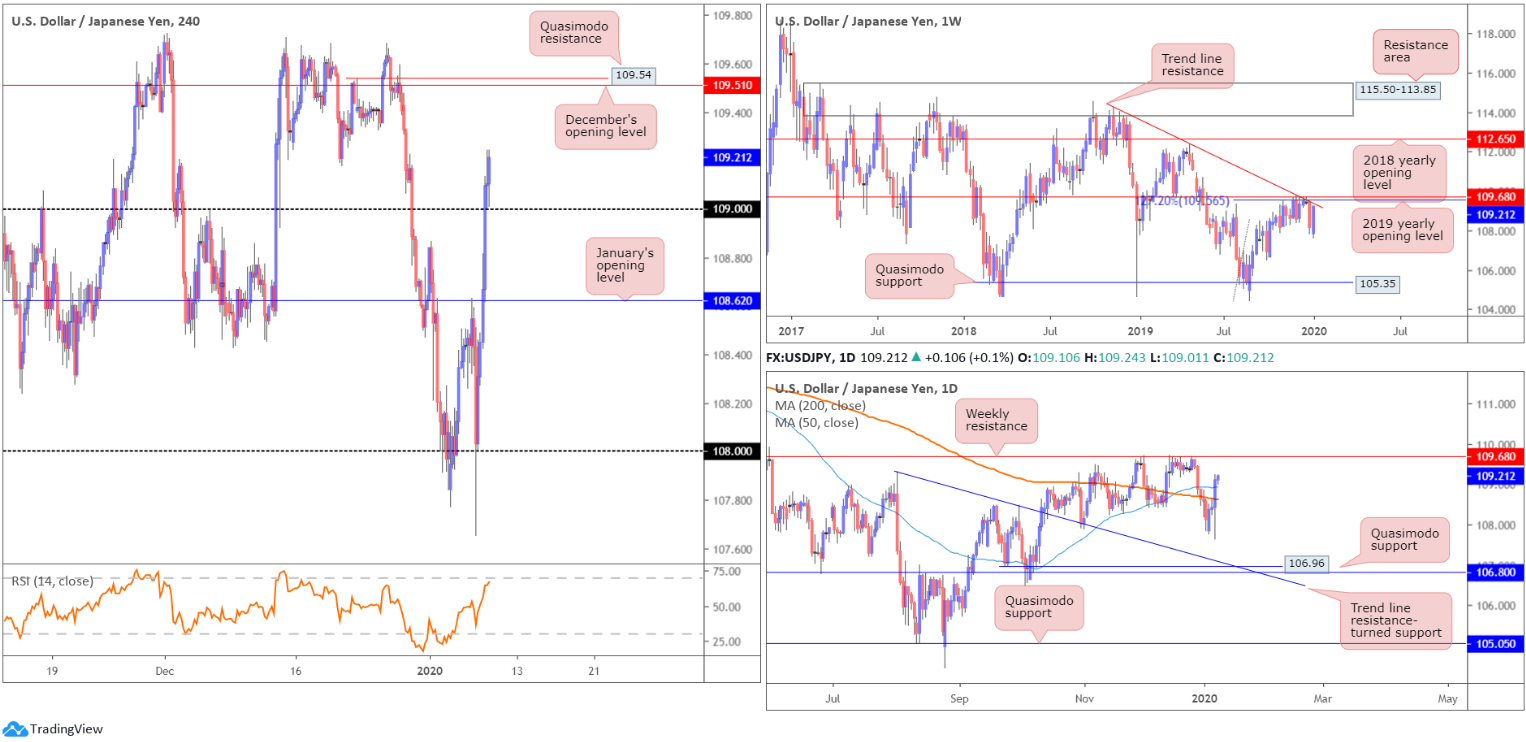
Kicking off things from the weekly timeframe, technical research shows price trades within striking distance of notable resistances, following yesterday’s recovery (comprised of a 127.2% Fibonacci extension at 109.56 [taken from the low 104.44], the 2019 yearly opening level at 109.68 and trend line resistance, extended from the high 114.23).
Daily flow, on the other hand, crossed above both the 200-day SMA (orange – 108.62) and the 50-day SMA (blue – 108.93), consequently exposing weekly resistance highlighted above at 109.68.
Across the page on the H4 timeframe, recent bidding hauled price action north of 109, which was shortly after retested as support (see lower timeframes). To the upside, resistance resides around December’s opening level at 109.51, closely trailed by Quasimodo resistance drawn from 109.54. Indicator-based traders may also wish to note the relative strength index (RSI) is seen fast approaching overbought territory.
Areas of consideration:
In the event an additional retest at 109 materialises today, preferably in the shape of a H4 bullish candlestick signal (entry and risk level can be set according to the candlestick pattern’s structure), an intraday long position may be in the offing. In terms of take-profit targets, traders likely have their crosshairs fixed on weekly resistance underlined above at 109.68, but should anticipate selling off December’s opening level on the H4 at 109.51.
USD/CAD:
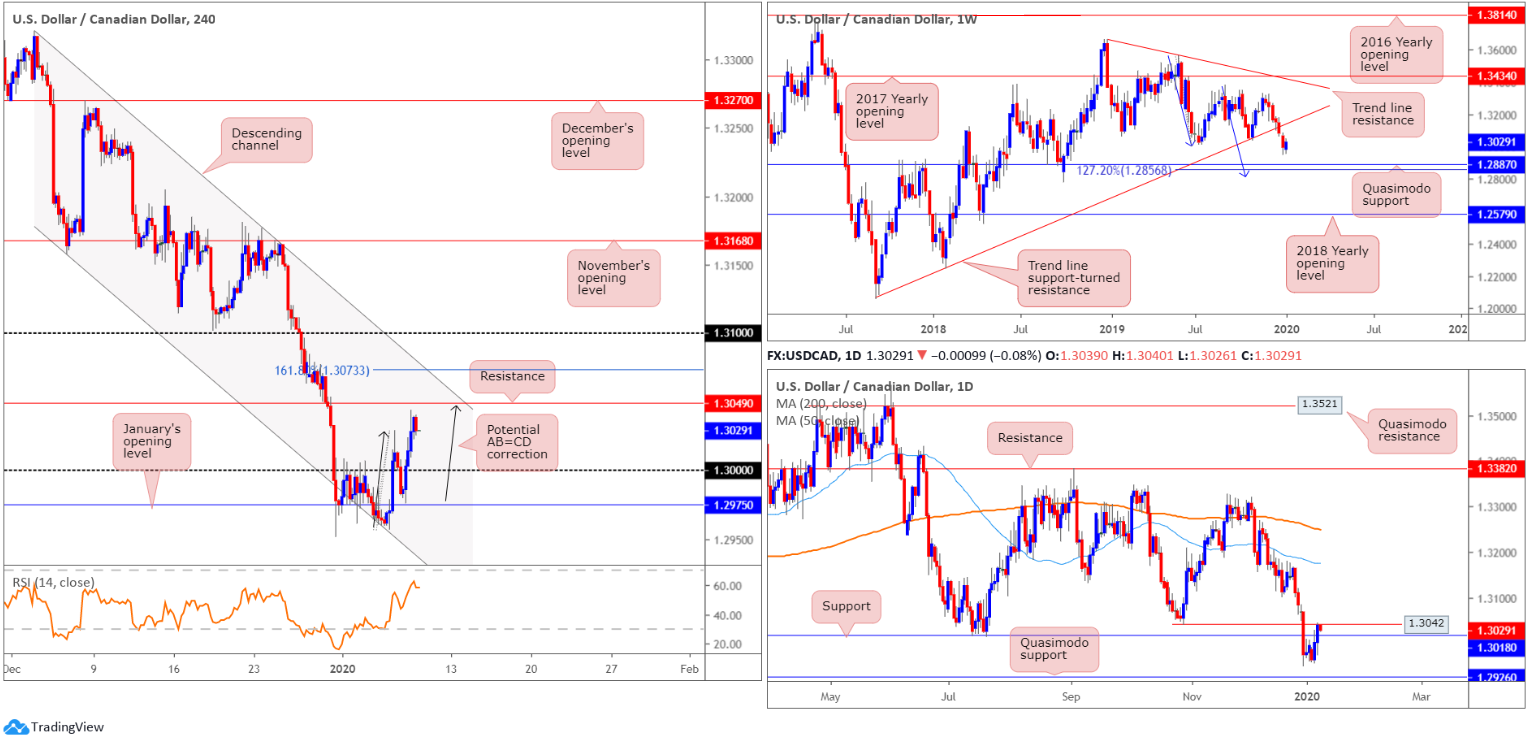
As tensions in the Middle East calmed, WTI retraced more than 4.00% Wednesday, weighing on the Canadian dollar. This – coupled with a strong dollar bid – guided USD/CAD to higher ground, reaching peaks of 1.3043.
Technically speaking, H4 price is seen selling off a few points south of resistance (prior Quasimodo support) at 1.3049, which, as you can see, merges closely with an AB=CD completion (black arrows). The next downside target from this point falls in around the key figure 1.30, though daily support at 1.3018 may draw in buyers earlier than expected. Beyond 1.30, January’s opening level at 1.2975 resides as additional support.
On a wider perspective, daily price displays swing resistance around the 1.3042 region, currently holding price lower, as we write. Support, as highlighted above, falls in close by at 1.3018.
Weekly flow, on the other hand, continues to reflect a bearish position, displaying scope to test Quasimodo support at 1.2887, positioned close by a 127.2% AB=CD bullish correction (blue arrows) at 1.2856. As such, 1.2856/1.2887 on the weekly timeframe is likely a base active buyers reside.
Areas of consideration:
Keeping things simple this morning, H4 resistance at 1.3049 is likely on the radar for possible shorting opportunities. Knowing this level comes with AB=CD convergence, nearby daily resistance already in motion at 1.3042 and weekly price suggesting further declines could be in store, a short from here, with a protective stop-loss order sited above the 161.8% Fibonacci extension at 1.3073, is certainly an option, targeting 1.3018, 1.30 and 1.2975.
USD/CHF:
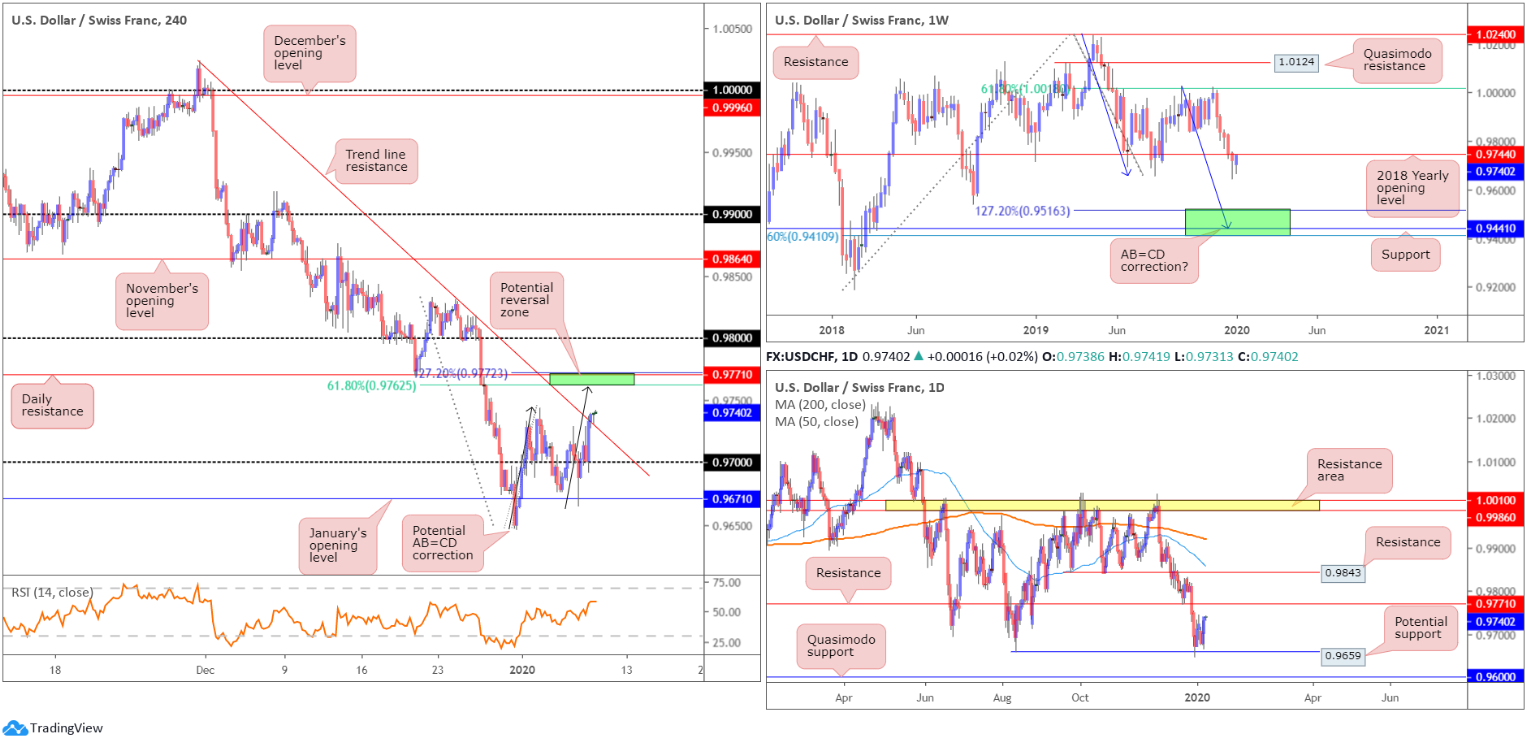
After US President Donald Trump stated no Americans were harmed in the Iranian missile strikes, and added Iran appears to be backing away from conflict with the US, safe-haven demand diminished. This, alongside broad-based USD bidding and upbeat ADP employment, USD/CHF explored higher ground north of 0.97 and concluded Wednesday closing marginally above H4 trend line resistance, extended from the high 1.0023.
According to the H4 timeframe, further buying towards daily resistance at 0.9771 is possible. Note this level merges closely with a 127.2% H4 AB=CD bearish correction (black arrows) and a 61.8% H4 Fibonacci resistance at 0.9762 (green). Also notable is the weekly timeframe: the 2018 yearly opening level at 0.9744.
Areas of consideration:
While some H4 buyers may load up on the break of the trend line resistance, entering long knowing higher-timeframe resistance resides nearby is chancy.
Therefore, daily resistance at 0.9771 is in focus today for possible shorting opportunities. Coupled with its H4 confluence, this area is considered a high-probability reversal zone, targeting the current H4 trend line as the initial take-profit area.
Dow Jones Industrial Average:
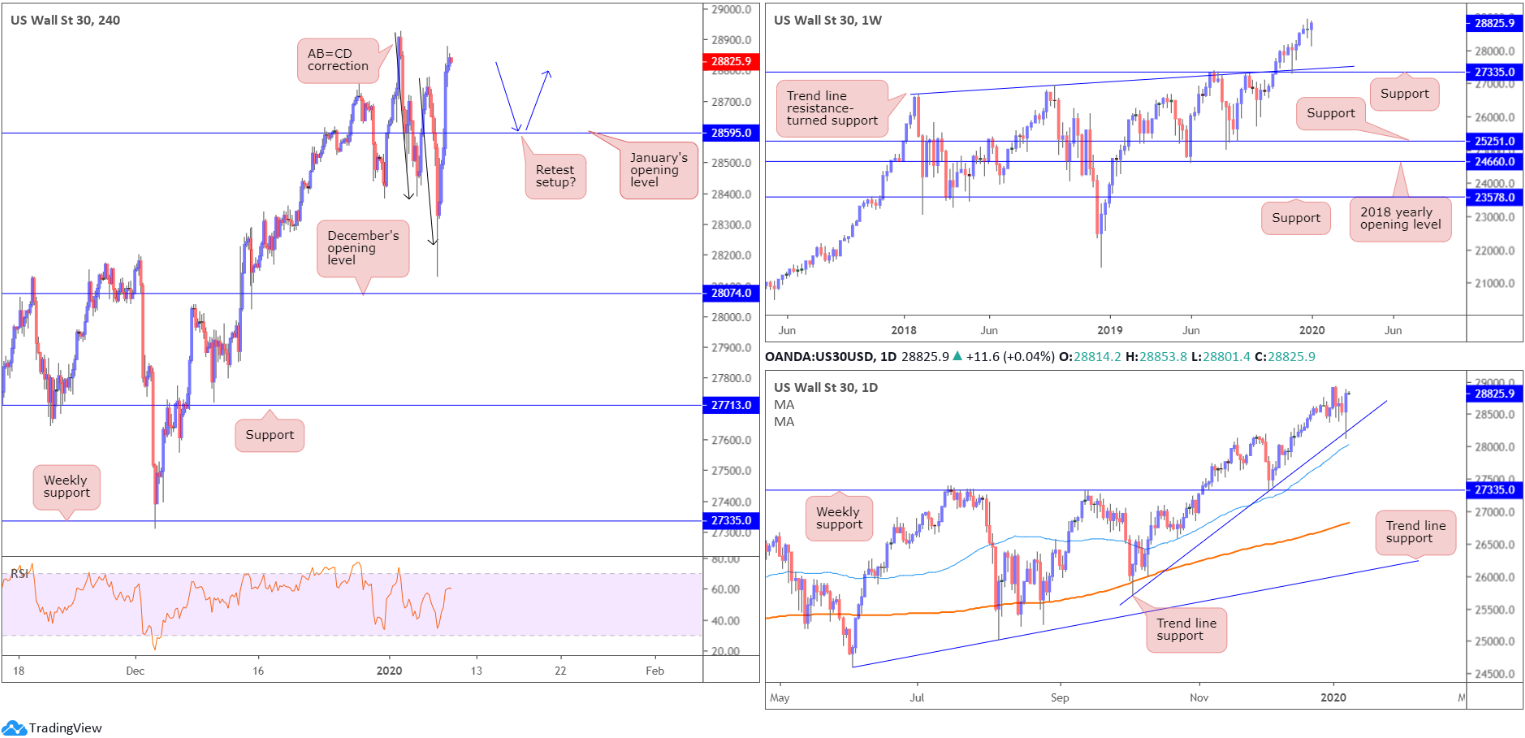
Major US equity benchmarks advanced and US Treasuries declined Wednesday, after President Donald Trump toned down rhetoric against Iran. The Dow Jones Industrial Average added 161.41 points, or 0.56%; the S&P 500 added 15.87 points, or 0.49% and the tech-heavy Nasdaq 100 rose 65.92 points, or 0.75%.
The technical setting, based on the H4 timeframe, had price cross above January’s opening level at 28595 in strong fashion, extending gains off the recently formed AB=CD bullish correction (black arrows) from 28233. The move effectively repositioned the spotlight back at all-time highs of 28925.
Weekly price is pretty much unchanged, though appears to be in the process of completing a strong buying tail, also known as a hammer candlestick formation. In terms of structure, price continues to remain buoyant above support drawn from 27335, along with trend line support etched from the high 26670.
Meanwhile, on the daily timeframe, trend line support, extended from the low 25710, entered the fray in recent movement, bolstered by additional support nearby from the 50-day SMA (blue – 28038).
Areas of consideration:
With the uptrend remaining in a strong position, and daily price recently shaking hands with trend line support, a retest at January’s opening level from 28595 may be in the offing today (blue arrows). A retest motion in the form of a H4 bullish candlestick pattern not only helps identify buyer intent, it provides entry and risk levels to work with. A long from here has the all-time high at 28925 set as the initial take-profit target.
XAU/USD (GOLD):
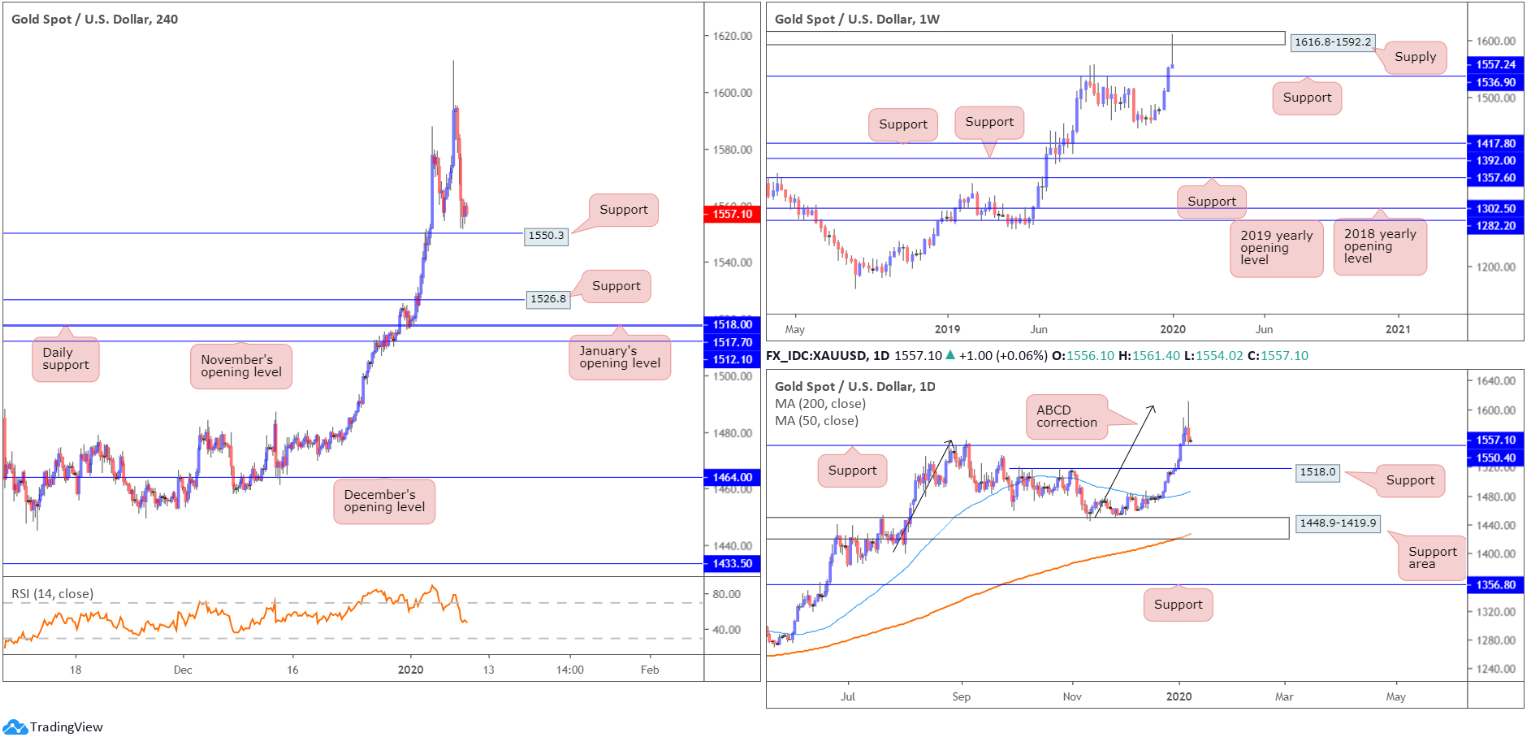
As tensions in the Middle East eased, and US ADP employment reported a better-than-anticipated headline figure, the US dollar firmed, weighing on bullion.
Weekly supply at 1616.8-1592.2, as you can see, entered the mix yesterday, adding to the selling pressure. Support on the weekly timeframe is seen reasonably close by at 1536.9. In similar fashion to the weekly timeframe, the daily chart has support in sight at 1550.4, with a break exposing another layer of support pencilled in nearby at 1518.0. What’s also interesting on the daily timeframe is the recently formed ABCD bearish correction (black arrows) at 1608.0. It might also be worth noting both the 200/50-day SMAs point north (orange – 1427.3/blue – 1486.6), with the 50-SMA drifting north of the 200-SMA.
Lower down on the curve, the H4 candles hover north of a support level at 1550.3, a previous Quasimodo resistance. Note this level converges with daily support at 1550.4, and is positioned slightly above weekly support at 1536.9. Also likely appealing from a buyer’s perspective is the sell stops triggered from beneath the 1554.8 January 7 low, which provides liquidity to buy into.
Areas of consideration:
A H4 bullish candlestick signal produced off H4 support at 1550.3 today will likely attract buyers into this market seeking a ‘buy-the-dip scenario’. A H4 bullish candlestick pattern such as a hammer formation or an engulfing pattern helps recognise buyer intent, and provides the option of using the pattern’s structure to base entry and risk levels. Conservative traders, though, will likely site protective stop-loss orders beneath weekly support at 1536.9.
(Italics represents previous analysis)
The accuracy, completeness and timeliness of the information contained on this site cannot be guaranteed. IC Markets does not warranty, guarantee or make any representations, or assume any liability regarding financial results based on the use of the information in the site.
News, views, opinions, recommendations and other information obtained from sources outside of www.icmarkets.com.au, used in this site are believed to be reliable, but we cannot guarantee their accuracy or completeness. All such information is subject to change at any time without notice. IC Markets assumes no responsibility for the content of any linked site.
The fact that such links may exist does not indicate approval or endorsement of any material contained on any linked site. IC Markets is not liable for any harm caused by the transmission, through accessing the services or information on this site, of a computer virus, or other computer code or programming device that might be used to access, delete, damage, disable, disrupt or otherwise impede in any manner, the operation of the site or of any user’s software, hardware, data or property.


