
Key risk events today:
BoE Gov Bailey Speaks; BoC Gov Macklem Speaks; US Unemployment Claims.
(Previous analysis and outside sources – italics).
EUR/USD:
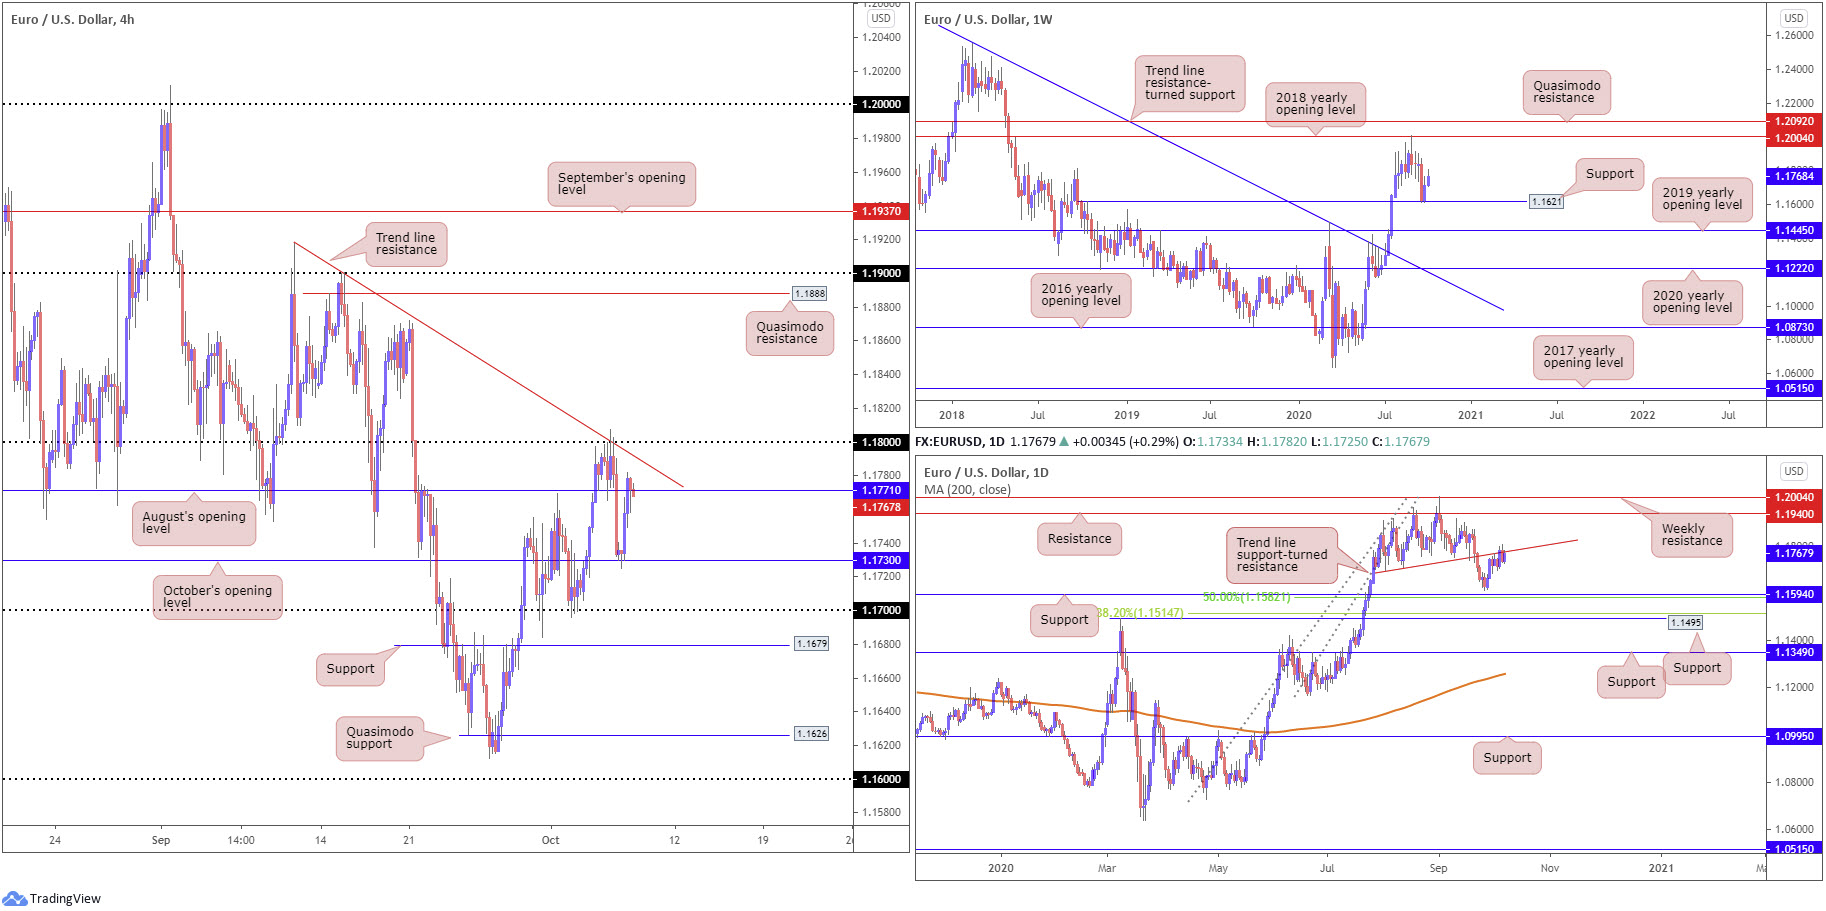
Bolstered on the back of underlying support from a weaker buck amid an improvement in risk sentiment, Europe’s shared currency defended October’s opening value at 1.1730 on the H4 timeframe Wednesday and drove price into August’s opening value at 1.1771. Overhead, trend line resistance, taken from the high 1.1917, and the 1.18 handle is visible. Beyond here, we do not see much on offer until Quasimodo resistance at 1.1888.
Further out on the weekly timeframe, price action recently responded to minor support at 1.1621, set just north of the 2019 yearly opening value at 1.1445. An extension to the upside potentially throws the 2018 yearly opening value at 1.2004 back into action. A closer reading of price action on the daily timeframe reveals the unit challenging a trend line support-turned resistance, etched from the low 1.1695. Removing this line calls for resistance at 1.1940, whereas a rejection shines the spotlight on support at 1.1594 (and 50.0% retracement ratio at 1.1582).
Areas of consideration:
In the event 1.18 surrenders, a continuation to H4 Quasimodo resistance at 1.1888 could be on the cards. In line with weekly direction, climbing above 1.18 is potentially appealing to intraday breakout buyers (conservative traders, nevertheless, are likely to seek at least a 1.18 retest before committing).
Failure to hold above August’s opening value at 1.1771 (H4) points to a retest of October’s opening value at 1.1730 and maybe a test of 1.17, in line with daily price off trend line resistance.
GBP/USD:
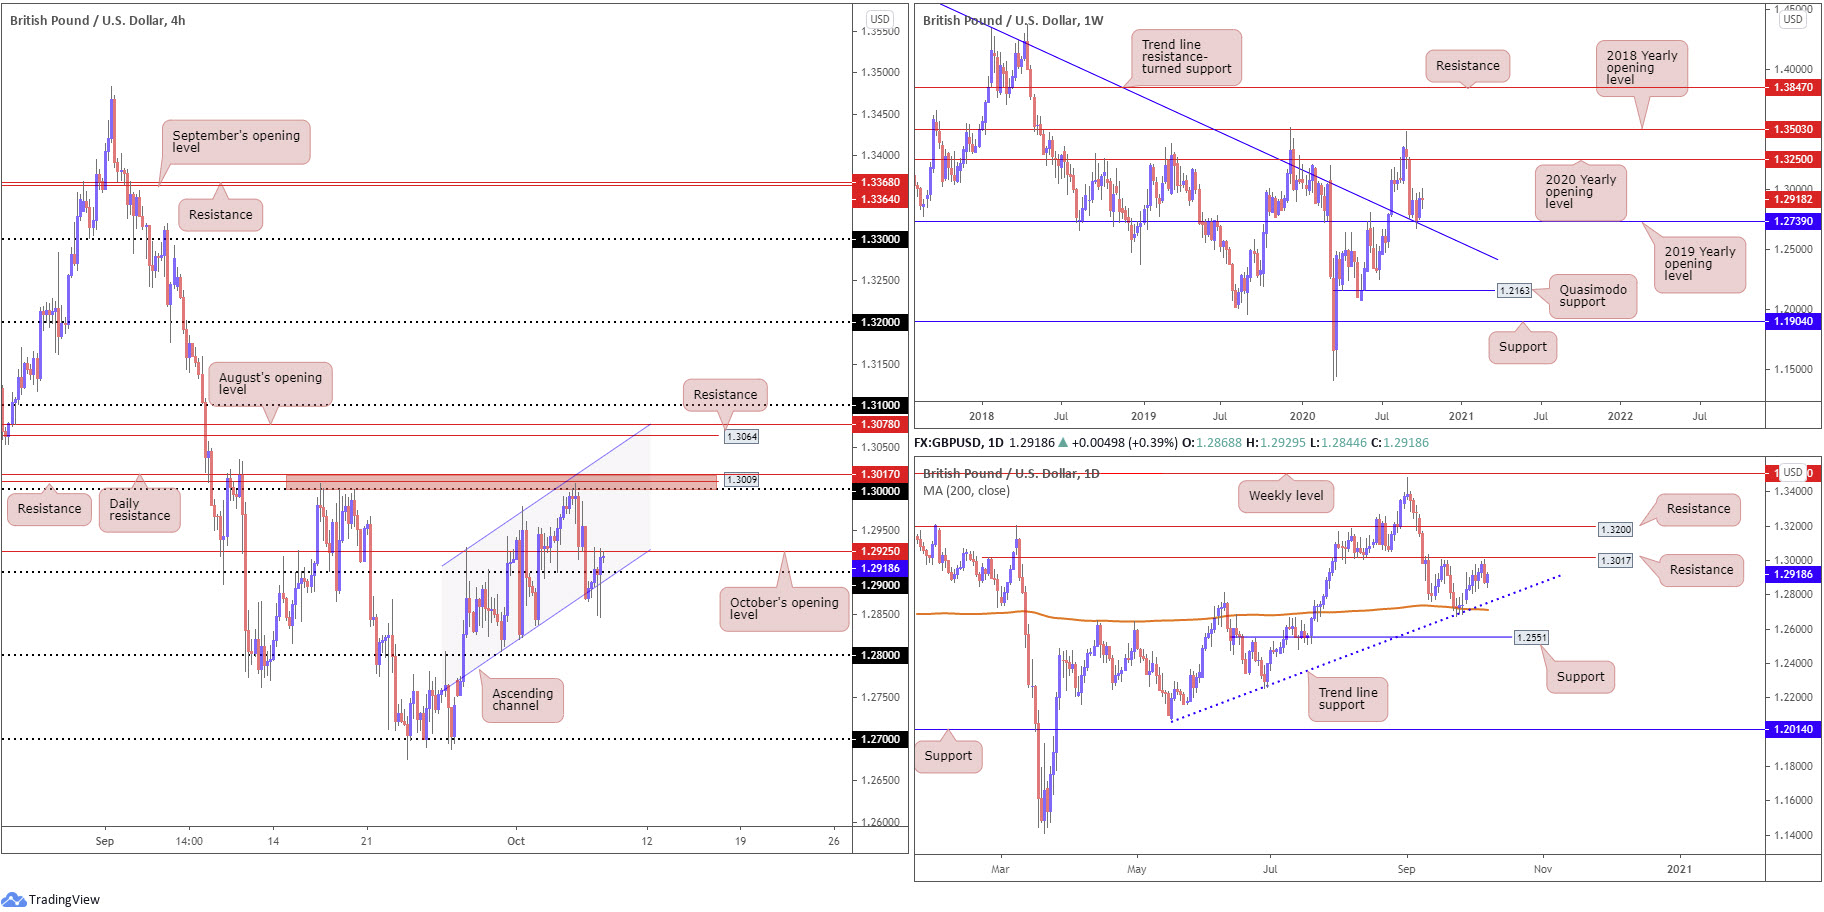
Despite Wednesday having dipped a toe in waters below H4 channel support, taken from the low 1.2805, a downturn in the buck provided enough impetus to print a mild recovery north of the 1.29 handle. H4, as you can see, is now challenging the underside of October’s opening value at 1.2925, though a violation here could transfer energy back towards the key figure 1.30 ([red] surrounded by H4 resistance at 1.3009 and daily resistance at 1.3017).
From the weekly timeframe, GBP/USD finished last week higher by nearly 200 points after crossing swords with support at 1.2739, a 2019 yearly opening value. Technicians will acknowledge the level also blends with trend line resistance-turned support, extended from the high 1.5930. In terms of resistance, price has room to advance as far north as the 2020 yearly opening value at 1.3250. Crossing 1.2739, on the other hand, registers a bearish setting, with the 1.2251 June 29 low targeted, closely shadowed by Quasimodo support priced in at 1.2163.
On the daily timeframe, levels to be aware of are the 200-day SMA (orange – 1.2711) and joining trend line support, extended from the low 1.2075, along with 1.3017 resistance.
Areas of consideration:
1.3017/1.30 resistance (red area on the H4) remains a zone to be mindful of, particularly if H4 makes it back above October’s opening value at 1.2925. A break of the latter is also likely to spark intraday bullish scenarios to 1.30.
Violating 1.29 and channel support (H4), extended from the low 1.2805, helps confirm bearish strength south of daily resistance at 1.3017 and also demonstrates weekly buyers may lack enthusiasm off 1.2739. Intraday bears under H4 channel support, therefore, may hone in on 1.28, which happens to merge closely with daily trend line support coming in from the low 1.2075.
AUD/USD:
Broad-based USD softness elevated AUD/USD higher Wednesday, consequently scraping back a portion of Tuesday’s 1% drop.
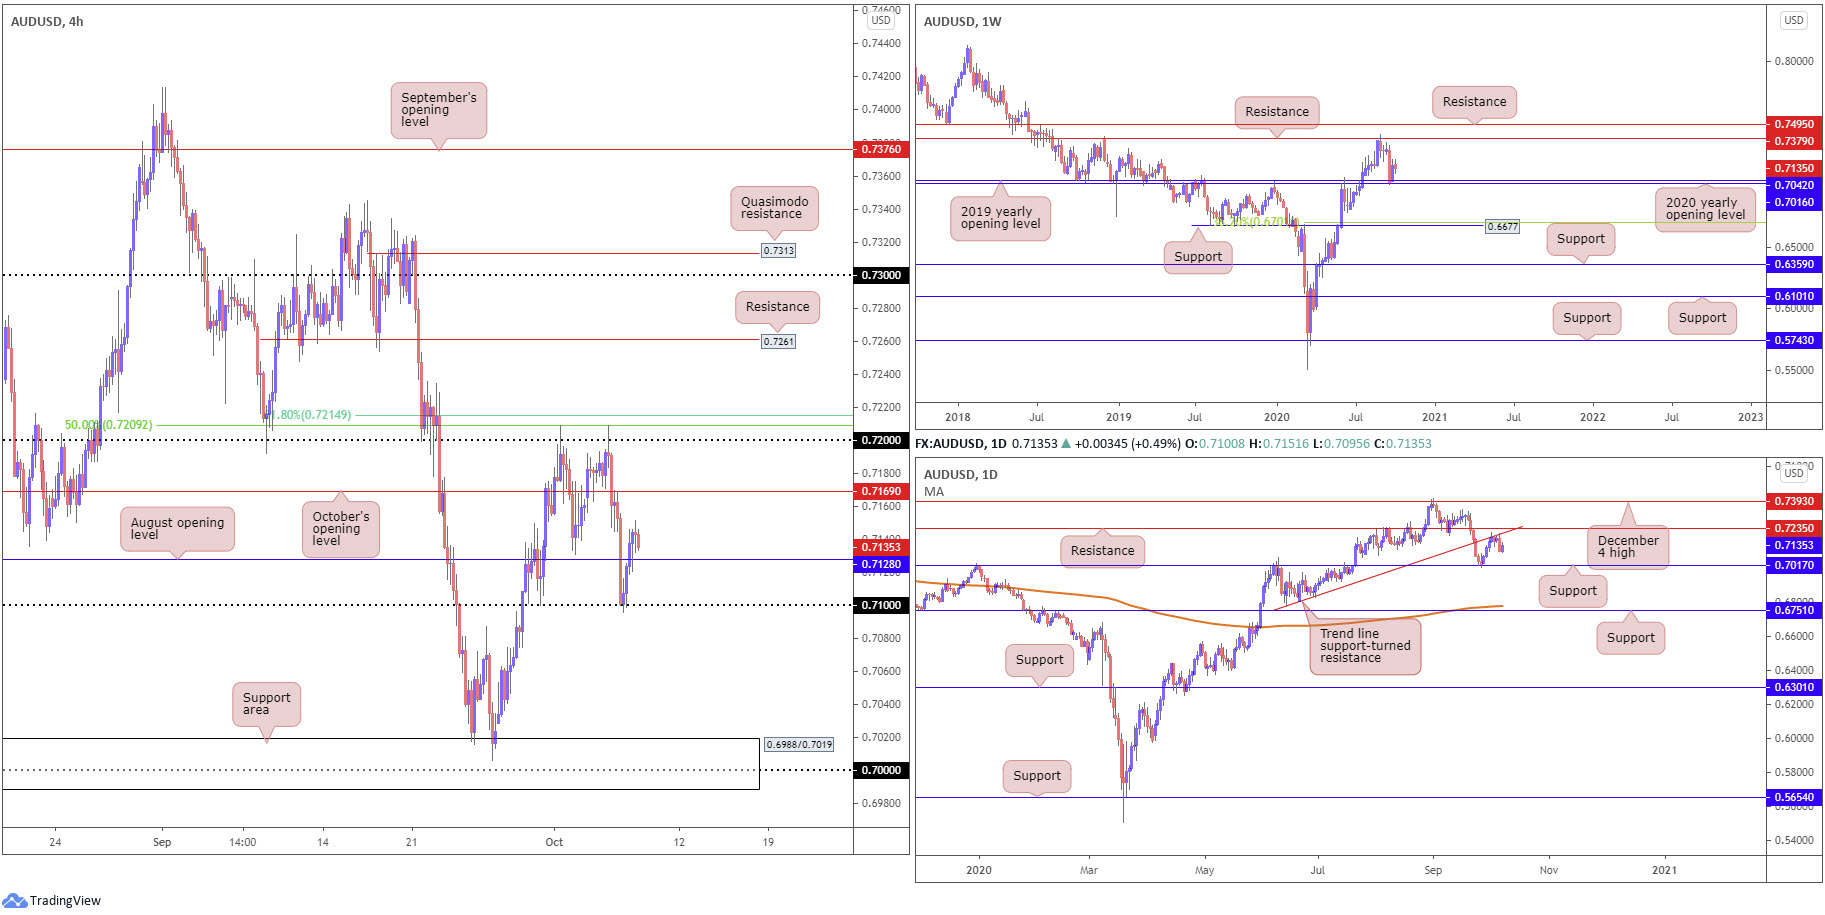
Technical impetus off the 0.71 handle (H4) likely lent a helping hand, powering the candles through August’s opening value at 0.7128 and shining the light on October’s opening value at 0.7169. Dropping through 0.71, however, hints at a possible attempt to reach a support area at 0.6988/0.7019 (holds the key figure 0.70 within), while retesting 0.7128 as support could excite intraday dip-buyers to zero in on 0.7169.
From the weekly timeframe (unchanged since Monday’s weekly report):
Buyers pencilled in a strong presence off the 2020 and 2019 yearly opening values at 0.7016 and 0.7042 last week, respectively, following a 3.6% decline the week prior. Additional bullish sentiment could target as far north as resistance at 0.7379. It might also be worth noting the trend in this market remains to the upside, therefore the rebound from 0.7016/0.7042 may be interpreted as a dip-buying signal. Should the market fail to extend recovery gains, support priced in at 0.6677 is next in the firing range, alongside a 38.2% Fibonacci retracement ratio at 0.6701.
From the daily timeframe, trend line support-turned resistance, extended from the low 0.6776, remains an active base, guiding candle action sharply lower on Tuesday. Support at 0.7017 is seen as the next downside target from here, with a break exposing the 200-day SMA (orange – 0.6779).
Areas of consideration:
Retesting August’s opening value at 0.7128 on the H4 may fuel buyers to rebound price and approach October’s opening value at 0.7169. Beyond here, traders would be looking at 0.72.
Sliding through 0.71, on the other hand, could encourage bearish themes towards the H4 support area at 0.6988/0.7019. A retest at the underside of 0.71 would likely be a welcomed sight from conservative sellers, particularly those threatened by the rebound from weekly support.
USD/JPY:
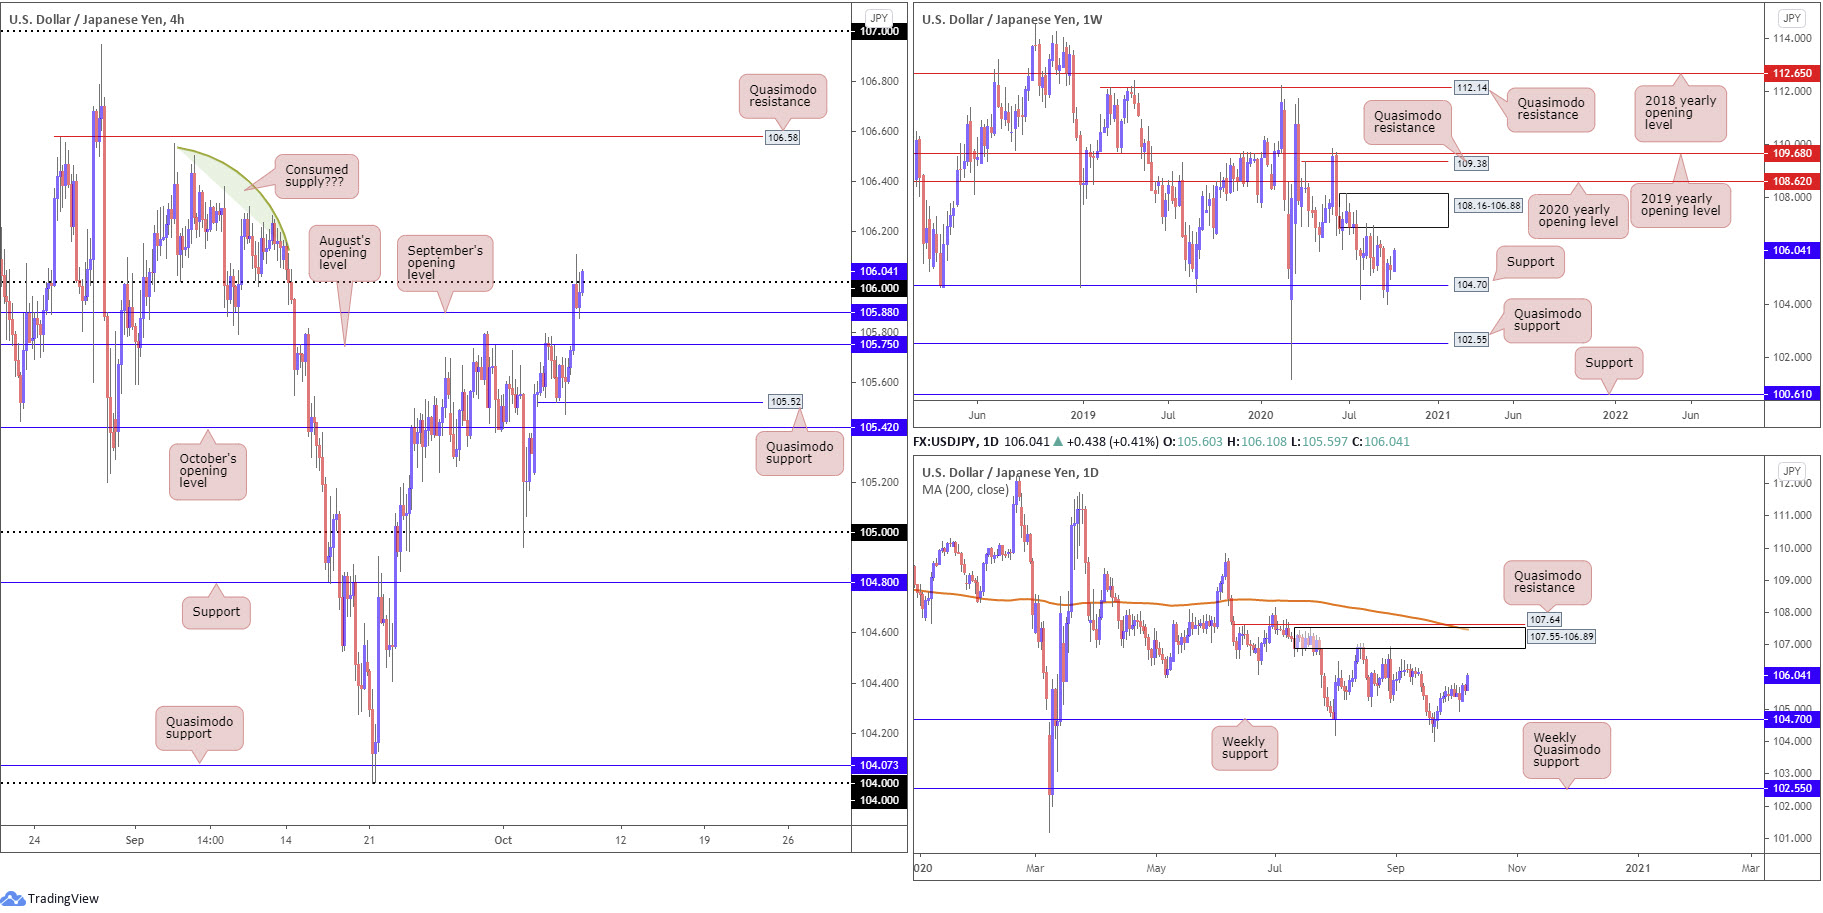
USD/JPY bulls went on the offensive Wednesday as investors shifted away from the perceived safety of the Japanese yen in favour of riskier assets. Following a swift retest at the top edge of September’s opening value from 105.88 (H4), intraday flow is on course to overthrow 106 and shine the spotlight on Quasimodo resistance at 106.58.
From the weekly timeframe (unchanged since Monday’s weekly report):
Supply at 108.16-106.88 remains prominent on the weekly timeframe, capping upside since price made its way off support at 104.70 at the end of July. The aforementioned support also recently made a second showing, with price rebounding nearly 1%. Both areas, therefore, remain firmly on the watchlist.
From the daily timeframe (unchanged since Monday’s weekly report):
Supply at 107.55-106.89, an area housed within the lower boundary of weekly supply mentioned above at 108.16-106.88, remains on the radar. Upside momentum derived from weekly support at 104.70 highlights the possibility of readdressing the aforementioned supply. Of note, the daily area also benefits from nearby Quasimodo resistance at 107.64 and the 200-day SMA (orange – 107.47).
Areas of consideration:
For those who read Wednesday’s technical briefing you may recall the following (italics):
According to the higher timeframes, bulls may eventually take over until reaching the 106.88/89ish region (the lower edges of higher timeframe supply). Consequently, breakout moves above 106 are still likely watched going forward.
H4 settling above the 106, therefore, could stimulate activity towards H4 Quasimodo resistance at 106.58, followed by 106.88/89. A successful 106 retest as support might also demonstrate willingness from buyers.
USD/CAD:
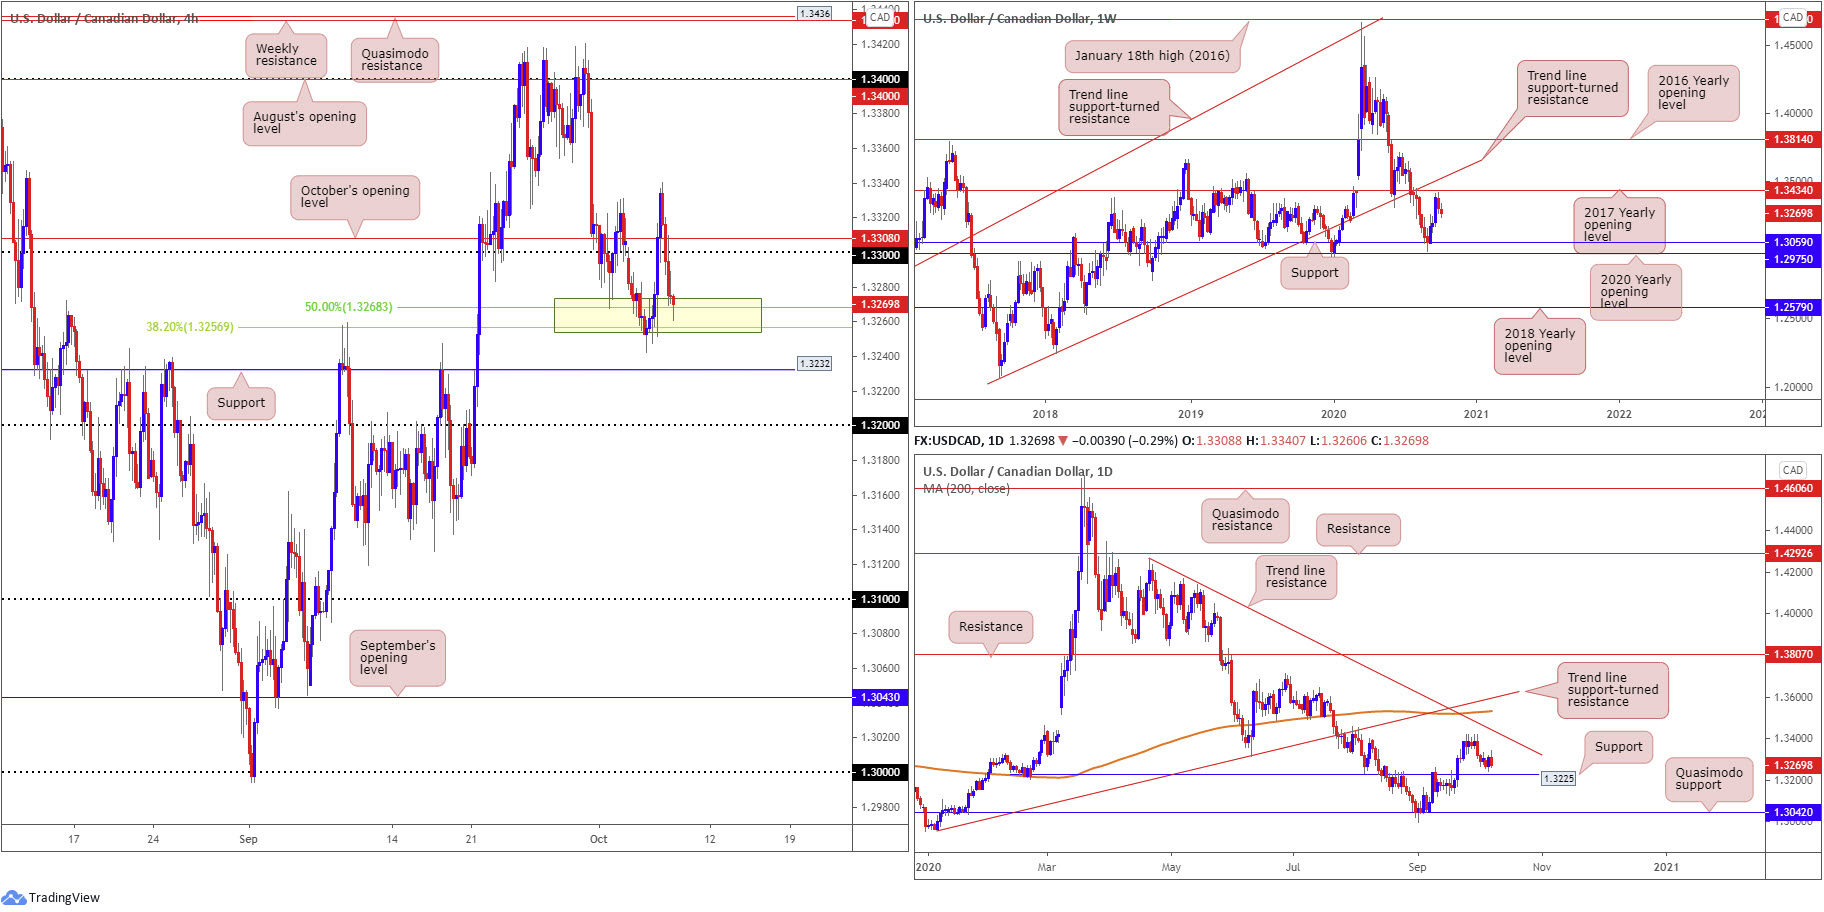
USD/CAD (H4) found thin air above the 1.33 handle and October’s opening value at 1.3308 on Wednesday, as WTI held onto a modestly positive tone and the DXY twisted lower.
Technically, this has seen H4 candles return to a Fib combination (38.2% Fibonacci retracement ratio at 1.3256/50.0% retracement ratio at 1.3268 – yellow). Should we fail to defend the latter today, support at 1.3232 is likely to move in.
Further afield on the weekly timeframe, price recently came within touching distance of the 2017 yearly opening value at 1.3434 (sited just under trend line support-turned resistance, taken from the low 1.2061). Follow-through selling could eventually tug the currency pair back to support at 1.3059, pinned just north of the 2020 yearly opening value at 1.2975.
Daily price demonstrates room for sellers to push for support coming in at 1.3225. Resistance on the daily timeframe, nonetheless, is not expected to make an appearance until trend line resistance, etched from the high 1.4265. Directly above here also rests the 200-day SMA (orange – 1.3532) and a trend line support-turned resistance, taken from the low 1.2957.
Areas of consideration:
Rebounding out of 1.3256/1.3268 on the H4 is, of course, an option today, with price potentially to try and muster enough strength to hold north of 1.33. Above here, 1.34/August’s opening value is seen as the next upside target.
Another H4 level worth taking into account, in the event buyers fails to find grip, is support priced in at 1.3232, owing to the base fusing with daily support at 1.3225.
USD/CHF:
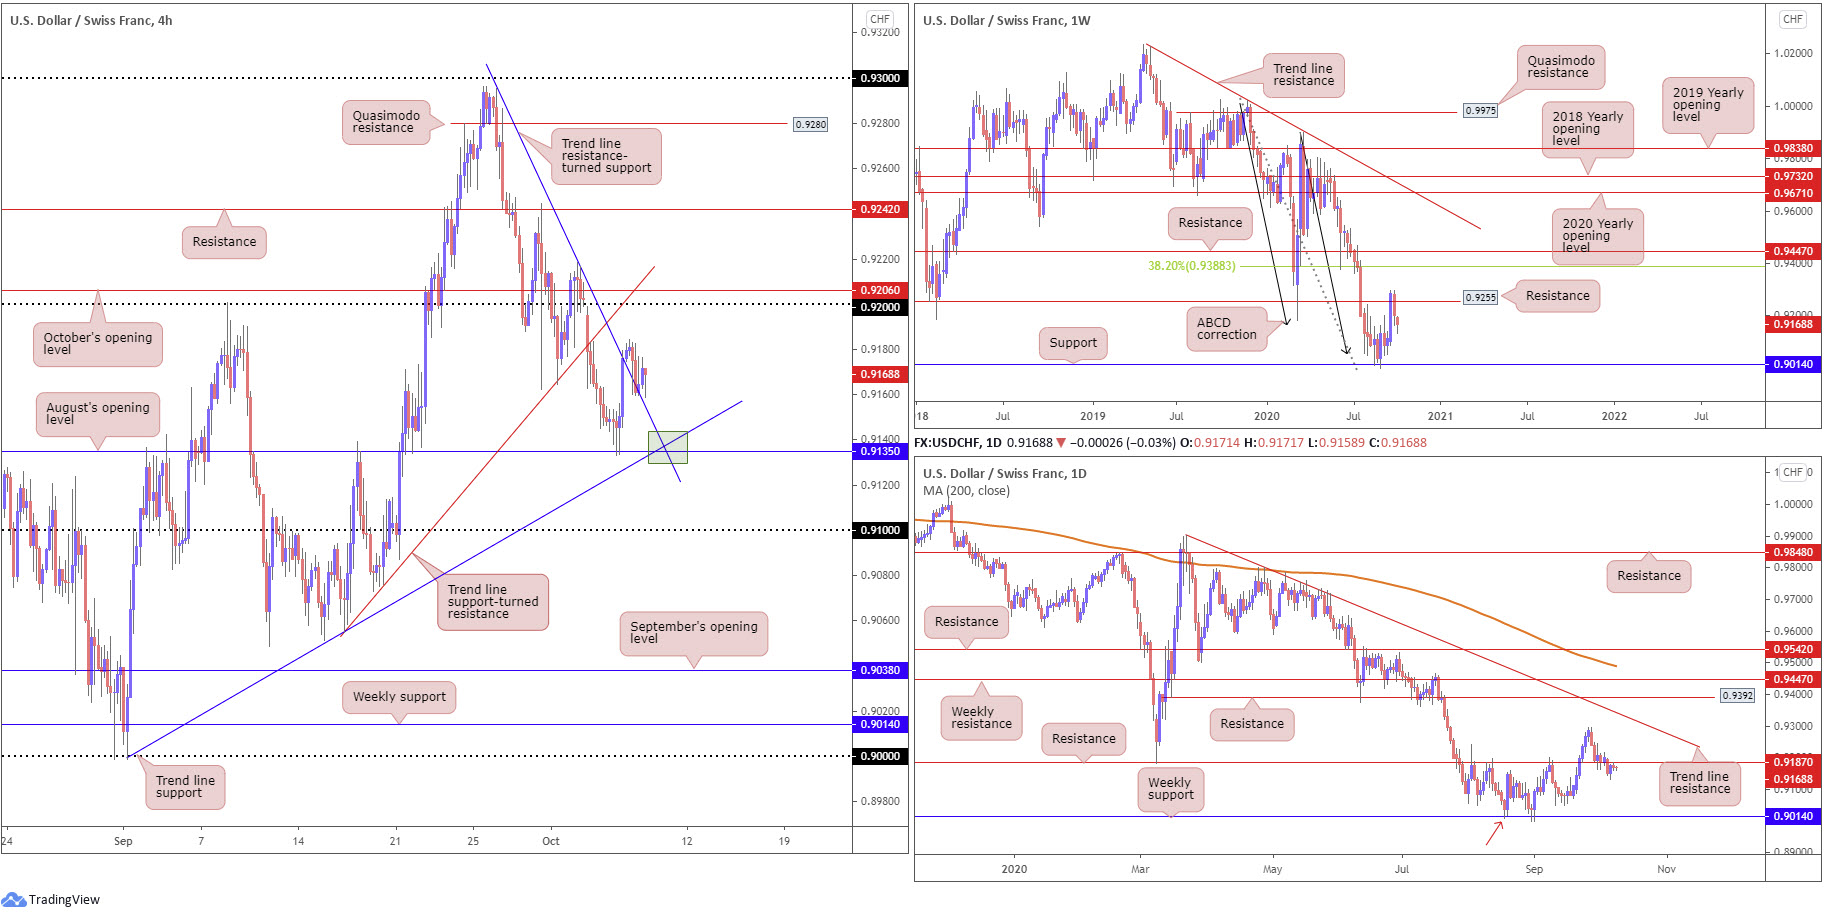
The US dollar nudged a shade lower against the Swiss franc on Wednesday, peeling back a portion of Tuesday’s recovery.
Technical flow has weekly price languishing south of resistance at 0.9255 (a previous Quasimodo support level). This follows a recent rebound from support at 0.9014, potentially gleaning additional impetus from ABCD support at 0.9051 (black arrows). Should buyers regain consciousness, the focus above current resistance falls in at a 38.2% Fibonacci retracement ratio at 0.9388, a common take-profit target out of ABCD patterns (derived from legs A-D).
A closer examination of price action on the daily timeframe, nonetheless, reveals the unit absorbing orders around resistance at 0.9187, a critical level during August and September. Dropping through this level (Monday) potentially offers an early cue to further weakness on the weekly timeframe, targeting the aforementioned weekly support (also stands as a Quasimodo support on the daily chart – red arrow).
Meanwhile, on the H4 timeframe we can see the candles retesting trend line resistance-turned support, taken from the high 0.9295. This projects an intraday bullish theme towards the 0.92 base, a level closely shadowed by October’s opening value at 0.9206. Although bulls appear to have the upper hand on the H4 scale right now, traders are urged to pencil in the possibility of a retreat to August’s opening value at 0.9135, particularly at the green area as it is a point where the level merges with two trend line supports (0.9295/0.8998).
Areas of consideration:
According to the weekly and daily timeframes, both charts show scope to explore lower levels. This, of course, places a question mark on the current H4 trend line support and also August’s opening value at 0.9135.
On the basis of the above, H4 buyers are unlikely to see much beyond 0.92. For that reason, the round number may serve as strong resistance for bearish themes. Failure to reach 0.92, with moves under 0.9135 seen, could also catch the attention of intraday breakout sellers, targeting 0.91 as an initial take-profit target.
Dow Jones Industrial Average:
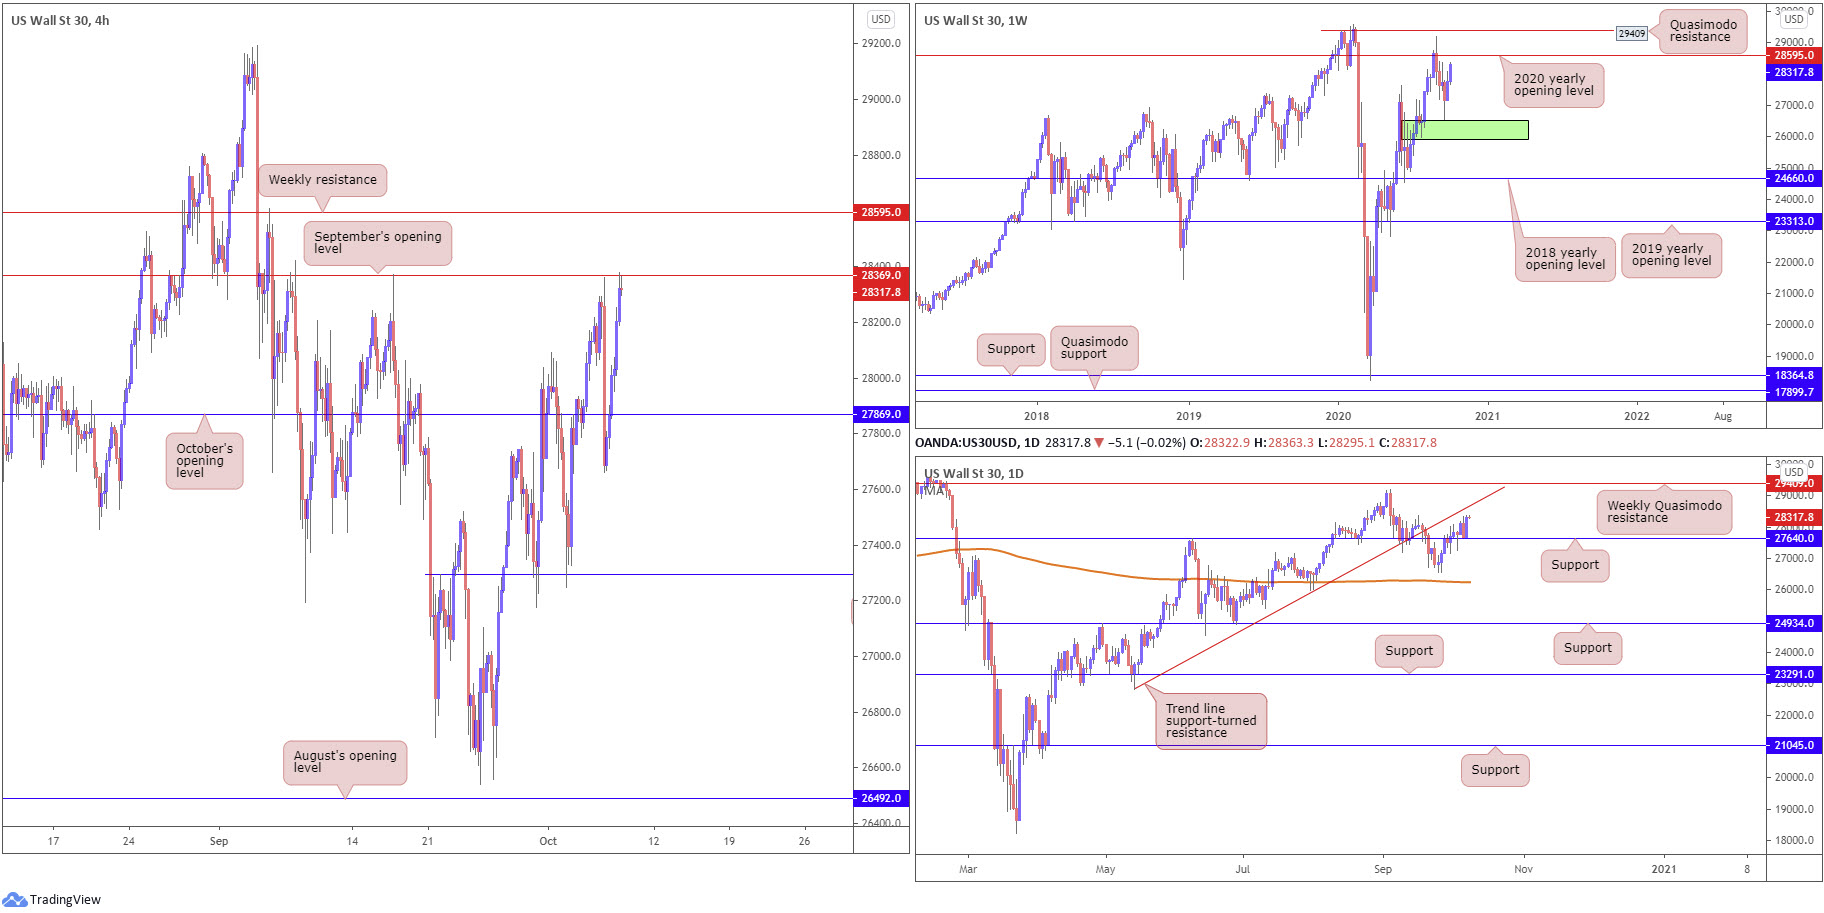
US equity benchmarks finished higher across the board on Wednesday after US President Donald Trump tweeted support for stimulus measures. The Dow Jones Industrial Average advanced 530.70 points, or 1.91%; the S&P 500 climbed 58.50 points, or 1.74% and the Nasdaq traded higher by 210.00 points, or 1.88%.
Wednesday’s sharp recovery has landed weekly price within striking distance of the 2020 yearly opening value at 28595. This follows an earlier rebound north of demand (green) at 25916-26523. From the daily timeframe, the move higher made technical sense, rebounding from support at 27640. Trend line support-turned resistance, extended from the low 22803, is now in the firing line (the aforementioned trend line merges with the 2020 yearly opening value on the weekly timeframe).
Short-term movement, based on the H4 timeframe, observed price action reclaim October’s opening value at 27869 and conclude Wednesday shaking hands with September’s opening value at 28369. While a break of the latter may appeal on the H4, the weekly 2020 yearly opening value at 28595 could prove problematic for buyers, as could the daily trend line resistance.
Areas of consideration:
While technical studies suggest H4 is likely to brush aside September’s opening value at 28369, upside may be limited north of the level at higher timeframe resistances, potentially trapping breakout buyers (bull trap). With this in mind, although mild buying is perhaps in the offing, sellers are expected to make an appearance off 28595.
XAU/USD (GOLD):
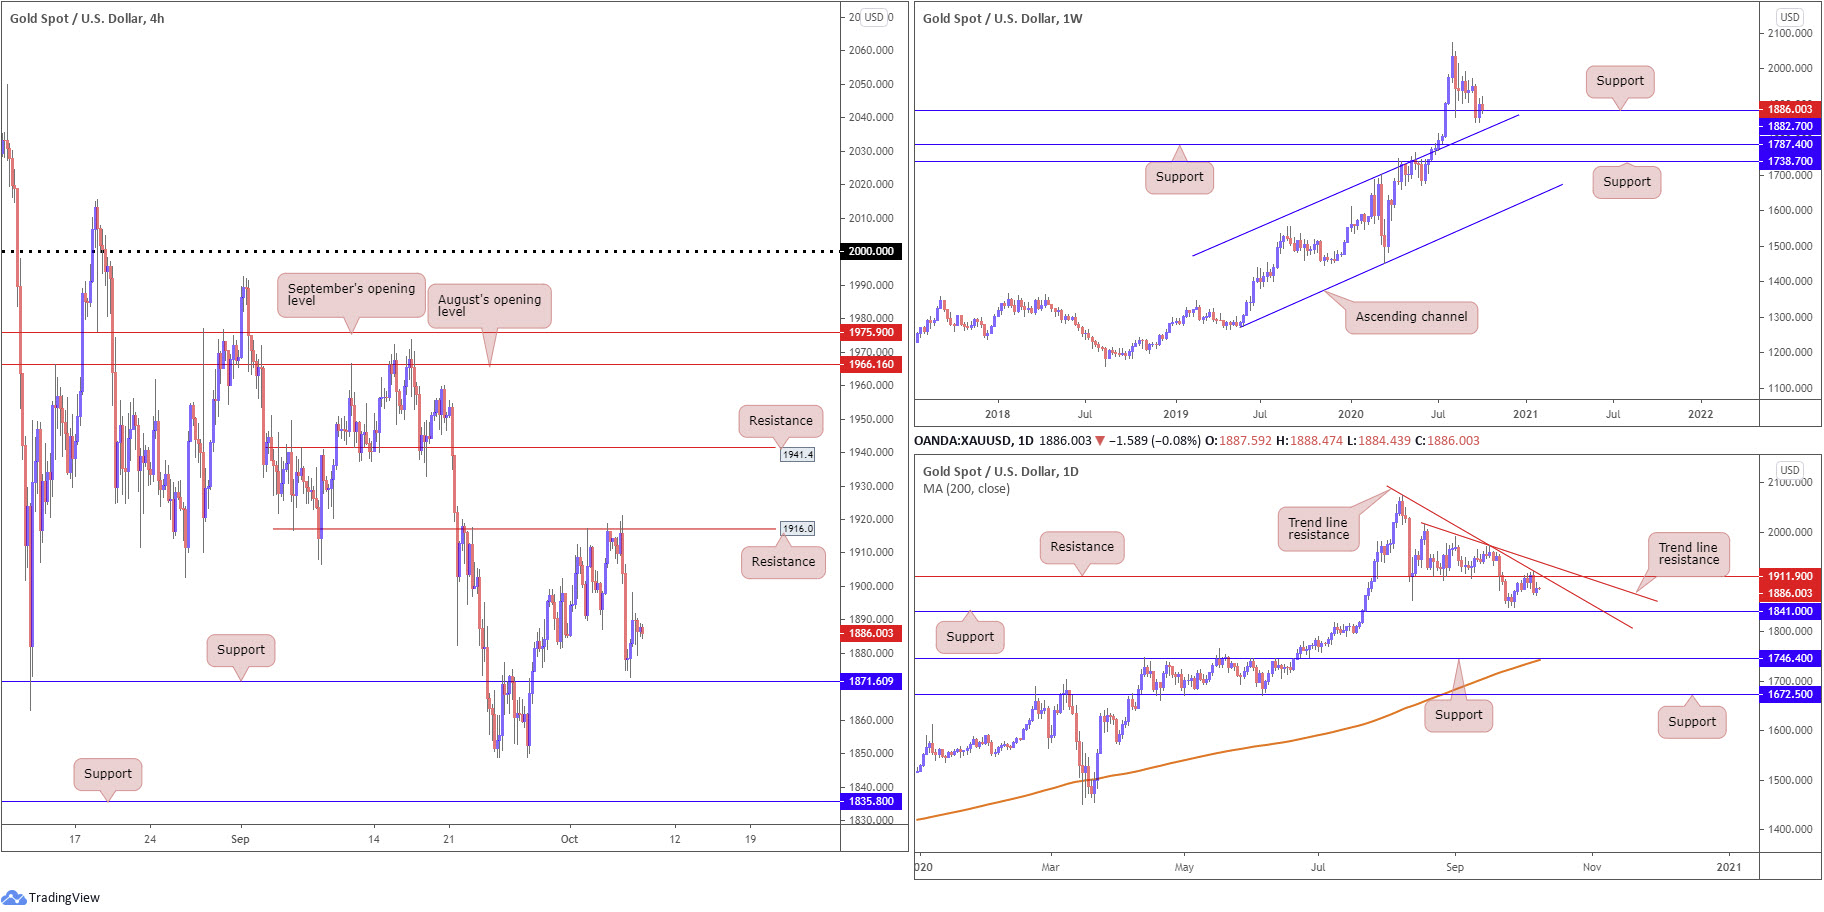
Spot gold pencilled in some upside against the US dollar on Wednesday, though ended the session considerably off best levels.
Following Tuesday’s precipitous decline from H4 resistance at $1,916, Wednesday found a floor a few points ahead of H4 support at $1,871, yet has so far struggled to chalk up much of a bullish response.
Daily price recently receded lower from resistance at $1,911, aided by trend line resistance, extended from the high $2,075. Scope to approach support at $1,841, therefore, is still on the cards. On the weekly timeframe, however, price remains circling a support level at $1,882. In addition to this, the trend in this market has faced decisively north since 2016.
Areas of consideration:
Outlook unchanged.
Traders are likely monitoring H4 support at $1,871 today.
A H4 close below $1,871 could trigger bearish scenarios to H4 support at $1,835, which sits just under daily support at $1,841 (the next downside target on the daily timeframe).
A decisive rebound from $1,871, nevertheless, suggests the pendulum may swing in favour of weekly bulls off support at $1,882.
The accuracy, completeness and timeliness of the information contained on this site cannot be guaranteed. IC Markets does not warranty, guarantee or make any representations, or assume any liability regarding financial results based on the use of the information in the site.
News, views, opinions, recommendations and other information obtained from sources outside of www.icmarkets.com.au, used in this site are believed to be reliable, but we cannot guarantee their accuracy or completeness. All such information is subject to change at any time without notice. IC Markets assumes no responsibility for the content of any linked site.
The fact that such links may exist does not indicate approval or endorsement of any material contained on any linked site. IC Markets is not liable for any harm caused by the transmission, through accessing the services or information on this site, of a computer virus, or other computer code or programming device that might be used to access, delete, damage, disable, disrupt or otherwise impede in any manner, the operation of the site or of any user’s software, hardware, data or property.


