
DXY:
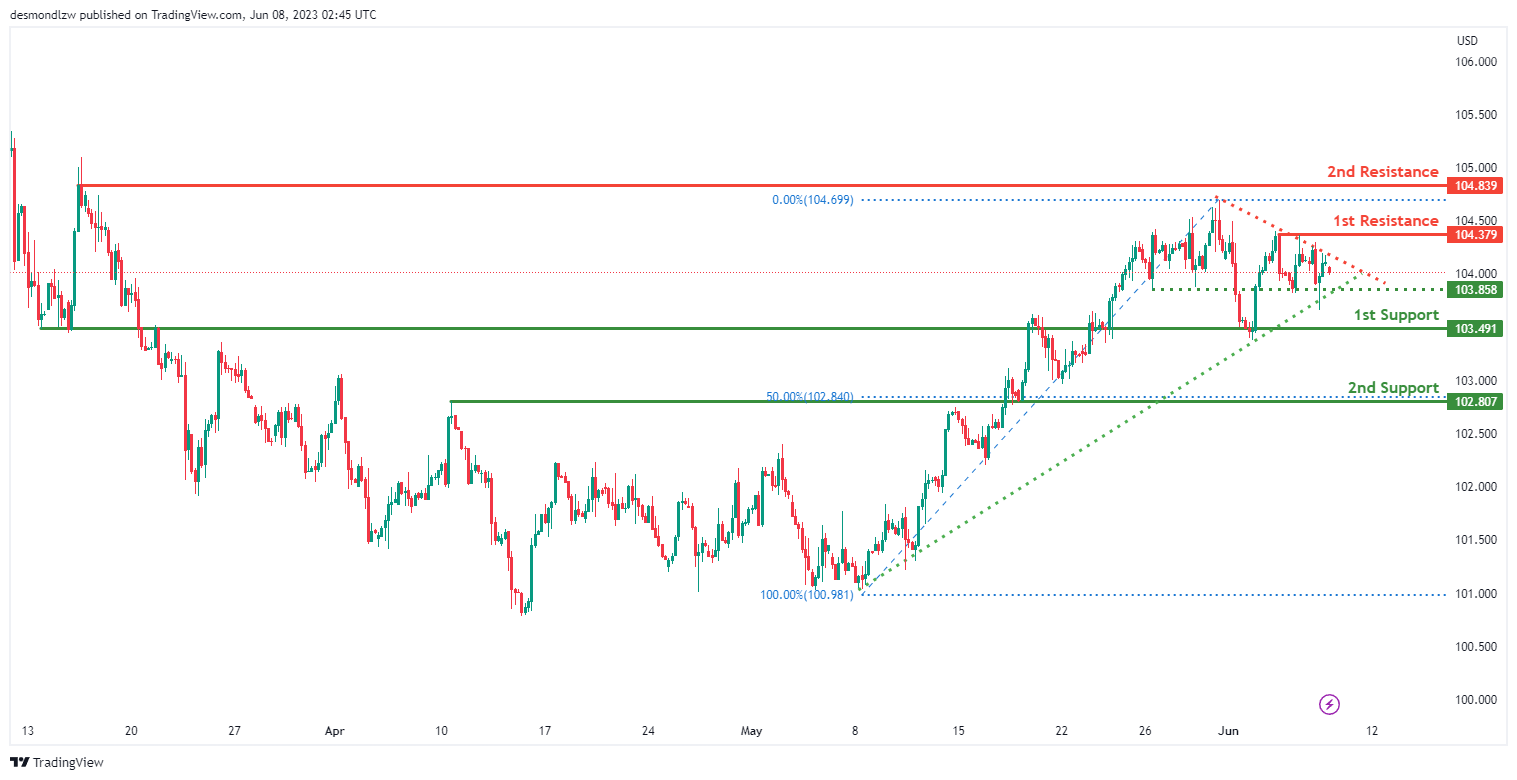
The DXY (US Dollar Index) chart currently shows a neutral momentum, suggesting a lack of clear direction in the market.
Considering this neutral momentum, the price could potentially fluctuate between the first support level at 103.49 and the first resistance level at 104.37.
The first support at 103.49 is identified as an overlap support, while the second support at 102.80 serves as a pullback support, coinciding with the 50% Fibonacci retracement.
On the upside, the first resistance at 104.37 is a multi-swing high resistance, and the second resistance at 104.83 acts as a swing high resistance.
Additionally, the intermediate support at 103.85 serves as a pullback support.
Furthermore, the chart displays a symmetrical triangle pattern, representing a period of consolidation. A breakout above the upper trendline could indicate a bullish breakout, while a breakdown below the lower trendline may suggest a bearish breakdown.
EUR/USD:
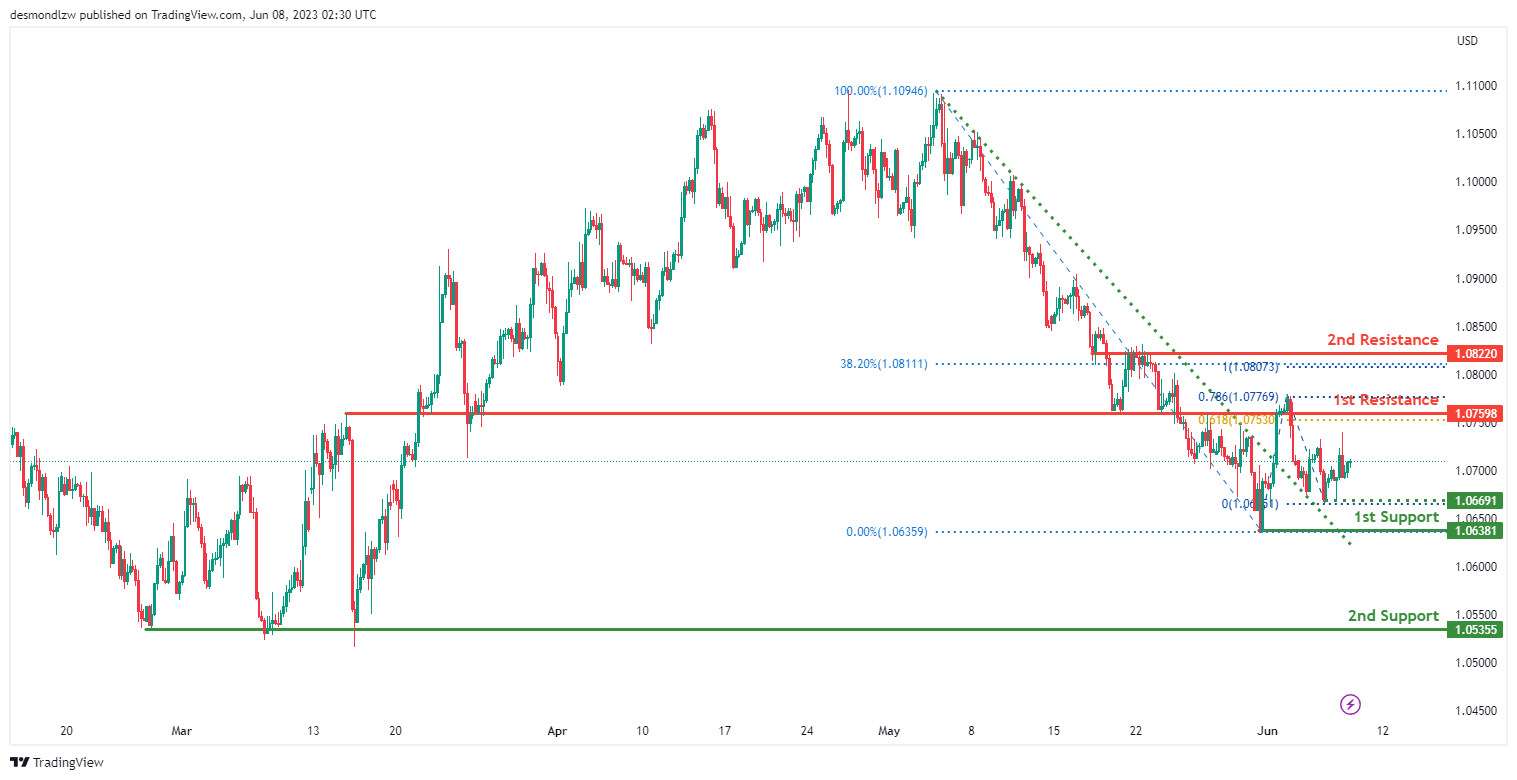
The EUR/USD chart currently demonstrates bullish momentum as the price broke above a descending resistance line, indicating a potential bullish move.
Considering this momentum, there is a possibility that the price may continue its upward trend towards the first resistance level at 1.0759. This level is identified as an overlap resistance and is supported by the 61.80% Fibonacci projection.
Support levels include the first support at 1.0638, representing a swing low support, and the second support at 1.0535, acting as a multi-swing low support.
Furthermore, the second resistance level at 1.0822 is recognized as an overlap resistance and aligns with the 38.20% Fibonacci retracement and 100% Fibonacci projection, making it a notable level to watch.
An intermediate support level at 1.0669 is also identified as a multi-swing low support, adding to its significance.
GBP/USD:
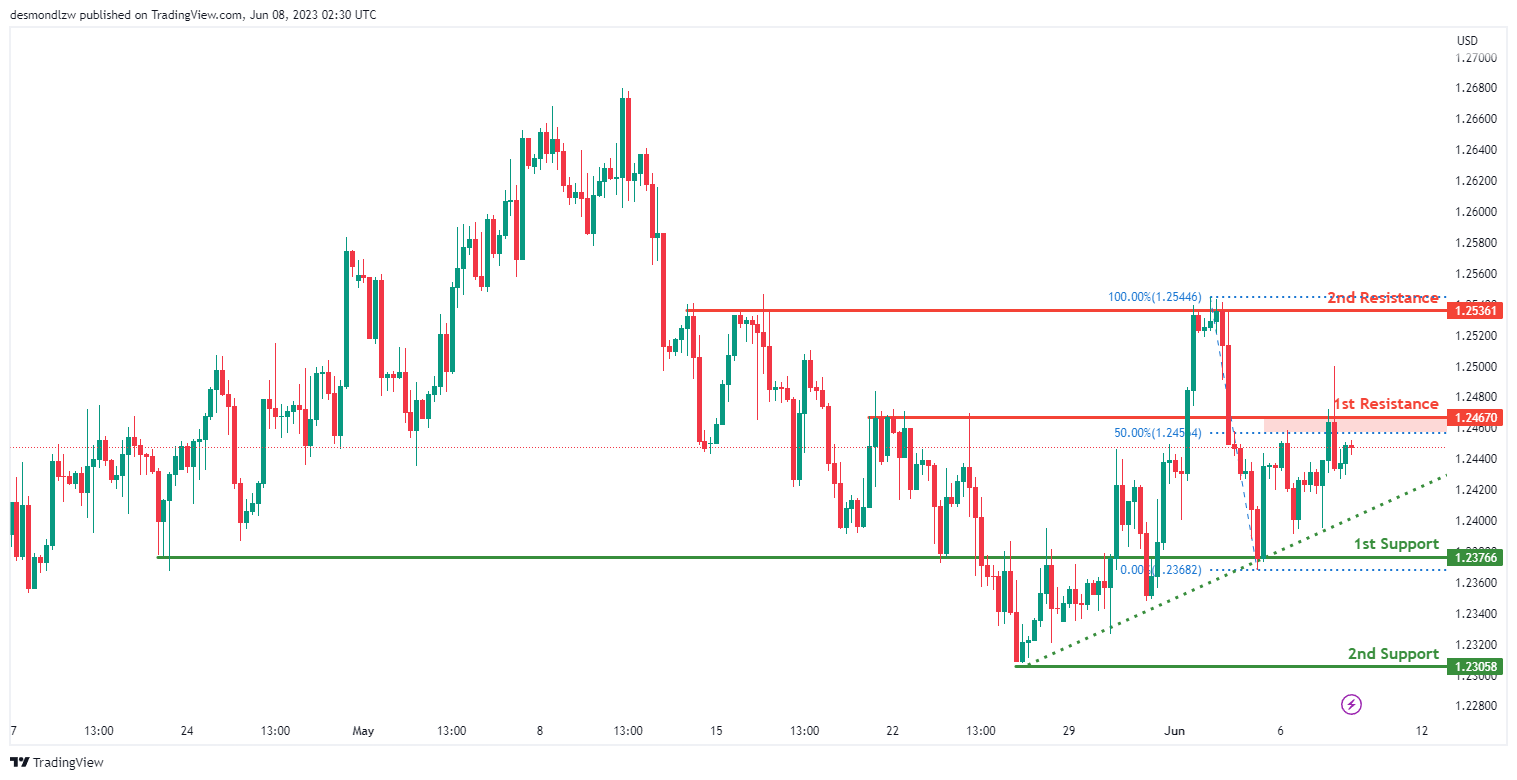
The GBP/USD chart currently demonstrates bullish momentum as the price remains above a major ascending trend line, suggesting the potential for further upward movement.
Considering this momentum, there is a possibility that the price may continue its bullish trend towards the first resistance level at 1.2467. This level is identified as an overlap resistance and is supported by the 50% Fibonacci retracement.
Support levels include the first support at 1.2376 and the second support at 1.2305, both representing swing low supports.
Furthermore, the second resistance level at 1.2536 is recognized as a multi-swing high resistance, adding to its significance as a potential barrier to further upward price movement.
USD/CHF:
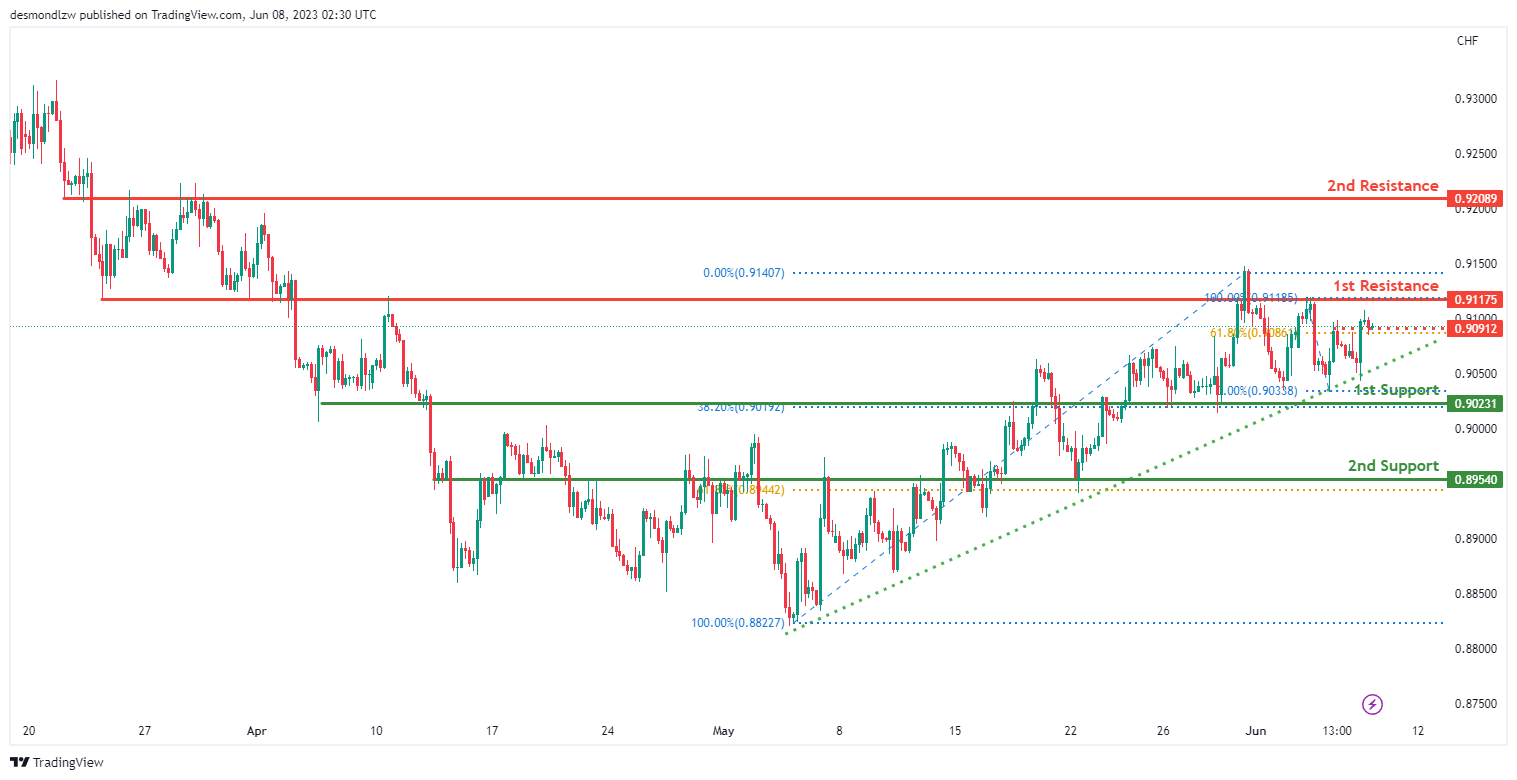
The USD/CHF chart demonstrates a bullish momentum, with the price above a major ascending trend line, suggesting the potential for further upward movement.
Considering this momentum, there is a possibility that the price could continue its bullish trend towards the first resistance level at 0.9117, which is identified as an overlap resistance.
Support levels include the first support at 0.9023 and the second support at 0.8954. The latter support level aligns with the 61.80% Fibonacci retracement, adding to its significance.
Furthermore, an intermediate resistance level at 0.9091 is recognized as a multi-swing high resistance, further reinforcing its importance.
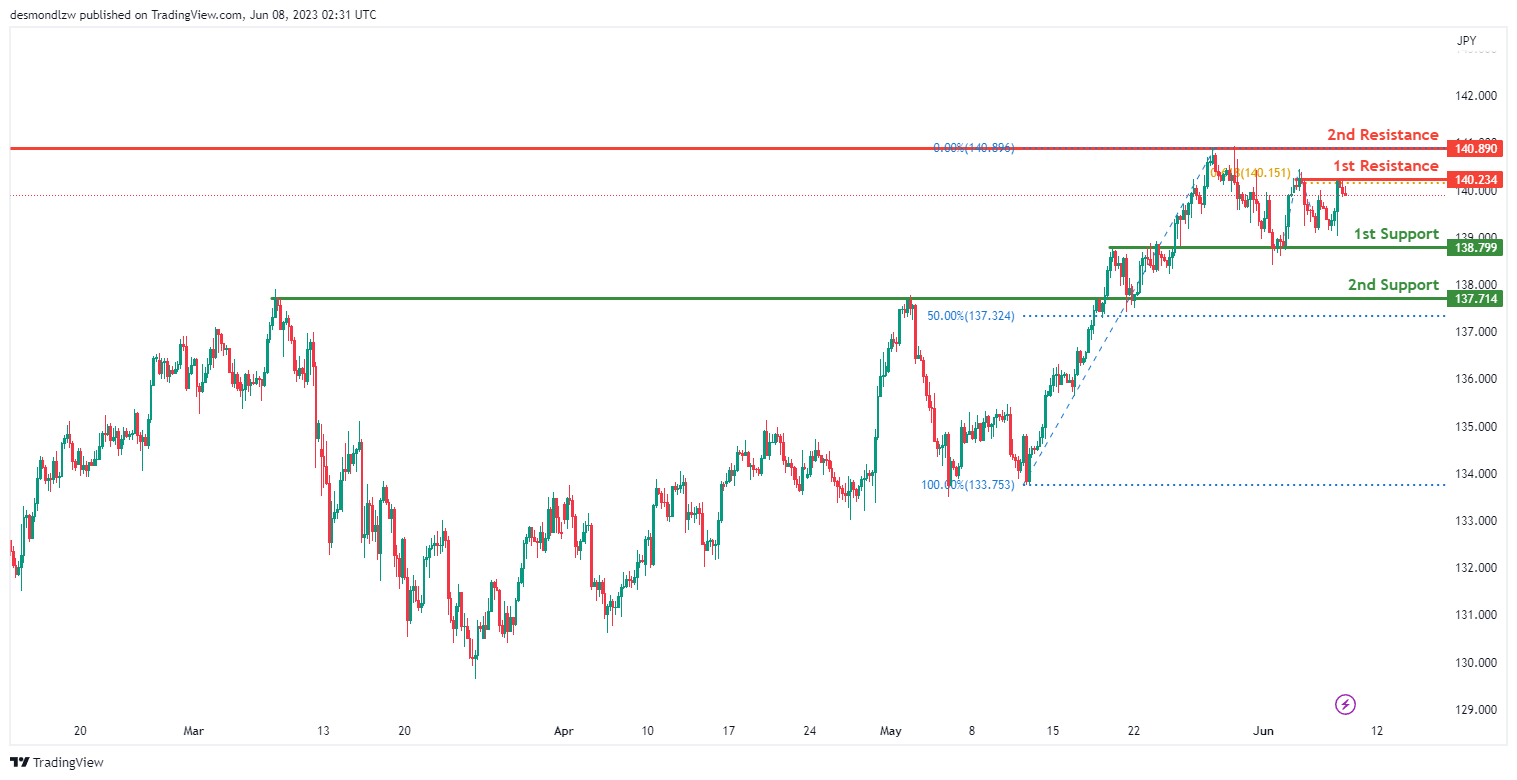
USD/JPY:
The USD/JPY chart currently indicates a neutral momentum, suggesting a lack of a clear trend in the market.
Given this neutral momentum, it is possible that the price could fluctuate within a range between the first support level at 138.79, which is an overlap support, and the first resistance level at 140.23. The resistance level is notable as a multi-swing high resistance and aligns with the 61.80% Fibonacci projection.
Additional support can be found at the second support level of 137.71, which coincides with the 50% Fibonacci retracement, potentially providing further price stability.
Furthermore, the second resistance level at 140.89 serves as a pullback resistance, potentially limiting upward price movements.
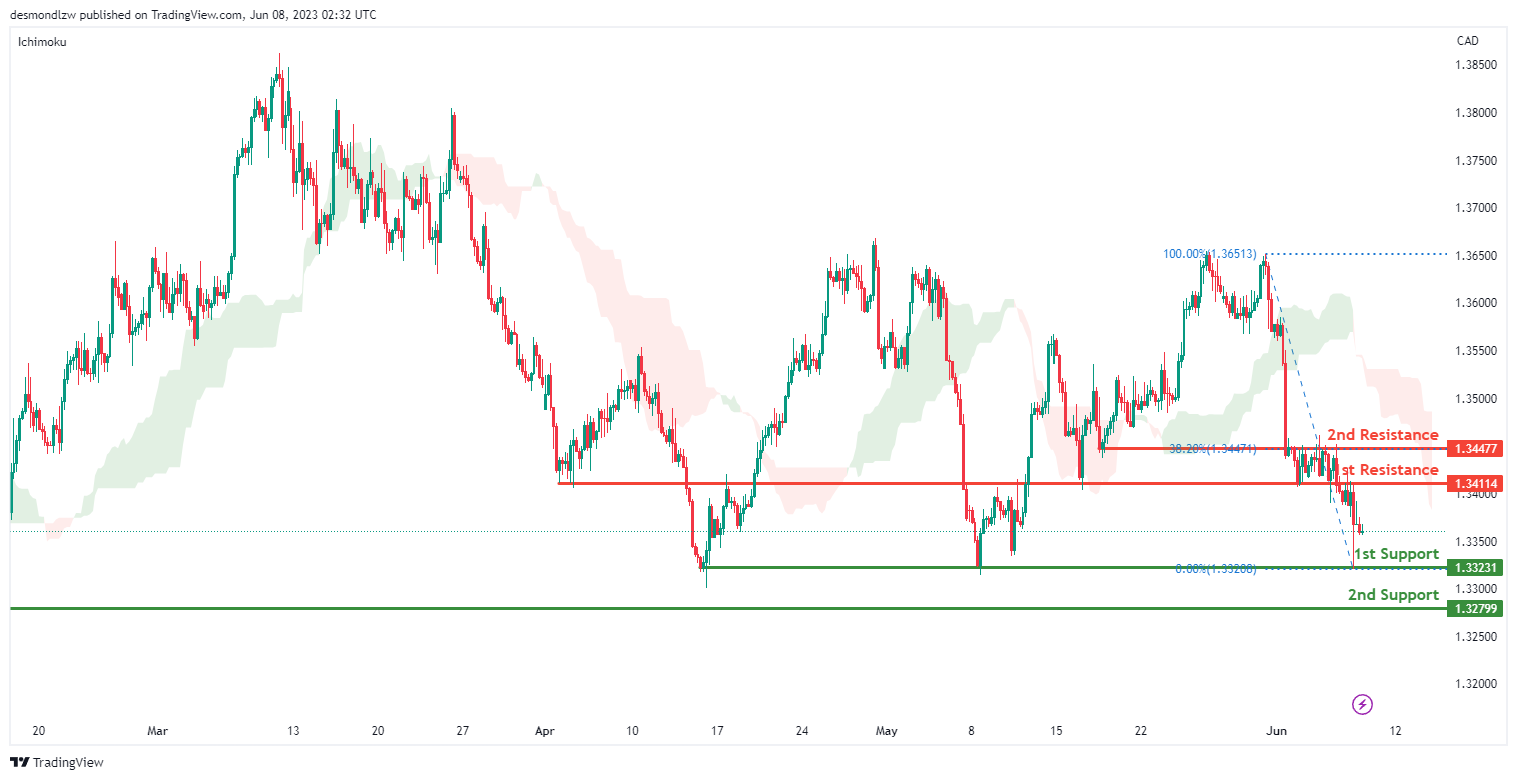
USD/CAD:
The USD/CAD chart currently demonstrates a bearish momentum, indicating a downward trend in the market.
Contributing to this bearish momentum is the fact that the price is below the bearish Ichimoku cloud, which suggests negative sentiment and potential for further downside movement.
In light of this bearish momentum, there is a possibility that the price could continue its downward trend towards the first support level at 1.3323. This level is recognized as a multi-swing low support, potentially attracting buyers to enter the market.
Furthermore, the second support level at 1.3279 also acts as a multi-swing low support, reinforcing its significance as a potential price level where buyers may provide support.
On the other hand, the first resistance level at 1.3411 is identified as an overlap resistance, potentially acting as a barrier to upward price movements.
Additionally, the second resistance level at 1.3447 is an overlap resistance and aligns with the 38.20% Fibonacci retracement level, further adding to its significance.
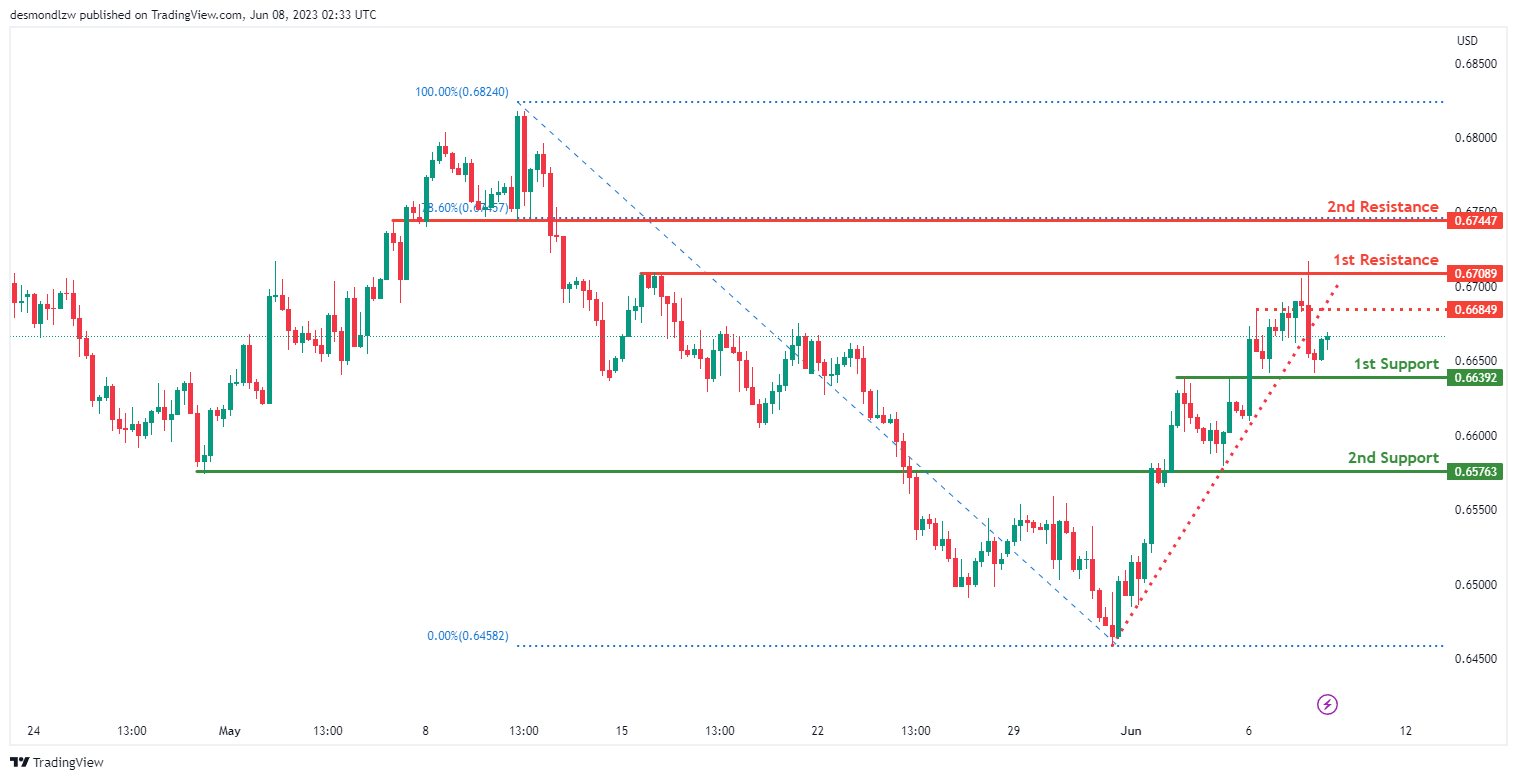
AUD/USD:
The AUD/USD chart currently exhibits a bearish momentum, indicating a downward trend in the market.
The momentum is driven by the price breaking below an ascending support line, triggering a potential bearish move.
In the short term, there is a possibility for the price to rise towards the first resistance level at 0.6708 before reversing off it and dropping towards the first support level at 0.6639.
The first support level at 0.6639 is identified as an overlap support, potentially providing a price level where buyers may enter the market.
Similarly, the second support level at 0.6576 also acts as an overlap support, further reinforcing its significance as a potential area where buyers could step in.
On the upside, the first resistance level at 0.6708 is recognized as a multi-swing high resistance.
Additionally, the second resistance level at 0.6744 serves as a pullback resistance and aligns with the 78.60% Fibonacci retracement level, adding to its importance.
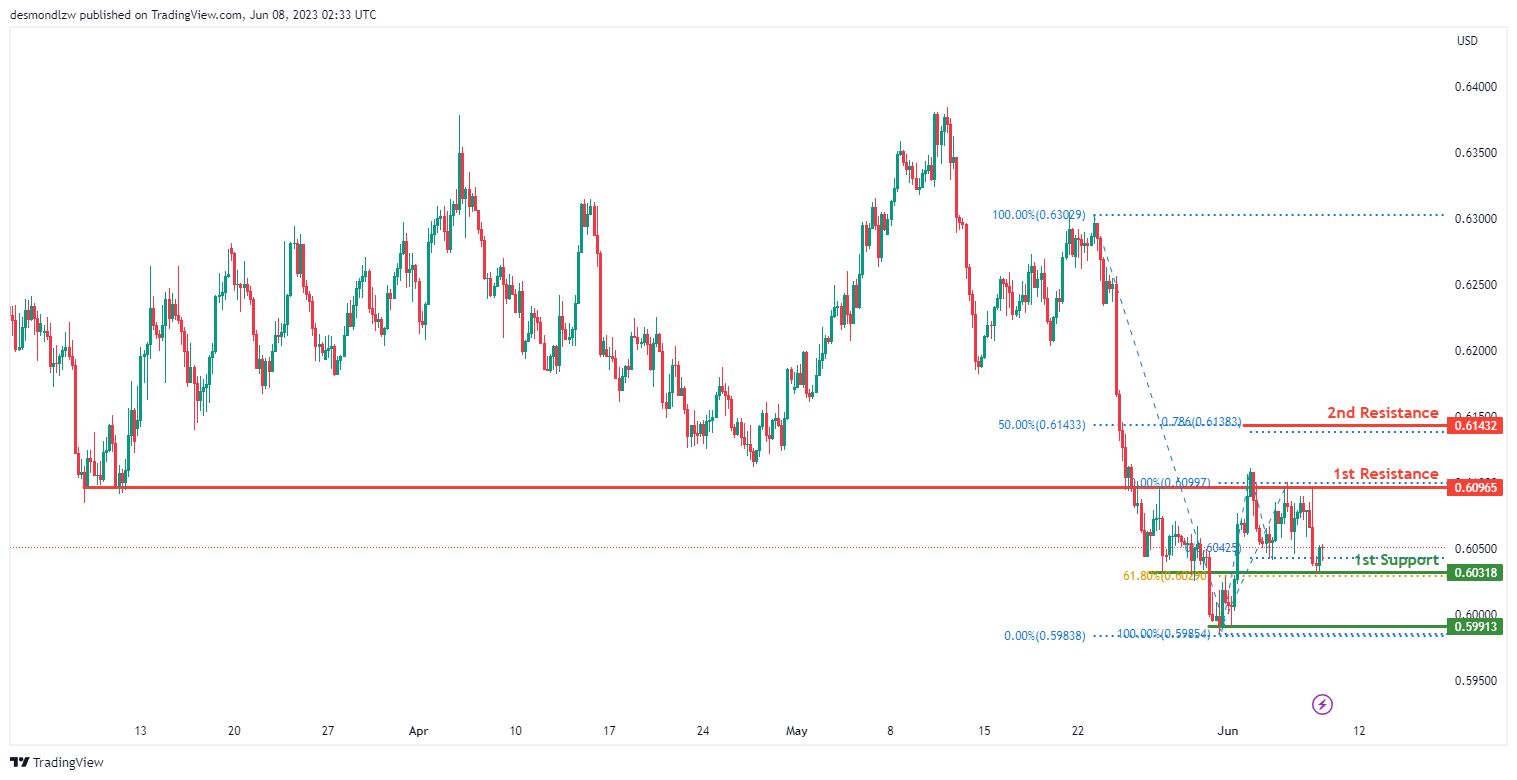
NZD/USD
The NZD/USD chart currently demonstrates bullish momentum, indicating an upward trend in the market.
There is a potential for the price to continue its bullish movement towards the first resistance level at 0.6096.
The first support level at 0.6031 is recognized as an overlap support and is reinforced by the 61.80% Fibonacci retracement level.
Furthermore, the second support level at 0.5991 serves as a multi-swing low support.
On the upside, the first resistance level at 0.6096 is identified as an overlap resistance.
Additionally, the second resistance level at 0.6143 represents a Fibonacci confluence, aligning with both the 50% Fibonacci retracement level and the 100% Fibonacci projection.
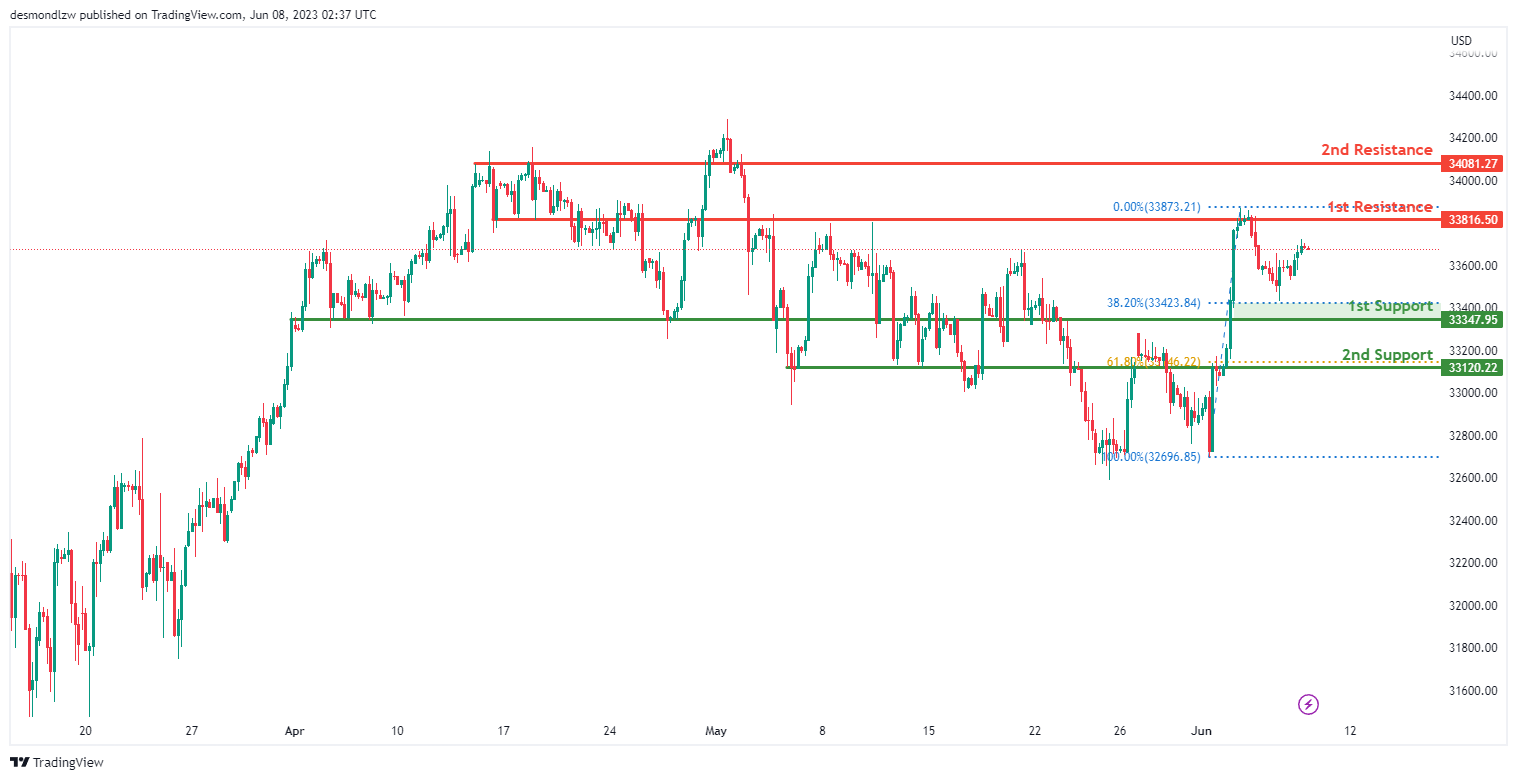
DJ30:
The DJ30 (Dow Jones Industrial Average) chart currently exhibits bullish momentum, indicating an upward trend in the market.
There is a possibility for the price to continue its bullish movement towards the first resistance level at 33816.50.
The first support level at 33347.95 is identified as an overlap support and aligns with the 38.20% Fibonacci retracement level, providing potential buying pressure.
Additionally, the second support level at 33120.22 is recognized as an overlap support and corresponds to the 61.80% Fibonacci retracement level, further reinforcing its significance as a potential price floor.
On the upside, the first resistance level at 33816.50 is identified as an overlap resistance.
Furthermore, the second resistance level at 34081.27 serves as a pullback resistance.
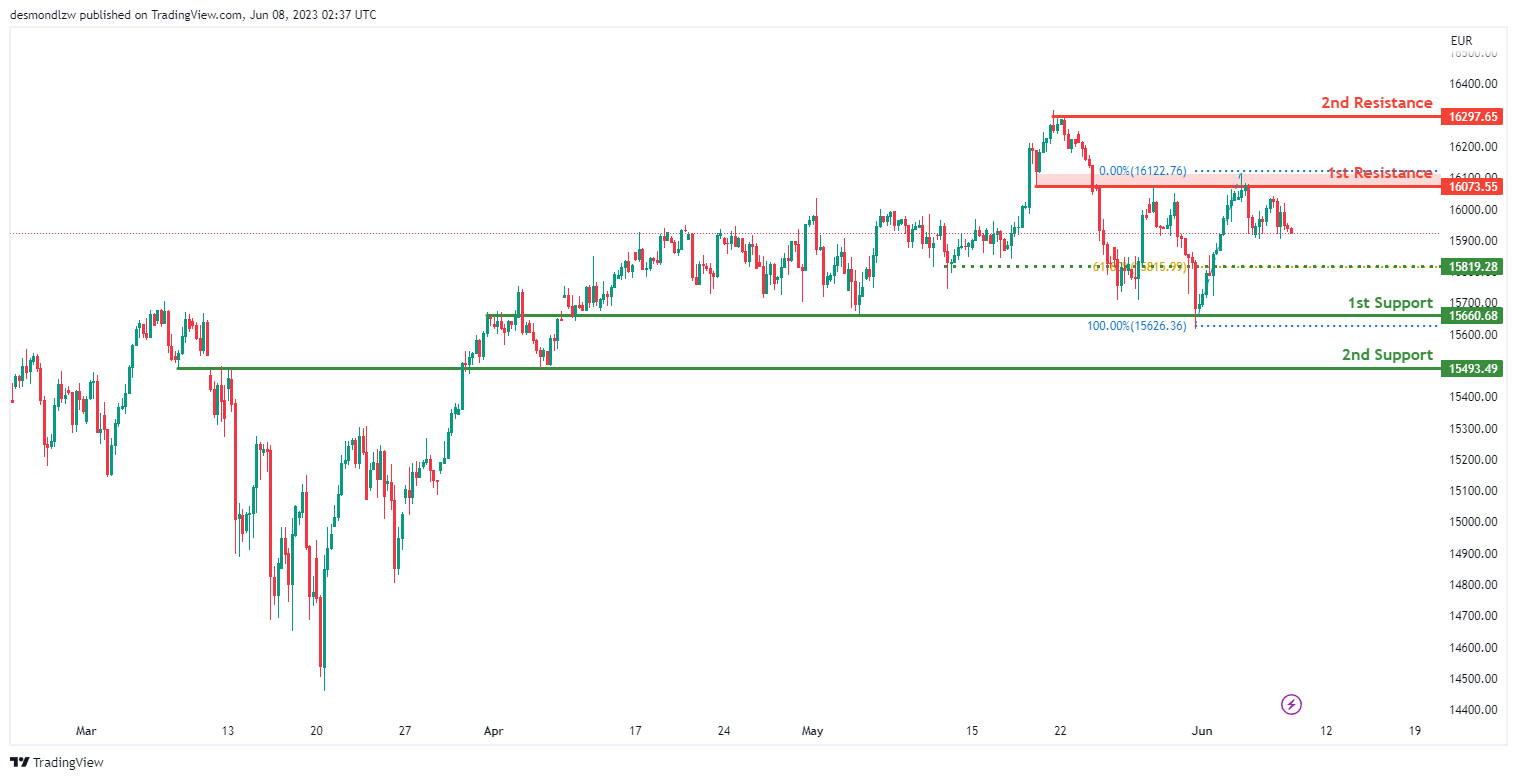
GER30:
The GER30 (DAX 30) chart currently demonstrates bearish momentum, indicating a downward trend in the market.
There is a potential for the price to continue its bearish movement towards the first support level at 15660.68.
The first support level at 15660.68 is identified as an overlap support, indicating a significant area where buyers may step in.
Additionally, the second support level at 15493.49 is recognized as an overlap support, further reinforcing its importance as a potential price floor.
On the upside, the first resistance level at 16023.55 is identified as an overlap resistance.
Furthermore, the second resistance level at 16297.65 serves as a multi-swing high resistance.
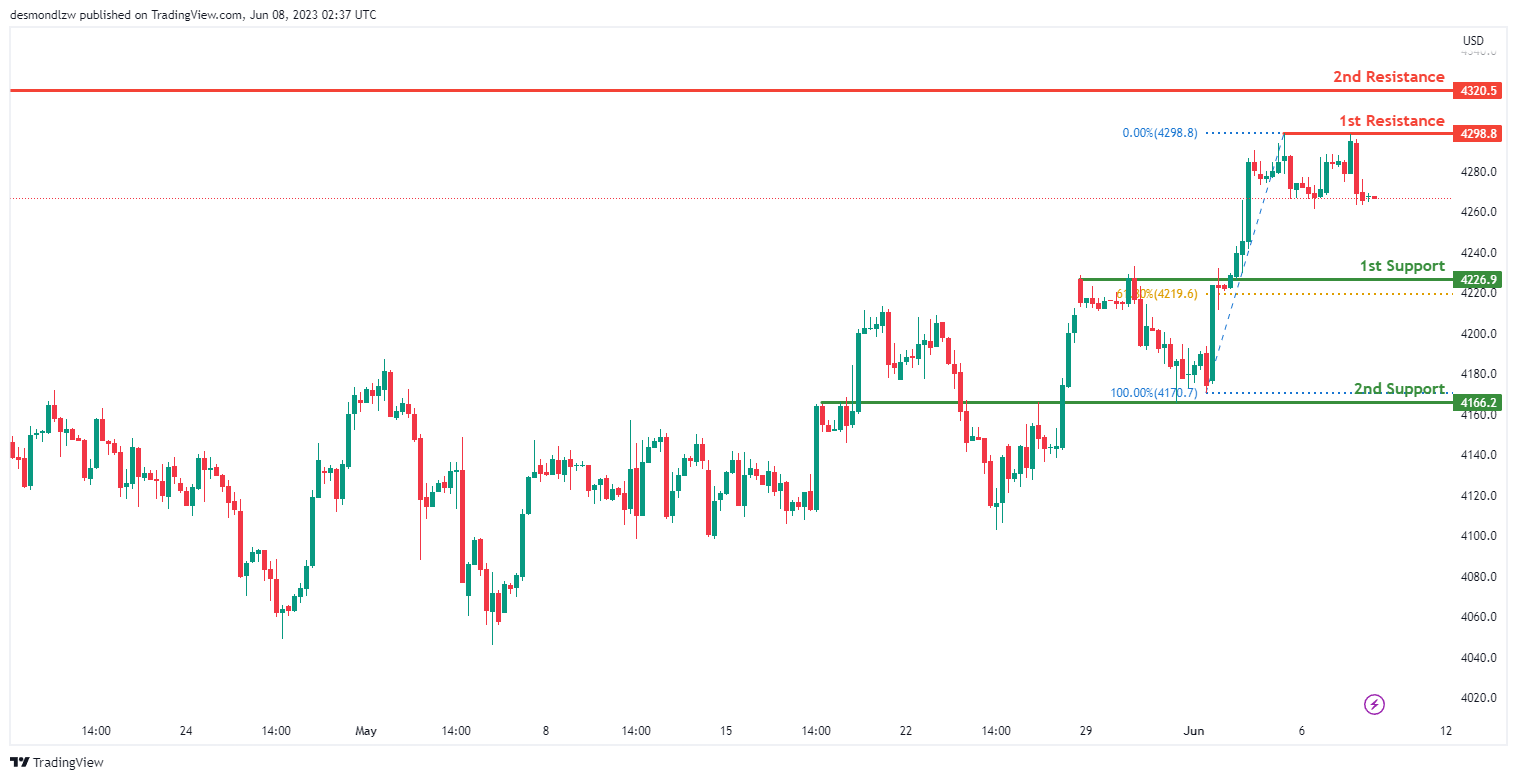
US500
The US500 (S&P 500) chart currently exhibits bearish momentum, indicating a downward trend in the market.
There is a potential for the price to continue its bearish movement towards the first support level at 4226.90. This level is identified as pullback support and aligns with the 61.80% Fibonacci retracement, adding to its significance.
Additionally, the second support level at 4166.20 is recognized as an overlap support, further reinforcing its importance as a potential price floor.
On the upside, the first resistance level at 4298.80 is identified as a multi-swing high resistance.
Furthermore, the second resistance level at 4320.50 serves as a swing high resistance.
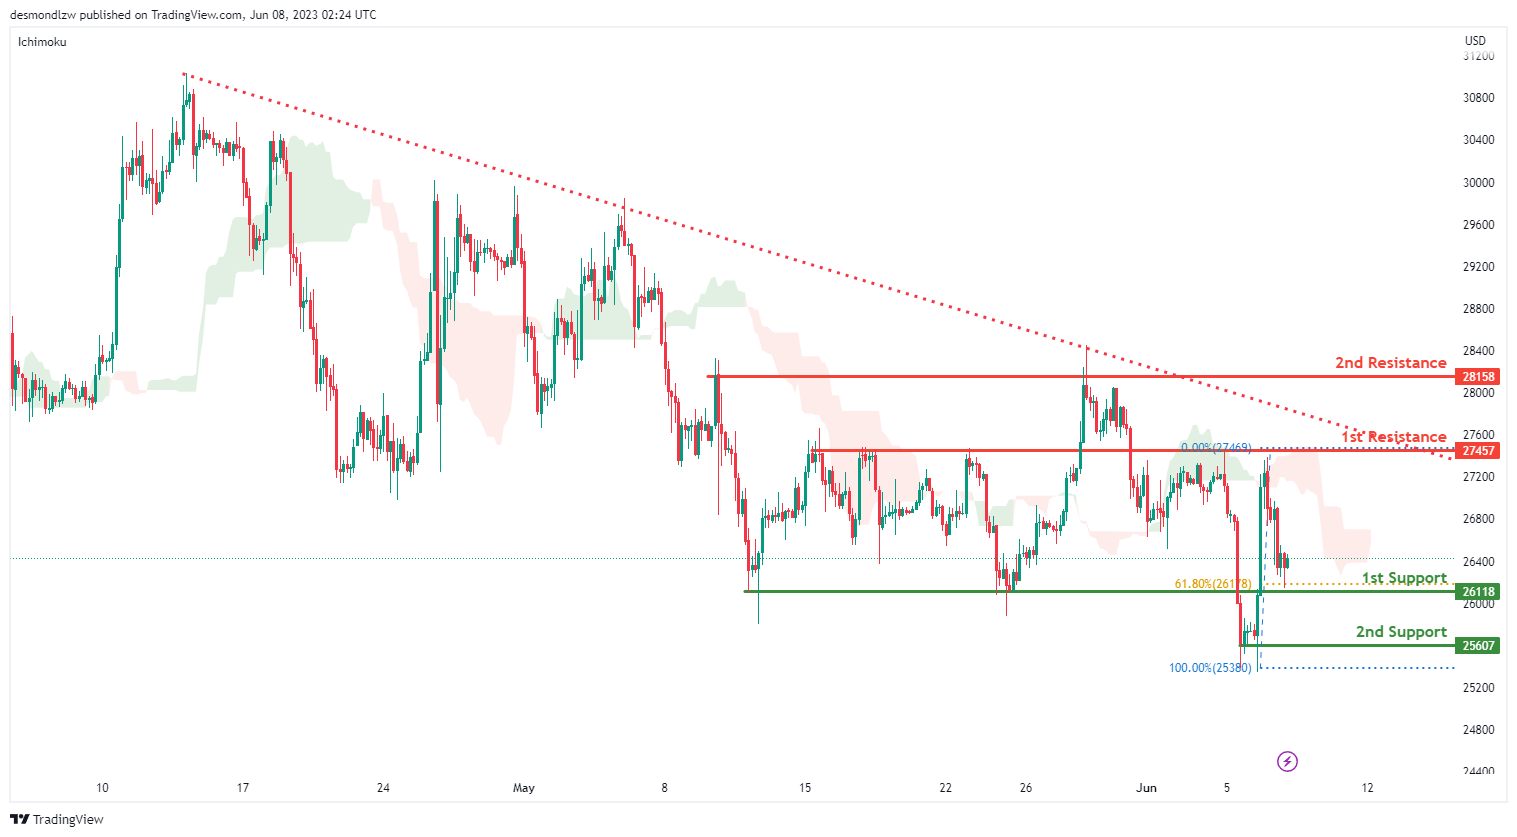
BTC/USD:
The BTC/USD (Bitcoin/US Dollar) chart currently demonstrates bearish momentum, suggesting a downward trend in the market.
There is a possibility for the price to experience a short-term rise towards the first resistance level at 27457 before reversing off it and dropping towards the first support level.
The first support level at 26118 is identified as an overlap support and aligns with the 61.80% Fibonacci retracement level, reinforcing its significance as a potential area where buyers may provide support.
Furthermore, the second support level at 25607 is recognized as a multi-swing low support, adding to its importance as a potential price level where buyers may step in.
On the upside, the first resistance level at 27457 is identified as an overlap resistance.
Additionally, the second resistance level at 28158 serves as a multi-swing high resistance.
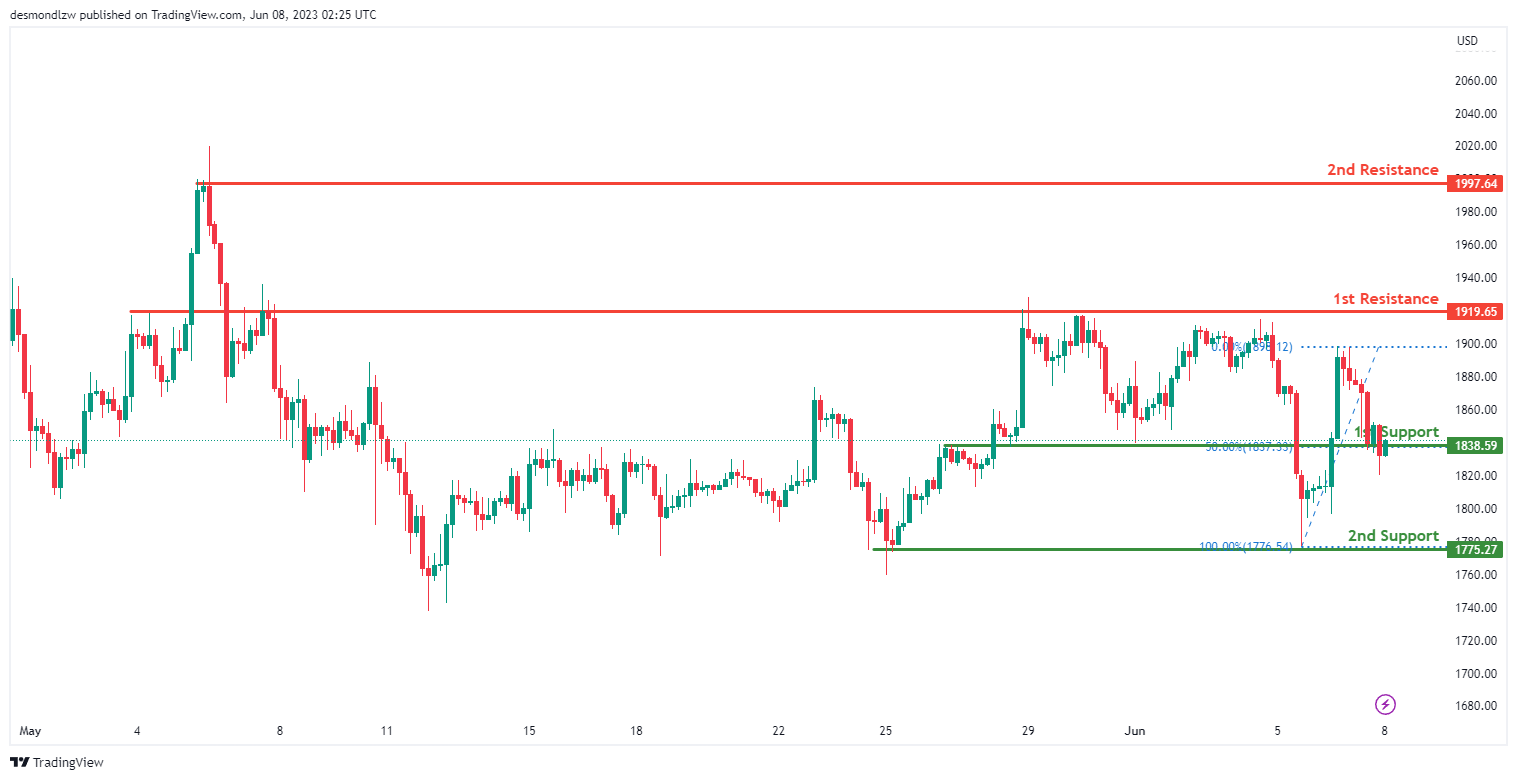
ETH/USD:
The ETH/USD (Ethereum/US Dollar) chart currently exhibits bullish momentum, indicating an upward trend in the market.
There is a potential for the price to experience a bullish bounce off the first support level at 1838.59 and head towards the first resistance level.
The first support level is identified as an overlap support and coincides with the 50% Fibonacci retracement level, strengthening its significance as a potential area where buyers may provide support.
Furthermore, the second support level at 1775.27 is recognized as a multi-swing low support, adding to its importance as a potential price level where buyers may step in.
On the upside, the first resistance level at 1919.65 is identified as an overlap resistance.
Additionally, the second resistance level at 1997.65 serves as a swing high resistance.
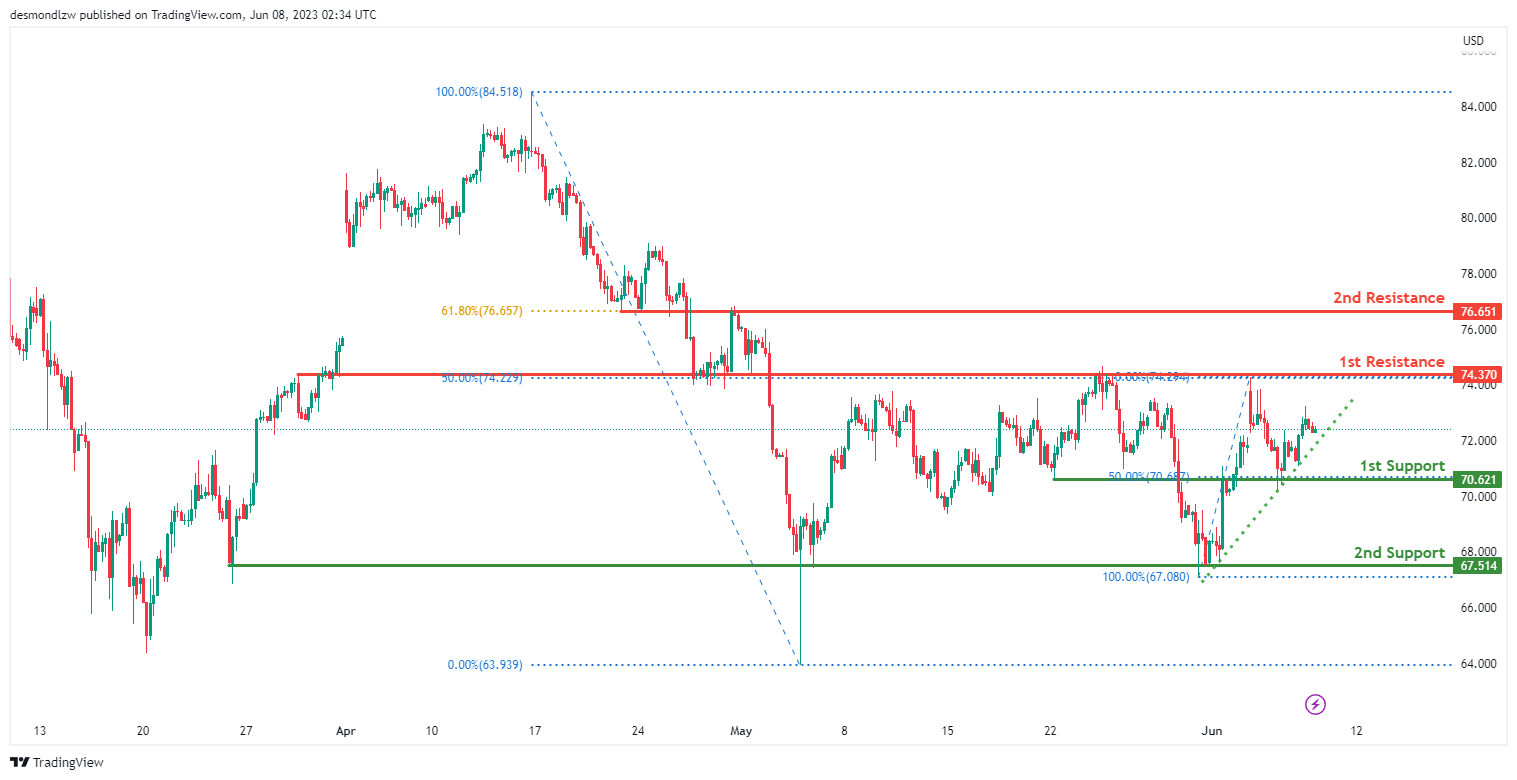
WTI/USD:
The WTI (West Texas Intermediate) chart currently demonstrates bullish momentum, indicating an upward trend in the market.
The price is above a major ascending trend line, suggesting further bullish momentum may be expected.
There is a potential for the price to experience a bullish bounce off the first support level at 70.62 and head towards the first resistance level.
The first support level is identified as an overlap support and aligns with the 50% Fibonacci retracement level, adding to its significance as a potential area where buyers may provide support.
Furthermore, the second support level at 67.51 is recognized as a multi-swing low support, reinforcing its importance as a level where buyers may step in.
On the upside, the first resistance level at 74.37 is identified as an overlap resistance.
Additionally, the second resistance level at 76.65 serves as an overlap resistance and coincides with the 61.80% Fibonacci retracement level, further enhancing its significance.
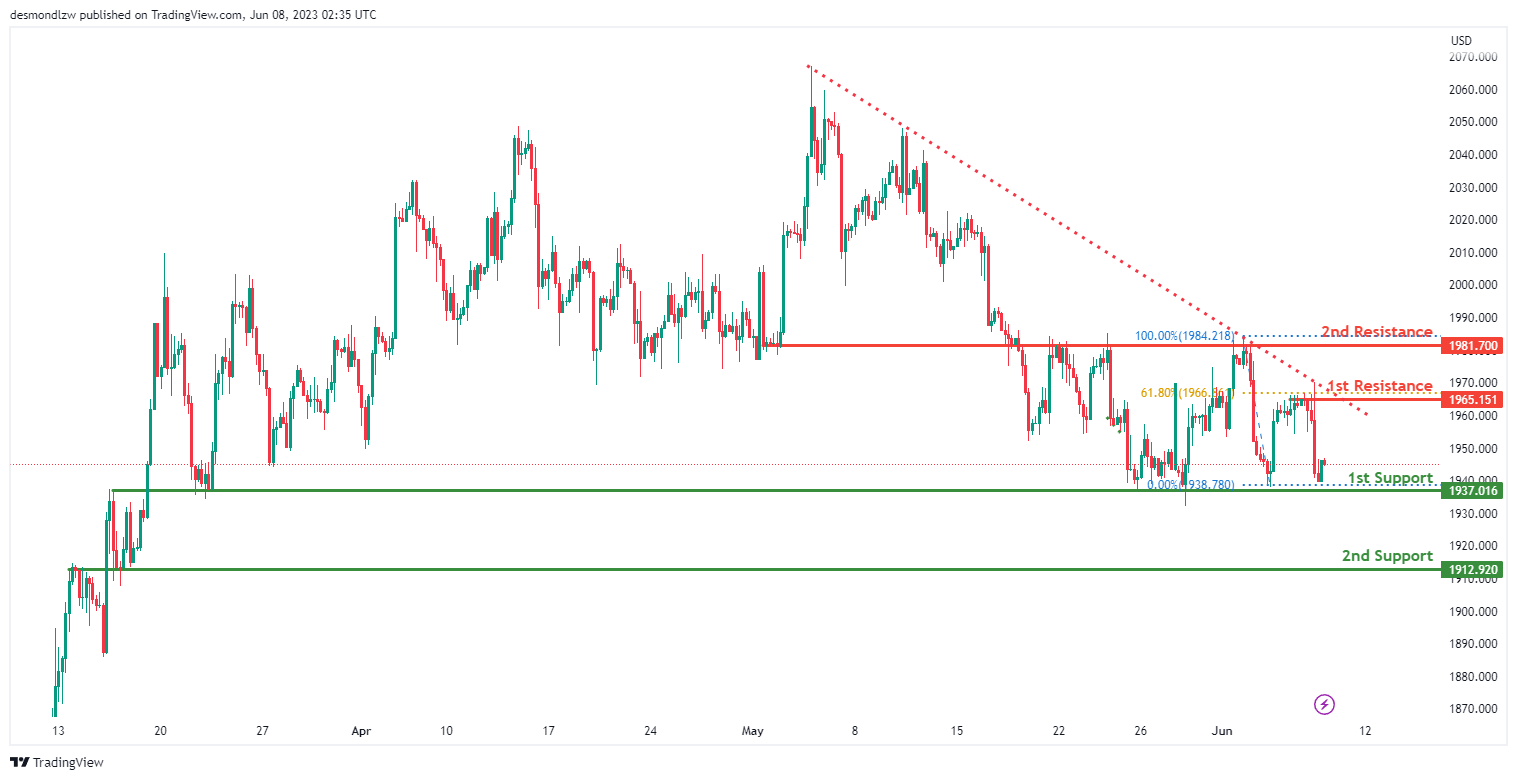
XAU/USD (GOLD):
The XAU/USD (Gold/US Dollar) chart currently shows bearish momentum, indicating a downward trend in the market.
The price is below a major descending trend line, suggesting the presence of bearish momentum.
There is a potential for the price to experience a temporary rise towards the first resistance level in the short term before reversing off it and dropping towards the first support level.
The first support level at 1937.01 is identified as an overlap support, potentially providing a level where buyers may step in.
Furthermore, the second support level at 1912.92 is recognized as an overlap support, further reinforcing its significance as a potential area of buying interest.
On the upside, the first resistance level at 1965.15 is identified as a multi-swing high resistance and aligns with the 61.80% Fibonacci retracement level.
Additionally, the second resistance level at 1981.70 is an overlap resistance.
The accuracy, completeness and timeliness of the information contained on this site cannot be guaranteed. IC Markets does not warranty, guarantee or make any representations, or assume any liability regarding financial results based on the use of the information in the site.
News, views, opinions, recommendations and other information obtained from sources outside of www.icmarkets.com, used in this site are believed to be reliable, but we cannot guarantee their accuracy or completeness. All such information is subject to change at any time without notice. IC Markets assumes no responsibility for the content of any linked site.
The fact that such links may exist does not indicate approval or endorsement of any material contained on any linked site. IC Markets is not liable for any harm caused by the transmission, through accessing the services or information on this site, of a computer virus, or other computer code or programming device that might be used to access, delete, damage, disable, disrupt or otherwise impede in any manner, the operation of the site or of any user’s software, hardware, data or property.


