
EUR/USD:
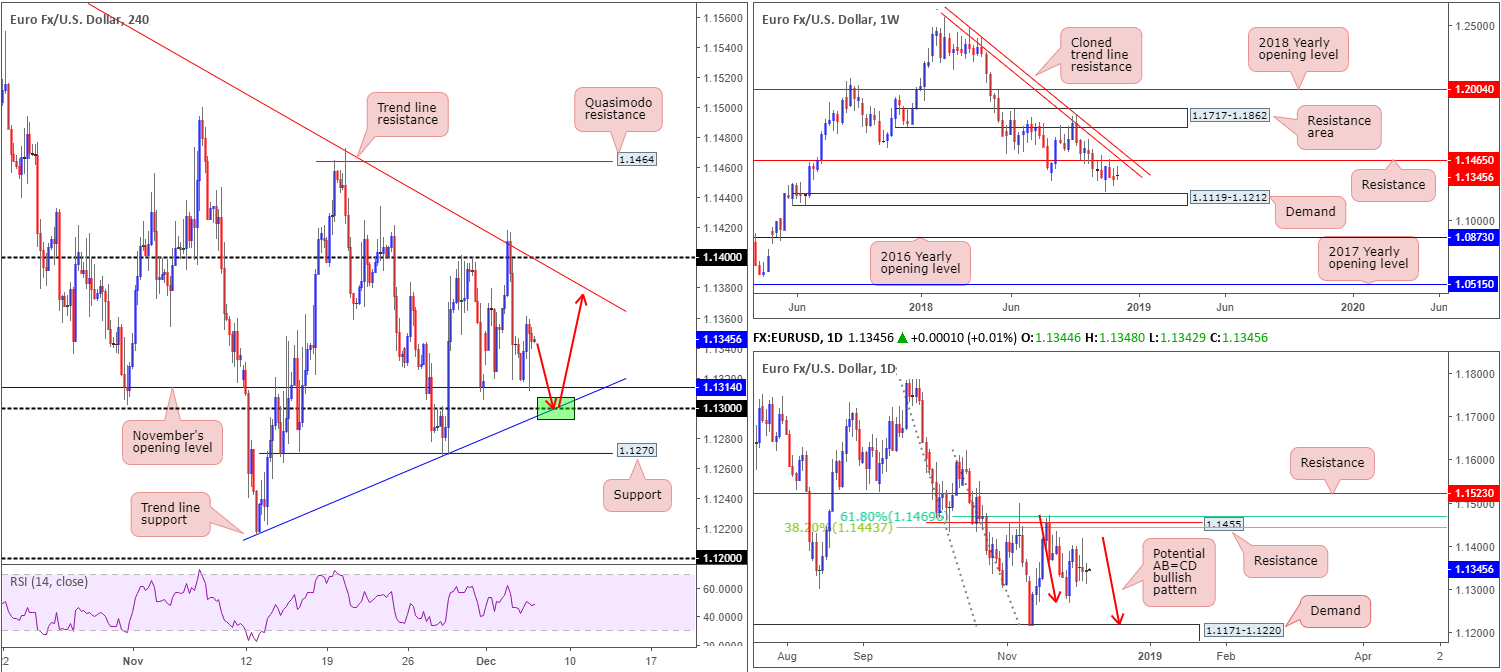
Since the week’s open the shared currency has struggled to establish firm direction, consequently chalking up three consecutive daily indecision candles.
With respect to the higher timeframes, there’s been little change as far as structure is concerned. Weekly movement continues to meander between resistance priced in at 1.1465 (brings with it a nearby cloned trend line resistance [extended from the high 1.2413]), and demand coming in at 1.1119-1.1212. However, it is worth pointing out the current weekly candle boasts a somewhat prominent selling wick, possibly indicating a bearish stance.
Closer attention to daily structure adds the possibility of an AB=CD bullish pattern (red arrows) developing in the near future, terminating around the top edge of a demand drawn from 1.1171-1.1220 (glued to the top edge of the aforementioned weekly demand). If it follows the pair turns northbound prior to completing the harmonic formation, however, traders are urged to pencil in resistance at 1.1455 that merges closely with two Fibonacci resistances: a 61.8% and a 38.2% at 1.1469 and 1.1443, respectively.
In terms of where we stand on the H4 timeframe, November’s opening level at 1.1314 was tested as support in recent hours, though has failed to generate much follow-through movement. This shines the spotlight on 1.13 and a trend line support (etched from the low 1.1215). As a reminder, 1.13 (green) remains an area of interest for possible longs in this market.
Areas of consideration:
1.13 is likely on the radar for many traders today for a bounce higher. Why only a bounce is largely due to the lack of higher-timeframe convergence.
Conservative traders out of 113 are likely to opt to wait for additional confirmation by way of a candlestick signal. That way, traders are able to observe buyer/seller intent and also have defined levels for entry and stop-loss orders. As for take-profit targets, ultimately, we would be looking for a bounce off 1.13 to at least reach the nearby H4 trend line resistance (taken from the high 1.1621).
Today’s data points: US ADP Non-Farm Employment Change; US ISM Non-Manufacturing PMI; FOMC Member Bostic Speaks.
GBP/USD:
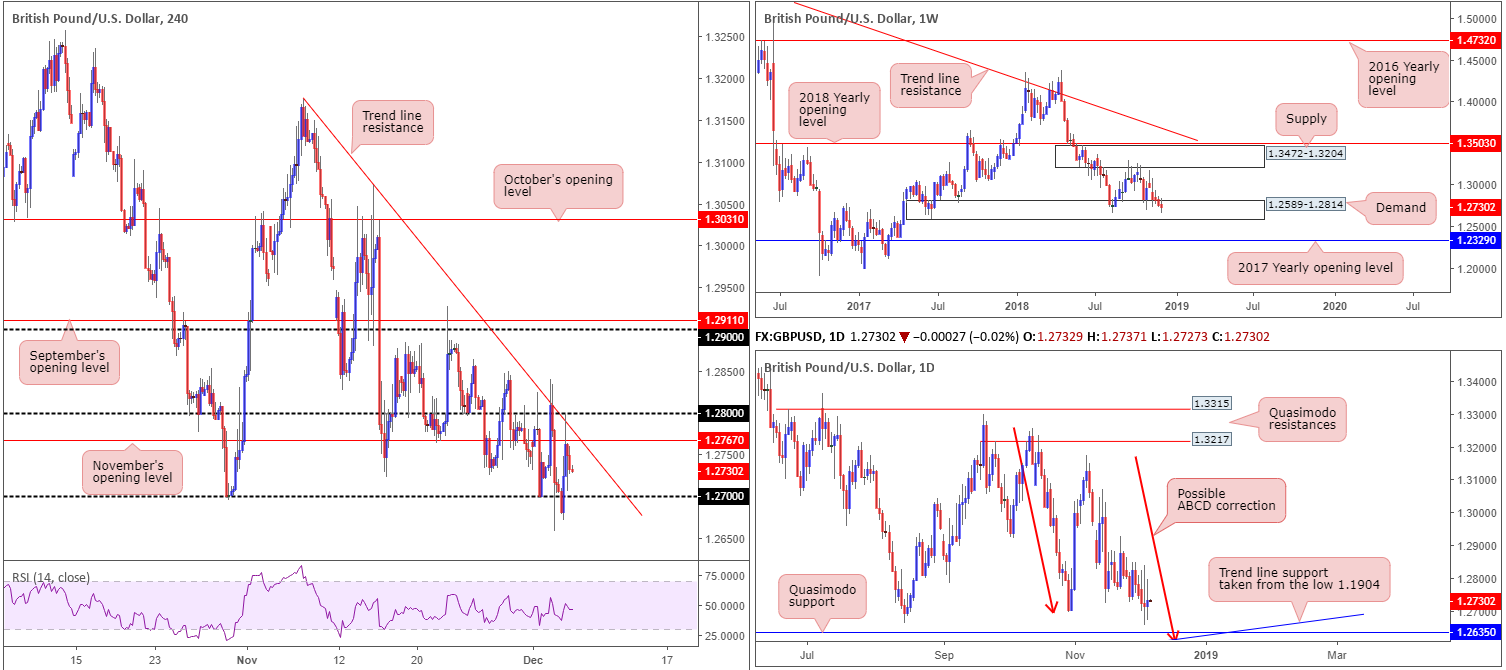
The British pound, despite another attempt to overthrow 1.27 in early Asia, advanced to highs of 1.2798 vs. its US counterpart Wednesday, largely shrugging off a dire UK services PMI reading in the process. The pair, however, met strong sellers just south of 1.28 mid-way through London, which happens to merge closely with a H4 trend line resistance (taken from the high 1.3174) and also November’s opening level at 1.2767.
As of current price (1.2730), another test of 1.27 on the H4 scale is certainly a possibility today. And with stop-loss orders from traders looking to fade 1.27 likely tripped as a result of recent movement, a break of this number to the downside is probable. Should the market rally higher and take out 1.28, on the other hand, the path north is reasonably clear towards 1.29, given the lack of active supply to the left of current price.
Beneath 1.27 we do not see a whole lot stopping the pair from pressing as far south as a daily Quasimodo support at 1.2635. Aside from 1.2635 fusing with trend line support (taken from the low 1.1904), the approach, should we push for lower levels, will form by way of an ABCD bullish pattern (red arrows) terminating just south at 1.2614. Although we feel a break of 1.27 is a likely move, traders may also want to take note the weekly candles remain loitering within demand at 1.2589-1.2814, though as of yet price has failed to produce anything meaningful to the upside from here.
Areas of consideration:
On account of the above analysis, there are two possible scenarios in the offing:
- A H4 close above 1.28. This – coupled with a retest as support in the shape of a bullish candlestick formation (entry/stop parameters can be defined according to this pattern) – is likely enough evidence to condone a long towards 1.29.
- A H4 close beneath 1.27 may lead to a move south towards the daily Quasimodo support mentioned above at 1.2635. A retest to the underside of 1.27 by means of a bearish candlestick configuration (entry/stop parameters can be defined according to this pattern) would likely justify a sell.
The two scenarios are based on a conservative approach. Aggressive traders may wish to enter on the close, rather than waiting for a pullback/retest play that may or may not happen.
Today’s data points: MPC Member Ramsden Speaks; US ADP Non-Farm Employment Change; US ISM Non-Manufacturing PMI; FOMC Member Bostic Speaks.
AUD/USD:
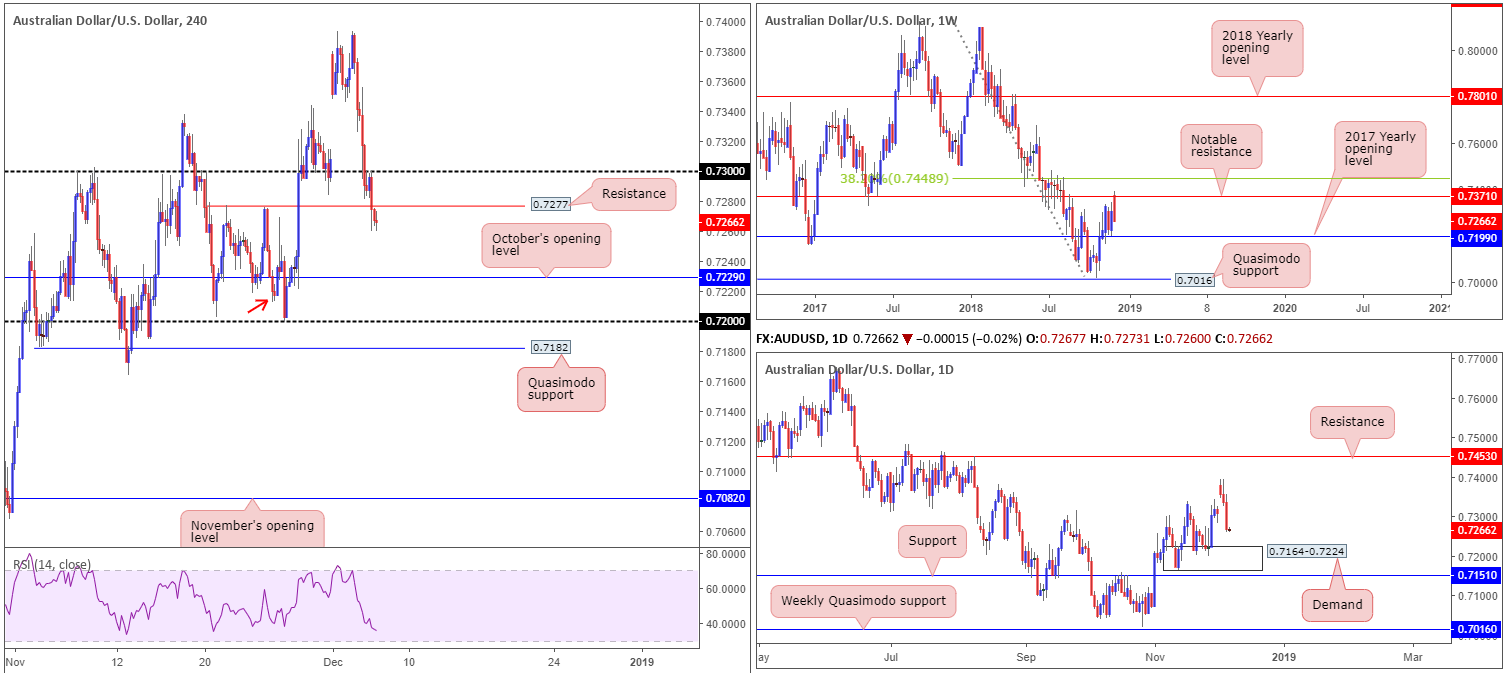
Since the beginning of the week, demand for the Australian dollar has been almost nonexistent. Wednesday witnessed a decline of nearly 1% against its US peer, undermined by a considerable miss on Q3 growth and persistent weakness in US equity markets.
0.73, as you can see, was consumed early Asia on the H4 timeframe and used as resistance amid London/US trade to eventually wash through orders at a nearby support drawn from 0.7277 (now acting resistance). According to the H4 structure, further selling could still be upon us. Limited support is visible until reaching October’s opening level at 0.7229, followed closely by 0.72. There is also Quasimodo support seen marked with a red arrow at 0.7212, though given how close it is sited to 0.72 it will likely suffer a fakeout.
Aside from a reasonably healthy US dollar, the fact weekly price is seen fading notable resistance at 0.7371 is likely to continue contributing to downside pressure – even more so knowing the next support target on this scale does not enter the fold until the 2017 yearly opening level at 0.7199. In conjunction with weekly movement, daily flow is seen poised to continue pressing in the direction of demand priced in at 0.7164-0.7224 (houses the 2017 yearly opening level at 0.7199 and is positioned just beneath October’s opening level at 0.7229 on the H4).
Areas of consideration:
All three timeframes suggest the sellers still remain in the driving seat, with October’s opening level mentioned above on the H4 timeframe at 0.7229 as the next overall downside target. With that being the case, a sell on the retest of either the H4 resistance at 0.7277 or the 0.73 handle is an option today.
Although there’s overall agreement on direction, the research team recommends waiting for additional candlestick confirmation to form prior to pulling the trigger. Not only will this help define entry/stop-loss parameters, it’ll help highlight which of the two levels are likely to hold, if any.
Today’s data points: US ADP Non-Farm Employment Change; US ISM Non-Manufacturing PMI; FOMC Member Bostic Speaks.
USD/JPY:
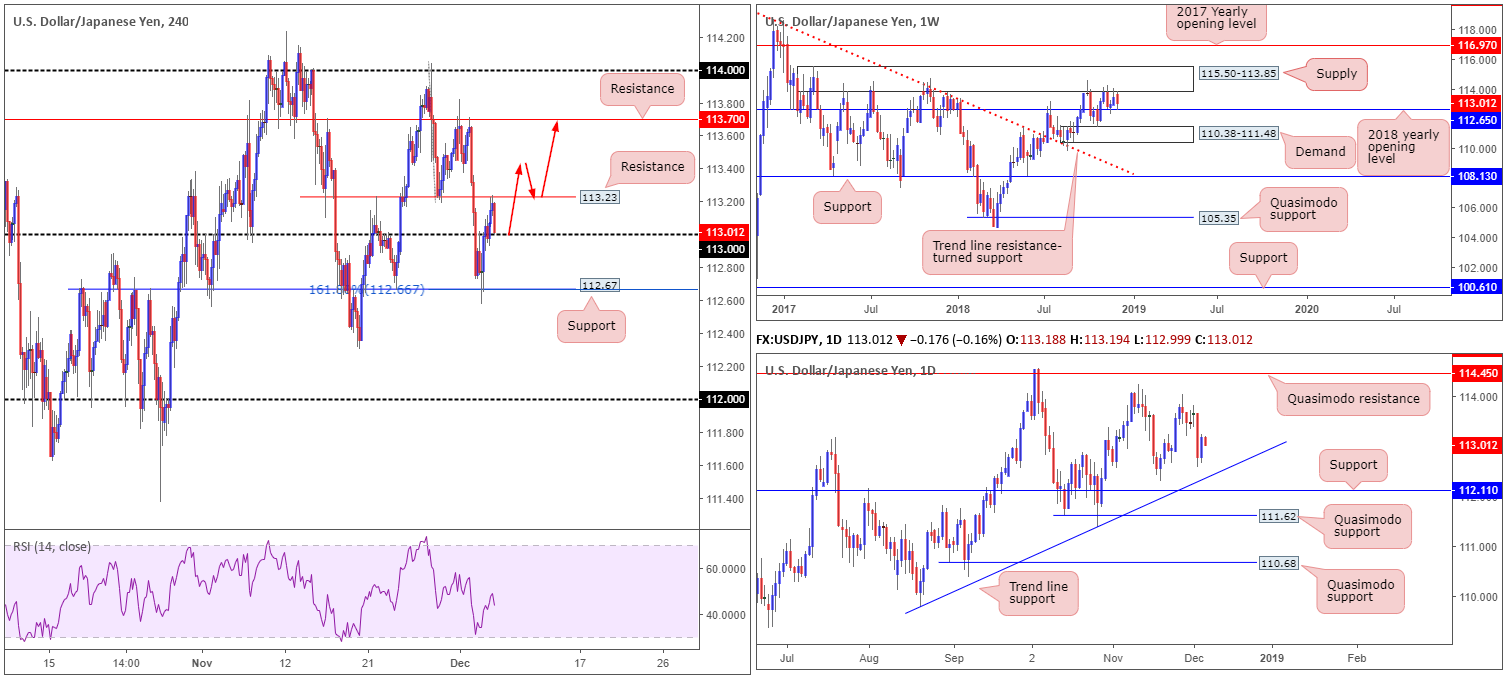
Following a near-100-pip decline Tuesday, Wednesday observed a modest recovery play off H4 support at 112.67/161.8% H4 Fibonacci extension point at 112.66. The move, which reclaimed around 50% of Tuesday’s selloff, regained 113 to the upside and tested nearby H4 resistance coming in at 113.23. Yesterday’s advance should not come as much of a surprise. The H4 supports merged with the 2018 yearly opening level on the weekly timeframe at 112.65.
The 113 handle on the H4 timeframe is, as we write, being retested as support. Further upside from this number, knowing we’re coming from weekly support, is a strong possibility. The only grumble, of course, is daily flow indicates a move south could be on the cards until the major tests trend line support (taken from the low 109.77).
Areas of consideration:
In the event H4 price turns north from 113 today and defeats resistance seen nearby at 113.23, a potential long opportunity could be something to consider. As per the red arrows, a retest of 113.23 as support (preferably by way of a bullish candlestick pattern as it’ll help define entry/stop levels) opens the door to a buy, targeting H4 resistance at 113.70, sited just south of weekly supply at 115.50-113.85 (the next upside target on the weekly scale).
Today’s data points: US ADP Non-Farm Employment Change; US ISM Non-Manufacturing PMI; FOMC Member Bostic Speaks.
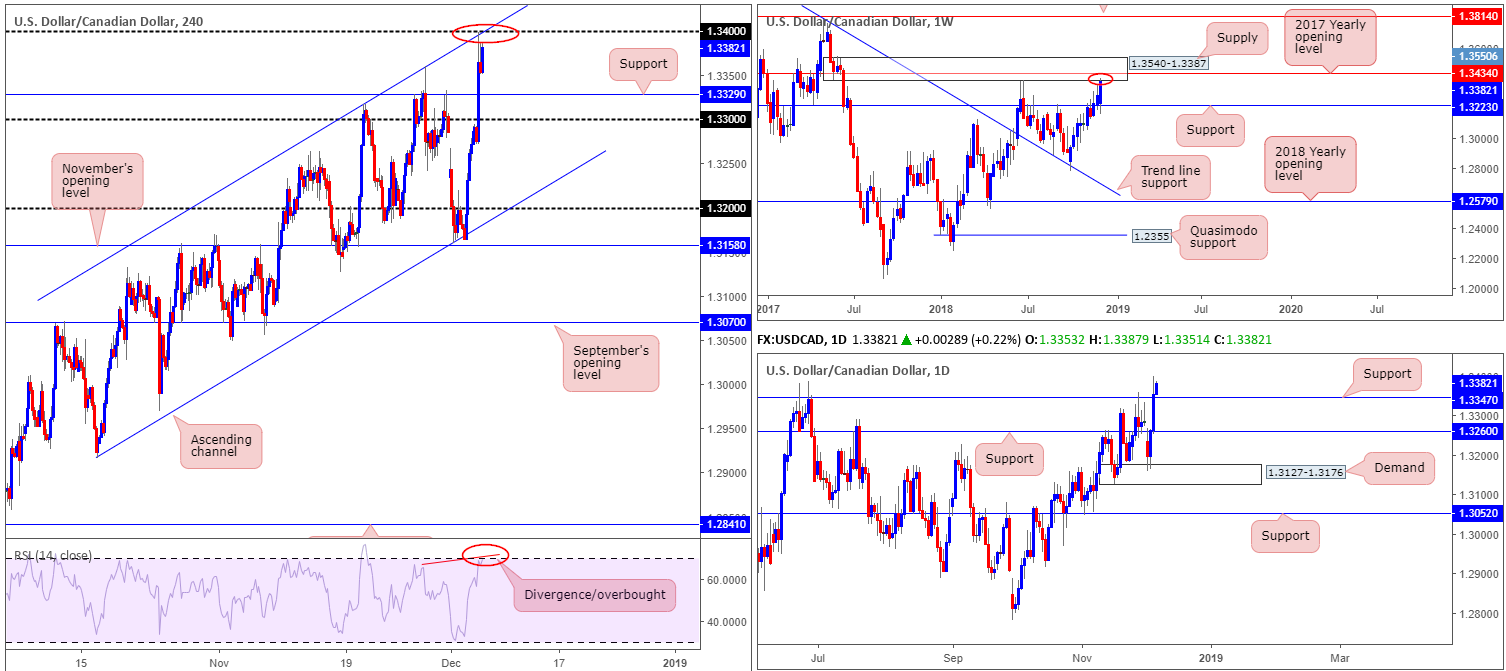
USD/CAD:
The Bank of Canada held rates at 1.75% Wednesday, as widely expected. The central bank stated rates will have to increase to a neutral range in order to achieve its inflation target, noting downward historical revisions to GDP and recent macro developments indicate there may be more room for non-inflationary growth. The impact witnessed the USD/CAD market print a sharp increase in value, ripping through orders at 1.33 and H4 resistance at 1.3329 (now acting support), leaving price free to challenge 1.34/H4 channel resistance (extended from the high 1.3317).
The combination of the round number 1.34, H4 channel resistance and the RSI indicator displaying a divergence/oversold reading is likely appealing for sellers. It becomes even more tempting as traders realize 1.34 fuses nicely with the lower edge of weekly supply coming in at 1.3540-1.3387. The only drawback we see from here, aside from the US dollar index recently conquering 97.00 to the upside, is the fact daily price shows potential to explore ground as far north as resistance drawn from 1.3533.
Areas of consideration:
Keep a close eye on 1.34 today for possible shorting opportunities. The research team has recommended waiting for additional candlestick confirmation prior to pulling the trigger simply due to the strength of the US dollar at the moment and the fact daily price displays room to explore higher ground. A bearish candlestick formation printed from 1.34 helps traders define entry/stop-loss parameters and also helps recognize whether or not there are sellers committed to the area.
Downside targets from 1.34 rest at daily support taken from 1.3347, followed by H4 support at 1.3329.
Today’s data points: US ADP Non-Farm Employment Change; US ISM Non-Manufacturing PMI; FOMC Member Bostic Speaks; Canadian Trade Balance; BoC Gov Poloz Speaks.
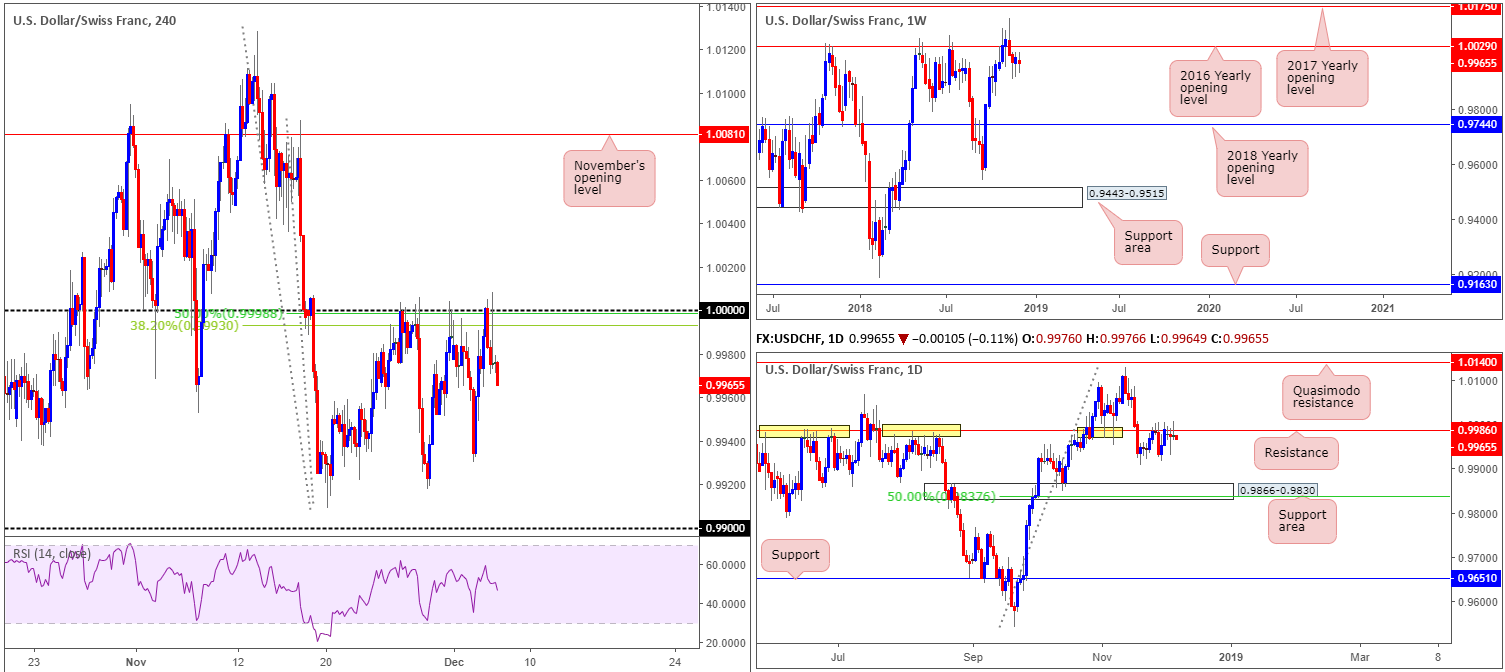
USD/CHF:
For folks who read Wednesday’s briefing you may recall the team shining the limelight on 1.0000 (parity) as a potential sell zone. Although a key figure by and of itself, it is worth noting the number is surrounded by a 38.2% H4 Fibonacci resistance value at 0.9993, along with a 50.0% H4 resistance value at 0.9999. As is evident from the H4 chart, 1.0000 has so far held as resistance and is currently testing 0.9960/70 levels. There was a H4 bearish engulfing formation printed from 1.0000 yesterday, though depending on where one sited stop-loss orders, the spike to highs of 1.0008 amid early US trade may have tripped stops. Well done to anyone who managed to survive this move and remains short.
What else really attracted us to 1.0000 was the fact daily resistance is in play at 0.9986. The level, as you can see (yellow), boasts incredibly strong historical significance, and, therefore, has a chance of holding ground. Downside from this angle, apart from local support around 0.9920ish, seems reasonably free until a support area seen at 0.9866-0.9830 enters the fold.
As highlighted in Wednesday’s report, the only drawback to a sustained selloff printing from 1.0000 is the weekly timeframe showing room to potentially advance as far north as resistance plotted nearby at 1.0029 in the shape of the 2016 yearly opening level.
Areas of consideration:
Should sellers continue to hold ground, the 0.99 handle is a logical downside target, according to our technical studies. This is due to the lack of active demand present on the H4 chart. Each area has already been tested/potentially consumed.
Today’s data points: US ADP Non-Farm Employment Change; US ISM Non-Manufacturing PMI; FOMC Member Bostic Speaks.
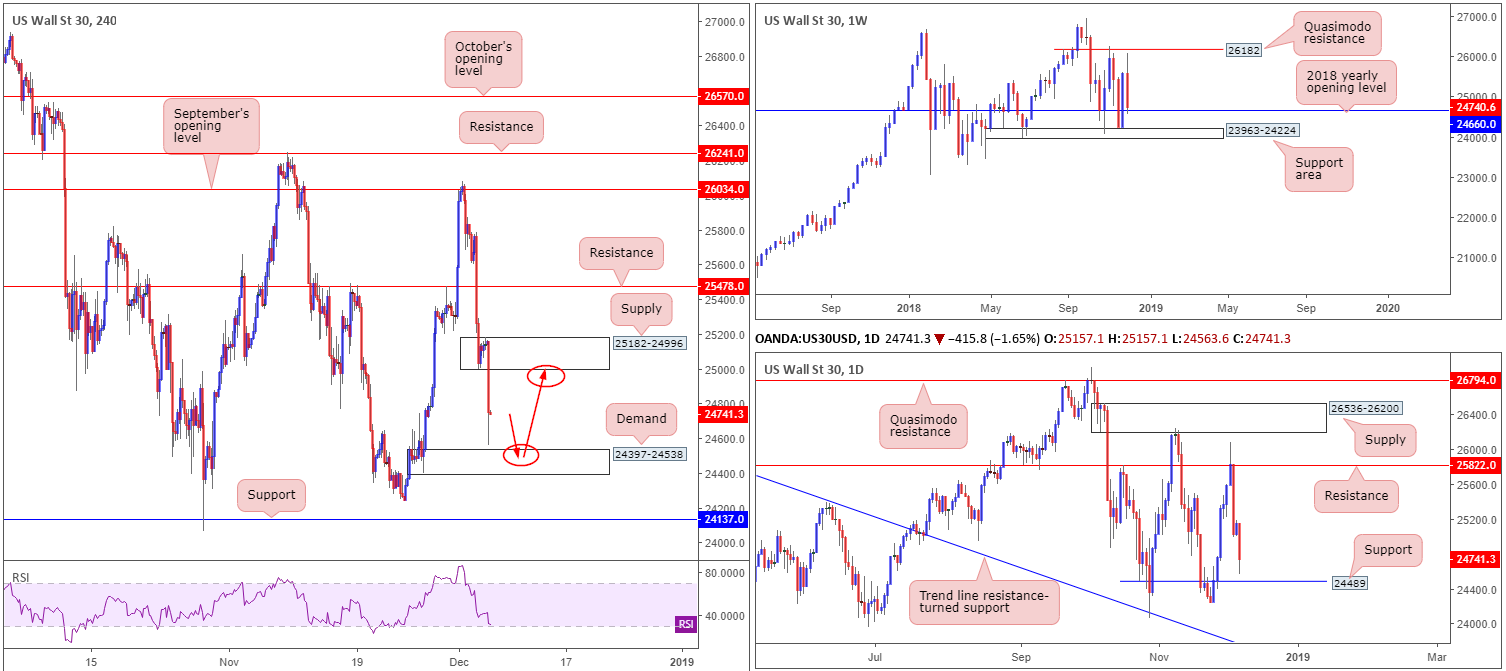
Dow Jones Industrial Average:
In recent hours, the Dow Jones Industrial Average fell sharply, down 1.64% at the time of writing. As a result of this, H4 price is now trading just north of a notable demand zone coming in at 24397-24538, along with the RSI indicator seen fast approaching oversold territory. Why this demand is noteworthy comes down to the following:
- The demand itself emphasizes a strong tone given how buyers strongly drove price higher from its base.
- The area houses a daily support level drawn from 24489. This is a support due to it being an ignored Quasimodo support and, therefore, likely holds unfilled buy orders.
- Positioned just beneath the 2018 yearly opening level at 24660 on the weekly timeframe.
Areas of consideration:
With the above points in mind, the H4 demand plotted at 24397-24538 remains of interest for longs today. Entry around the top edge of this zone is favourable, with stop-loss orders planted a couple of points beneath its lower edge. As for an initial take-profit target, the first port of call now rests around H4 supply at 25182-24996, offering at least a 1:2 risk/reward trade.
Today’s data points: US ADP Non-Farm Employment Change; US ISM Non-Manufacturing PMI; FOMC Member Bostic Speaks.
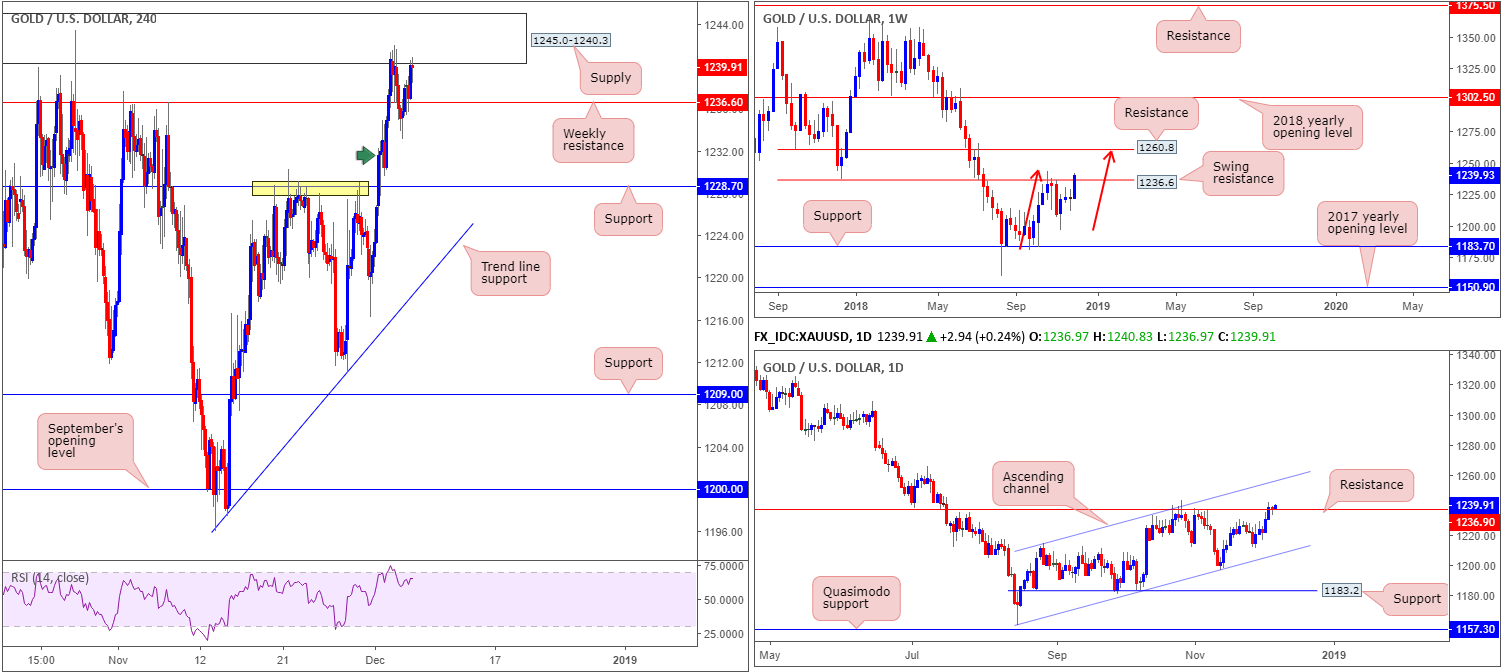
XAU/USD (Gold):
Starting from the top this morning, the research team notes weekly price is attempting to cross above its swing resistance plotted at 1236.6. Should price continue to emphasize a bullish presence from here, resistance seen at 1260.8 is likely the next hurdle in view. What’s also interesting about this level from a technical perspective is it converges closely with an AB=CD bearish completion point (red arrows).
Along the same vein, daily movement is trying to overthrow resistance at 1236.9. In the event further buying is observed, channel resistance (etched from the high 1214.3) is seen overhead. Note this ascending level also fuses reasonably closely with the weekly resistance mentioned above at 1260.8.
A closer read of price action on the H4 timeframe shows the candles responding from supply at 1245.0-1240.3, though struggling to overcome nearby demand marked with a green arrow at 1229.6-1232.8. This is not a good sign for those short this market, as the more prominent area for buyers to reside is likely around H4 support 1228.7, having seen how well it held price action lower in late Nov (yellow).
Areas of consideration:
This is a cautious market at the moment. With sellers showing limited activity around higher-timeframe resistance and mild H4 demand at 1229.6-1232.8 holding price action higher, selling is a challenge. While this may be the case, it would also be too much of a risk to contemplate buying this market when the said higher-timeframe resistance have yet to be convincingly consumed.
In light of the above analysis, opting for the sidelines may be the better path to take at the moment.
The use of the site is agreement that the site is for informational and educational purposes only and does not constitute advice in any form in the furtherance of any trade or trading decisions.
The accuracy, completeness and timeliness of the information contained on this site cannot be guaranteed. IC Markets does not warranty, guarantee or make any representations, or assume any liability with regard to financial results based on the use of the information in the site.
News, views, opinions, recommendations and other information obtained from sources outside of www.icmarkets.com.au, used in this site are believed to be reliable, but we cannot guarantee their accuracy or completeness. All such information is subject to change at any time without notice. IC Markets assumes no responsibility for the content of any linked site. The fact that such links may exist does not indicate approval or endorsement of any material contained on any linked site.
IC Markets is not liable for any harm caused by the transmission, through accessing the services or information on this site, of a computer virus, or other computer code or programming device that might be used to access, delete, damage, disable, disrupt or otherwise impede in any manner, the operation of the site or of any user’s software, hardware, data or property.


