
Key risk events today:
Australian Retail Sales m/m; US banks are closed in observance of Independence Day.
EUR/USD:
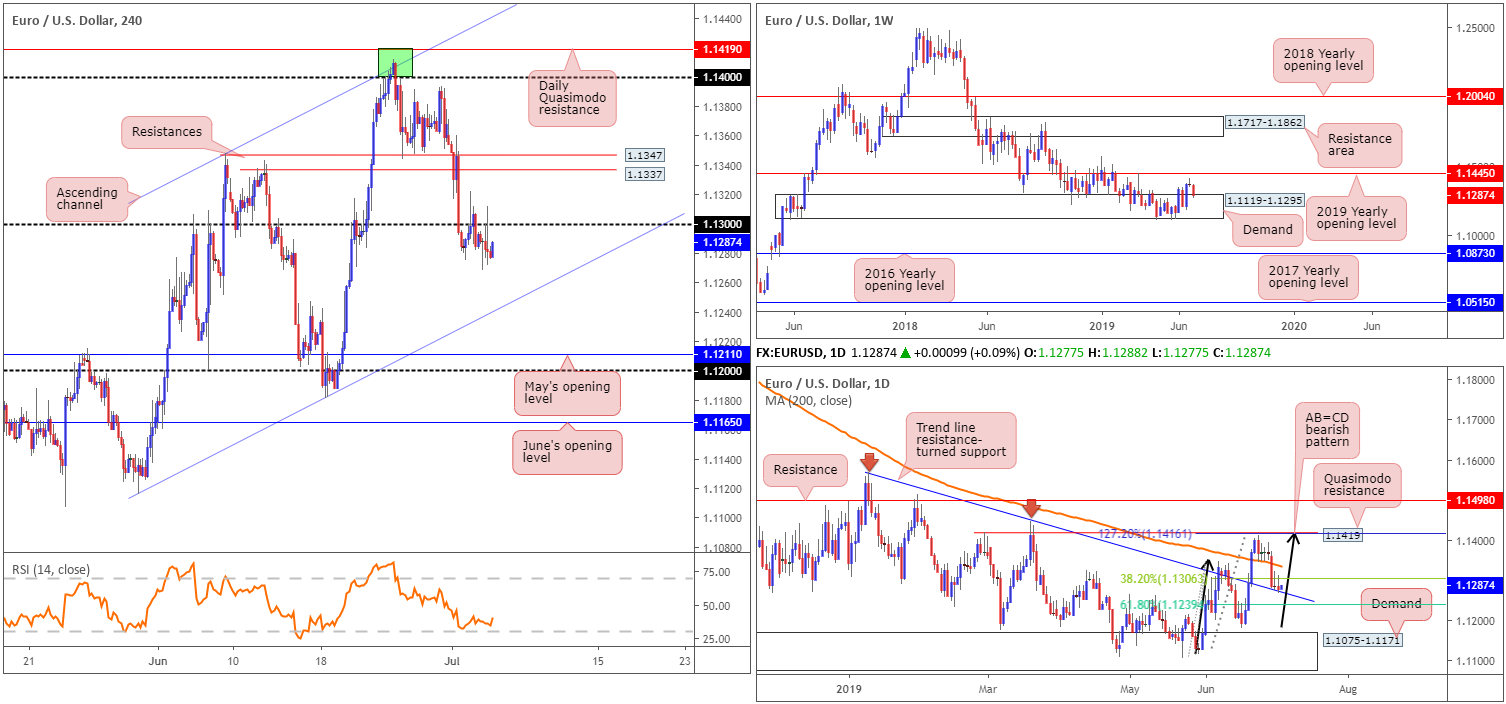
The EUR/USD extended its consolidation phase Wednesday, confined within a narrow trading band sub 1.13 on the H4 timeframe. Macroeconomic data out of the US came in lower than anticipated, though was largely ignored. US ADP Private-sector employment increased by 102,000 from May to June, on a seasonally adjusted basis, up from the previous month’s upwardly revised 41K though lower than the 140K expected. In June, the US non-manufacturing PMI registered 55.1%, 1.8 percentage points lower than the 56.9% in May.
With H4 sellers defending the underside of 1.13, a run to the channel support taken from the low 1.1116 could be on the cards. Levels of interest beyond this barrier can be seen at May’s opening level drawn from 1.1211, closely shadowed by the 1.12 handle. Indicator-based traders may also want to note the RSI is seen hovering just north of its oversold value.
Higher-timeframe movement is largely unchanged. Here’s a reminder of where we stand on the bigger picture:
On more of a broader perspective, the weekly timeframe shows price action testing the top edge of a demand area coming in at 1.1119-1.1295, after failing to connect with upside resistance at the 2019 yearly opening level drawn from 1.1445 last week. This shows signs of seller strength here.
On the daily timeframe, the pair recently touched gloves with a trend line resistance-turned support extended from the high 1.1569. Note since connecting with this line, two bearish selling wicks formed. This comes after price action recently topped just ahead of a Quasimodo resistance at 1.1419 as well as its merging 127.2% AB=CD – black arrows – bearish pattern at 1.1416, and engulfed the 200-day SMA. Harmonic traders may also acknowledge the 38.2% Fibonacci support value at 1.1306 (extended from legs A-D) was tested at the beginning of the week – considered the first take-profit target from the AB=CD formation. The next downside take-profit target can be seen at the 61.8% Fibonacci value around 1.1239, assuming we overthrow the current trend line support that is.
Areas of consideration:
As of current price, selling this market, although tempting after seeing 1.13 hold as resistance, is a chancy move. Although weekly demand mentioned above at 1.1119-1.1295 exhibits signs of weakness, the area has yet to be engulfed. Therefore, it is not a base one should overlook in terms of buying power just yet. Bolstering the said demand is the daily timeframe. Not only are we testing a trend line resistance-turned support, we’re also in correction territory for AB=CD traders between 1.1239/1.1306.
On account of the above, the research team has underlined the H4 channel support mentioned above (1.1116) as a potential buy zone today, as well as the 1.12/1.1211 combination seen just beneath it. Conservative traders may opt to wait for additional candlestick confirmation before pulling the trigger, as not only will this help identify buyer intent, it also provides entry and risk levels to work with as well.
GBP/USD:
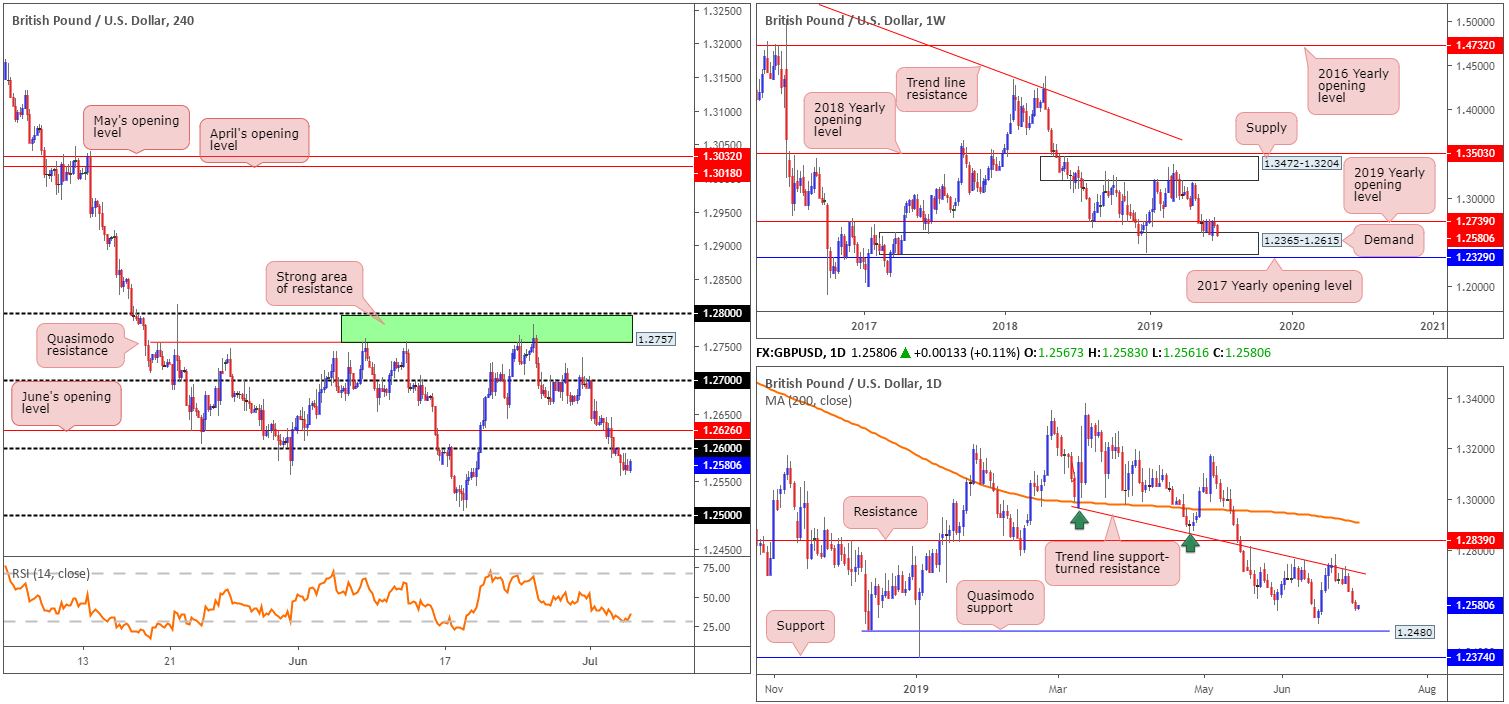
Sterling extended its slide vs. the buck Wednesday, slumping to its lowest level in two weeks. Registering its third consecutive daily loss, the GBP/USD H4 candles traded sub 1.26, potentially unlocking the door for an approach towards the 1.25 neighbourhood.
The probability of a BoE rate cut has risen again, amid another slate of weak data out of the UK yesterday. The seasonally adjusted IHS Markit/CIPS UK Services PMI Business Activity Index posted 50.2 in June, down from 51.0 in May and the lowest reading for three months. Moreover, the index registered only fractionally above the 50.0 no-change mark and therefore signalled that business activity was close to stagnation in June (Markiteconomics.com).
In terms of higher-timeframe flow, here’s where our research team stands:
From the weekly timeframe:
Buyers and sellers remain warring for position between long-standing demand at 1.2365-1.2615 and the 2019 yearly opening level at 1.2739, since May 20. Areas outside of this border to be conscious of fall in around the 2017 yearly opening level at 1.2329 (support) and supply coming in at 1.3472-1.3204.
in light of recent selling, the weekly timeframe now trades at the top edge of the aforementioned weekly demand area, thus buying may eventually ensue.
From the daily timeframe:
In tandem with the 2019 yearly opening level at 1.2739 on the weekly timeframe, daily movement concluded the week chalking up back-to-back bearish selling candles off the underside of a trend line support-turned resistance taken from the low 1.2960. Beyond here, traders’ crosshairs are likely fixed on resistance drawn from 1.2839, whereas a move lower has Quasimodo support at 1.2480 to target.
Areas of consideration:
While there’s a chance buyers may enter the fold from within the current weekly demand area at 1.2365-1.2615, selling the underside of the 1.26 handle on the H4 timeframe is also an option. This is bolstered by the fact space to press lower on the daily timeframe exists.
A retest at 1.26, in the shape of a bearish candlestick configuration – think shooting star pattern – coupled with room to press as far south as 1.25/1.2480, is certainly worthy of consideration. The idea behind needing additional candlestick confirmation at the underside of 1.26 simply comes from psychological marks being prone to whipsaws, or sometimes referred to as ‘fakeouts’.
AUD/USD:
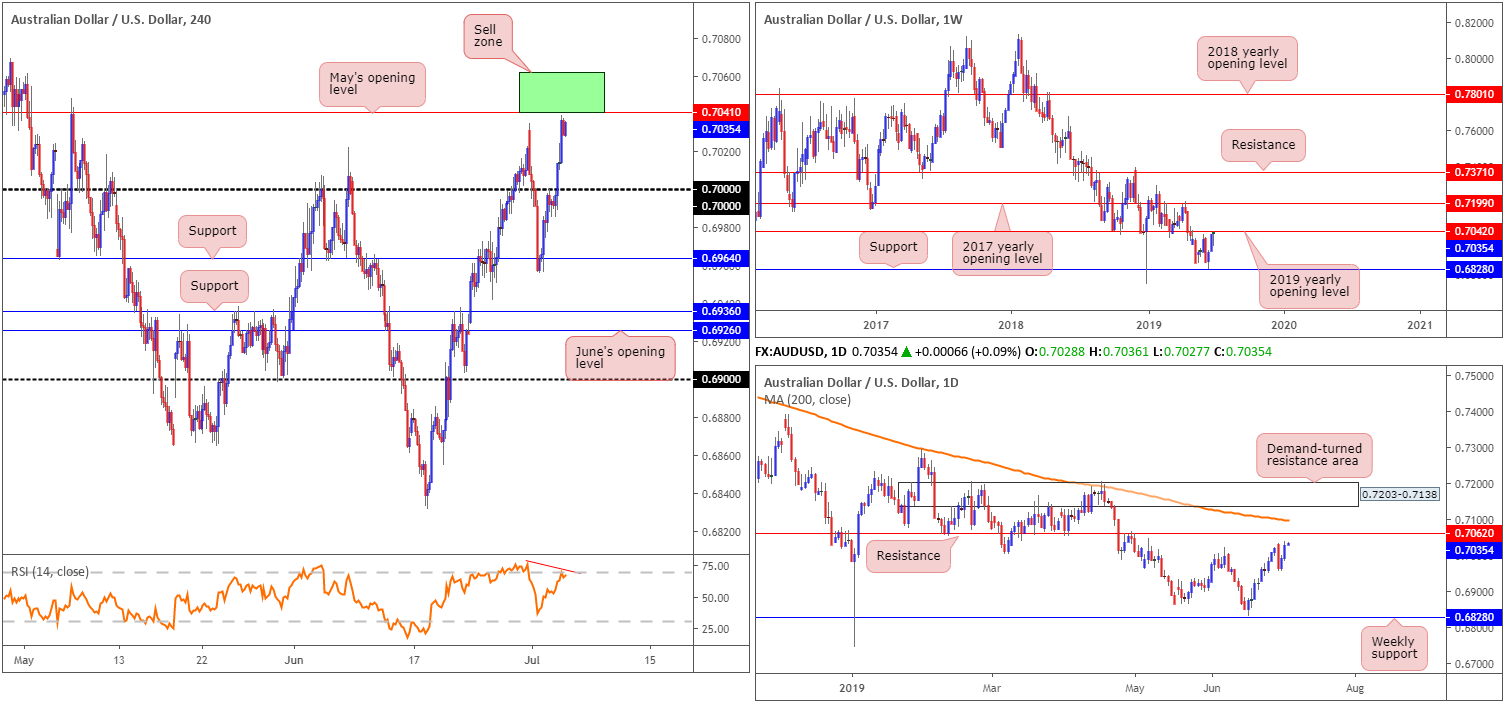
The Australian dollar gathered momentum for a second consecutive day Wednesday, consequently dethroning the key figure 0.70 to the upside and printing fresh 8-week highs. Lower US Treasury yields coupled with improved risk appetite allowed the H4 candles to close within striking distance of May’s opening level at 0.7041.
With buy stops likely triggered above Monday’s high 0.7034, shorter-term traders are likely in buy mode. While further buying could certainly take form, strong resistance lies ahead. May’s opening level at 0.7041 is unlikely sufficient to halt buying, though united with weekly resistance at 0.7042: the 2019 yearly opening level, along with nearby resistance on the daily timeframe at 0.7062 and the H4 RSI producing negative divergence (red line), we then have ourselves a reasonably strong block of resistance, represented by the green zone on the H4 timeframe.
Areas of consideration:
Focus is fixed on the 0.7062/0.7041 green sell zone on the H4 timeframe.
A combination of H4, daily and weekly resistances, is likely enough to withhold buying pressure. Traders have the option of either selling 0.7041 and positioning stops above 0.7062, or, adopting a more conservative route, waiting and seeing if a H4 candlestick signal develops within the said zone and trading on the back of its structure. The first downside target from 0.7062/0.7041 can be seen at 0.70.
USD/JPY:
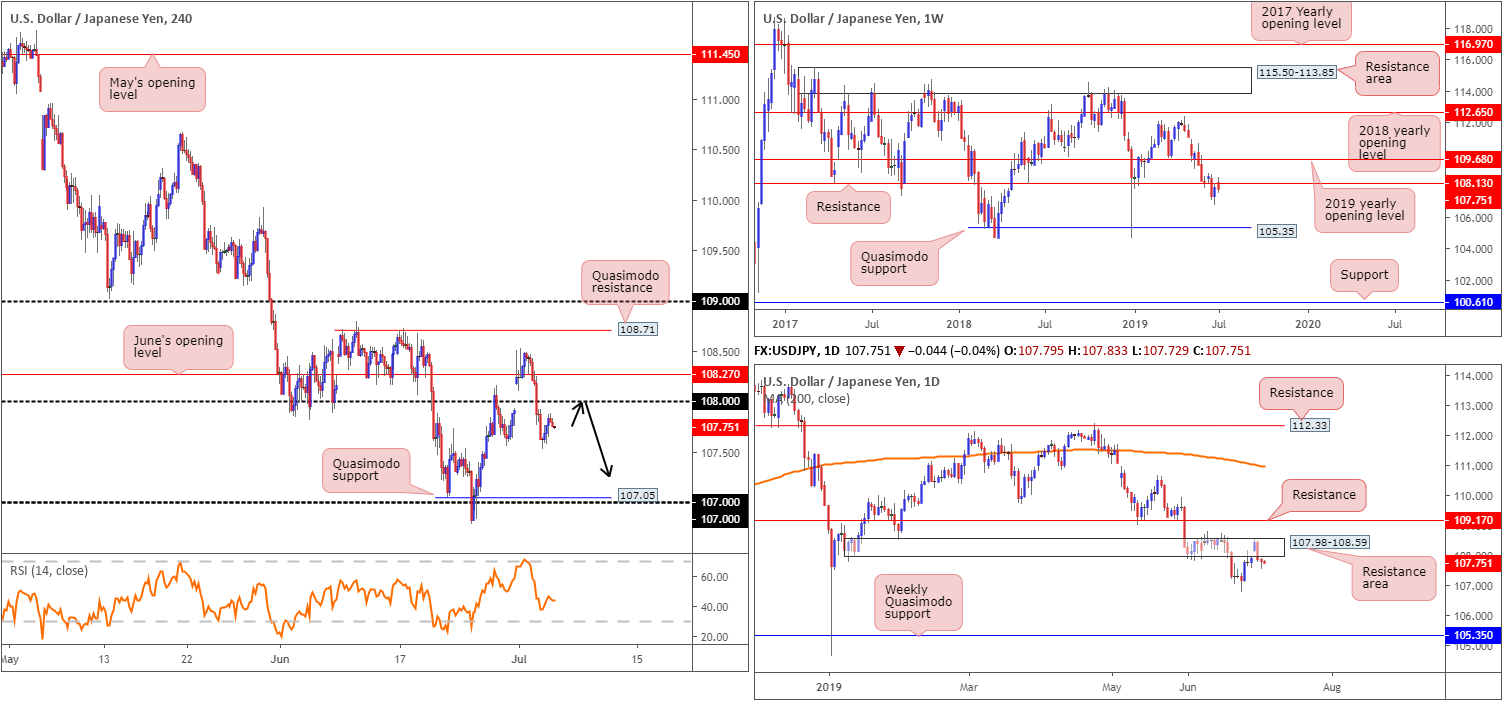
Over the course of recent sessions, US equities posted healthy gains across the board, while the US dollar index concluded the day relatively unchanged. The USD/JPY chalked up a mild recovery Wednesday, clocking a session high of 107.92, though ended the day in marginally negative territory, down 0.08%. Although largely ignored. US ADP Private-sector employment increased by 102,000 from May to June, on a seasonally adjusted basis, while US non-manufacturing PMI registered 55.1%, 1.8 percentage points lower than the 56.9% in May.
For traders who read Wednesday’s briefing you may recall the following:
Higher-timeframe analysis reveals weekly resistance at 108.13 remains in play. Having seen this level hold well as support in the past, this may encourage selling. Reinforcing the said weekly level is also a daily resistance area at 107.98-108.59. At one point, it appeared as though this area was likely to give way, though at the top edge of the boundary a wave of selling emerged. Aside from the 106.78 June 25 low, limited support is visible on both the weekly and daily timeframes until reaching the weekly Quasimodo support at 105.35.
Areas of consideration:
Also taken from Wednesday’s report:
Additional selling could be in store today. An ideal scenario for a possible short play, according to our technical reading, would be a retest of 108 as resistance. A retest of 108 in the shape of a H4 bearish candlestick signal – this is recommended as it helps identify seller intent and also provides traders entry and risk levels to work with – would, given the overall technical picture showing room for a move lower, be considered a high-probability shorting opportunity, targeting 107.05 (a H4 Quasimodo support) as the initial take-profit zone.
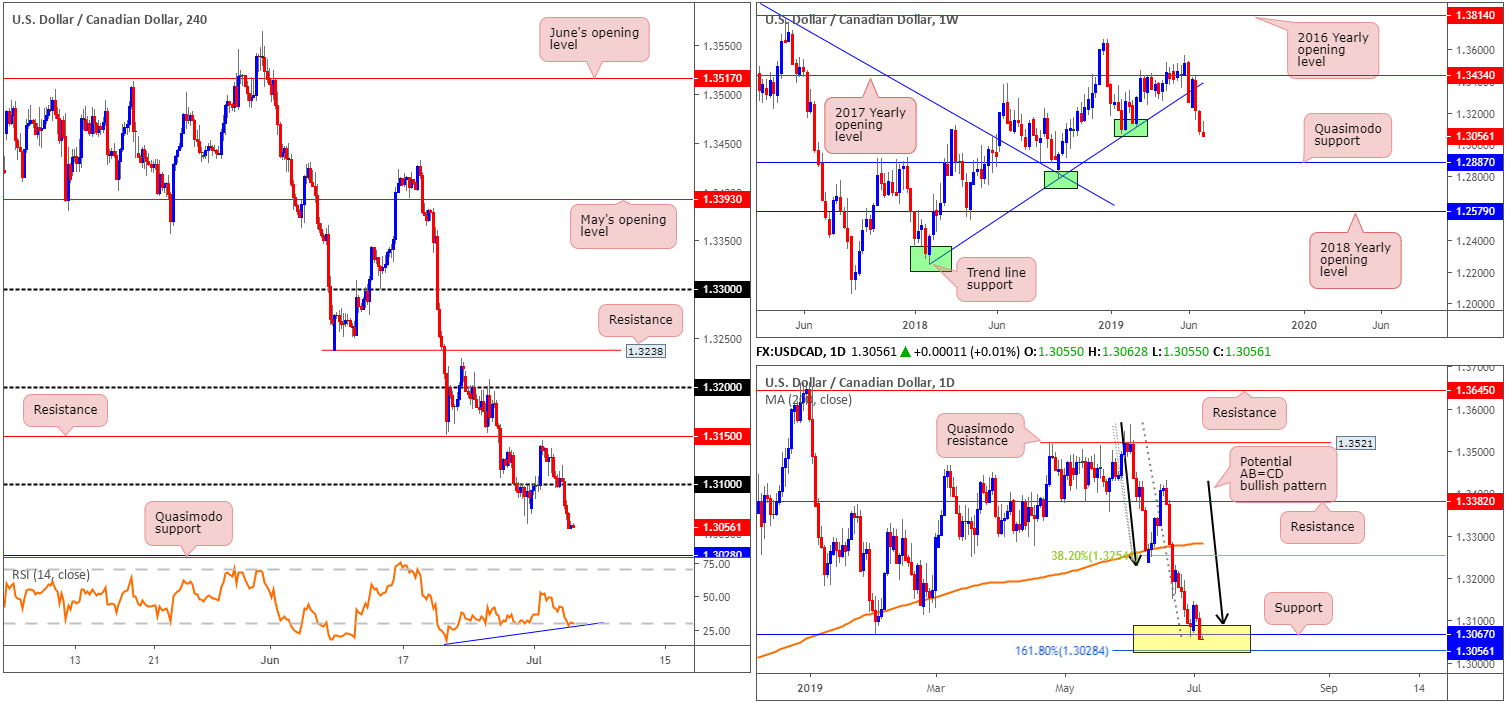
USD/CAD:
WTI traded higher Wednesday, despite a lower draw for headline crude stocks than was implied by Tuesday’s API data. This led to a USD/CAD decline taking shape which overthrew 1.31 to the downside on the H4 timeframe. Upbeat Canadian trade balance could also be cited as a reason for the pair’s latest declines.
From a technical perspective, further selling could be in store, according to the weekly structure which display’s room to trade as far south as Quasimodo support at 1.2887. Despite this, daily price remains treading water within a potential buy zone between 1.3028/1.3089 (yellow) – comprised of an AB=CD (black arrows) formation at 1.3089, a support at 1.3067 and a 161.8% Fibonacci extension at 1.3028 (forms part of the AB=CD structure).
H4 action, on the other hand, now has eyes on Quasimodo support coming in at 1.3028. Before, we reach this level, though, a retest at the underside of 1.31 may develop. It might also interest some traders to note the RSI is currently chalking up positive divergence out of oversold territory (blue line). In addition to this, the said Quasimodo support also represents the lower edge of the noted daily buy zone mentioned above.
Areas of consideration:
The H4 Quasimodo support at 1.3028, owing to its connection with the lower edge of a daily buy zone at 1.3028/1.3089, is an area of interest for possible buying today. However, with weekly flows portending further downside, waiting for a H4 bullish candlestick signal could be worthy of consideration (entry and risk levels can be determined according to the selected candlestick pattern). A response from 1.3028 could reach as far north as 1.31 for partial profit taking.
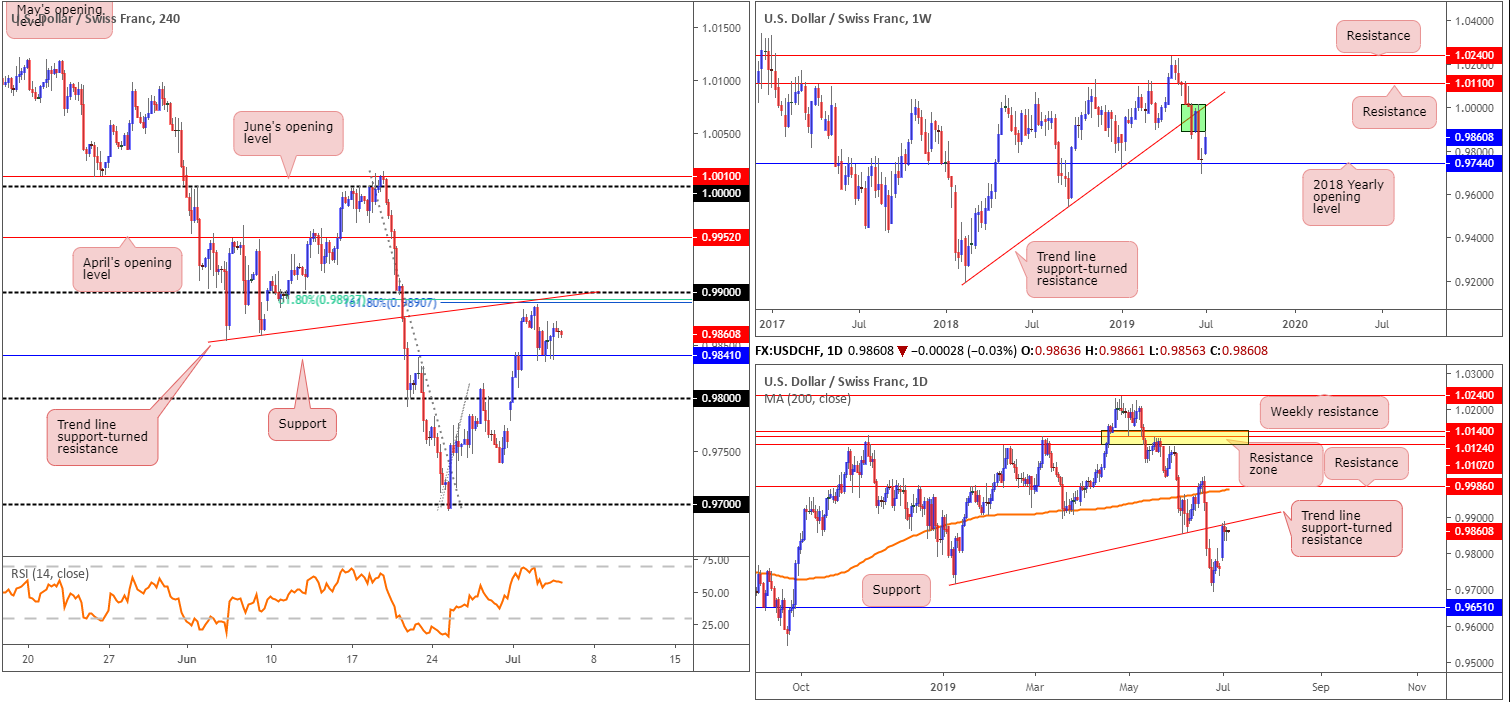
USD/CHF:
USD/CHF price action was all but unchanged Wednesday as the H4 candles established a floor off H4 support at 0.9841. In view of the lacklustre performance, much of the following piece will echo thoughts aired in Wednesday’s briefing.
From the weekly timeframe, we can see price action came within a couple of points of connecting with a thick body of supply at 1.0014-0.9892 (green) after respecting the 2018 yearly opening level (support) at 0.9744 last week. This – coupled with daily price also crossing swords with a trend line support-turned resistance taken from the low 0.9716 – is collectively weighing on the unit.
What was unfortunate was H4 price failed to connect with its 0.99 handle for a possible sell in recent trade. Note this figure boasts strong local confluence from a trend line support-turned resistance taken from the low 0.9853, a 161.8% Fibonacci extension point at 0.9890 and a 61.8% Fibonacci retracement at 0.9894.
Areas of consideration:
Technically, two potential scenarios are present, according to our technical studies:
- Further selling occurs and breaks through the current H4 support at 0.9841. This is possible, owing to where we’re coming from on the bigger picture (see above). A H4 close beyond 0.9841, therefore, opens the door to short-term selling opportunities towards 0.98 and quite possibly beyond.
- In the event the current H4 support holds and we move higher, a test of 0.99, by way of a H4 bearish candlestick configuration (can be used to set entry and risk levels), is a high probability sell, given the surrounding confluence both locally and on the bigger picture, targeting H4 support at 0.9841 as the initial take-profit zone.
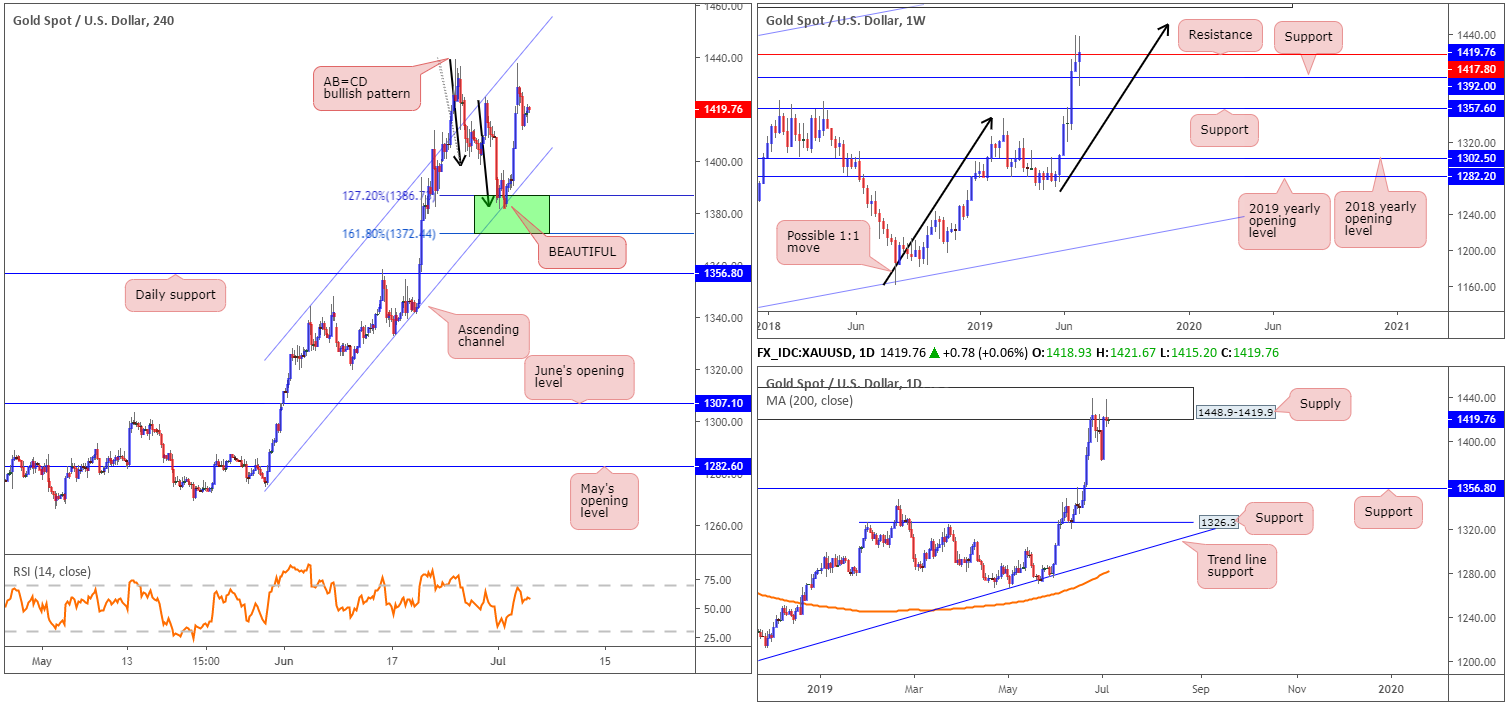
XAU/USD (GOLD):
Kicking off with a look at weekly structure, the research team notes bullion continued to climb higher after retesting support at 1392.0, and is now attempting a run above resistance at 1417.8. Further upside from this point could eventually cross paths with a 1:1 correction (black arrows) shaped from the 1160.3 August 13 low.
The story on the daily timeframe has the candles testing the lower edge of a supply zone at 1448.9-1419.9. Note the weekly resistance level at 1417.8 resides just beneath the said supply zone.
A closer reading of price action on the H4 timeframe reveals the unit responded beautifully from the highlighted buy zone between 1372.4/1386.7 (green – comprised of an AB=CD bullish pattern (black arrows), which has a termination zone positioned between the 127.2% and 161.8% Fibonacci extension points). It is also worth pointing out the weekly support level mentioned above at 1392.0 was stationed just north of this H4 base and the area also intersected with a H4 channel support extended from the low 1275.9. Well done to any of our readers who managed to jump aboard this move, as price traded as far north as the H4 channel resistance taken from the high 1344.0.
Areas of consideration:
Traders who remain long the yellow metal are encouraged to consider reducing risk to at least breakeven and even cashing in some of the position. This is due to recently connecting with higher-timeframe supply on the daily chart and also resistance on the weekly scale.
In light of upside momentum yet to show much sign of waning, though, holding a portion of the position open is an option. Should we punch for fresh highs today, moving the stop-loss order to 1411.4 is an idea. From thereafter, traders can trail behind support points once additional fresh highs are achieved.
The accuracy, completeness and timeliness of the information contained on this site cannot be guaranteed. IC Markets does not warranty, guarantee or make any representations, or assume any liability with regard to financial results based on the use of the information in the site.
News, views, opinions, recommendations and other information obtained from sources outside of www.icmarkets.com.au, used in this site are believed to be reliable, but we cannot guarantee their accuracy or completeness. All such information is subject to change at any time without notice. IC Markets assumes no responsibility for the content of any linked site.
The fact that such links may exist does not indicate approval or endorsement of any material contained on any linked site. IC Markets is not liable for any harm caused by the transmission, through accessing the services or information on this site, of a computer virus, or other computer code or programming device that might be used to access, delete, damage, disable, disrupt or otherwise impede in any manner, the operation of the site or of any user’s software, hardware, data or property.


