
Lower timeframe confirmation: is something we use a lot in our analysis. All it simply means is waiting for price action on the lower timeframes to confirm direction within a higher timeframe area. For example, some traders will not enter a trade until an opposing supply or demand area has been consumed, while on the other hand, another group of traders may only need a trendline break to confirm direction. As you can probably imagine, the list is endless. We, however, personally prefer to use the two methods of confirmation mentioned above in our trading.
EURUSD:
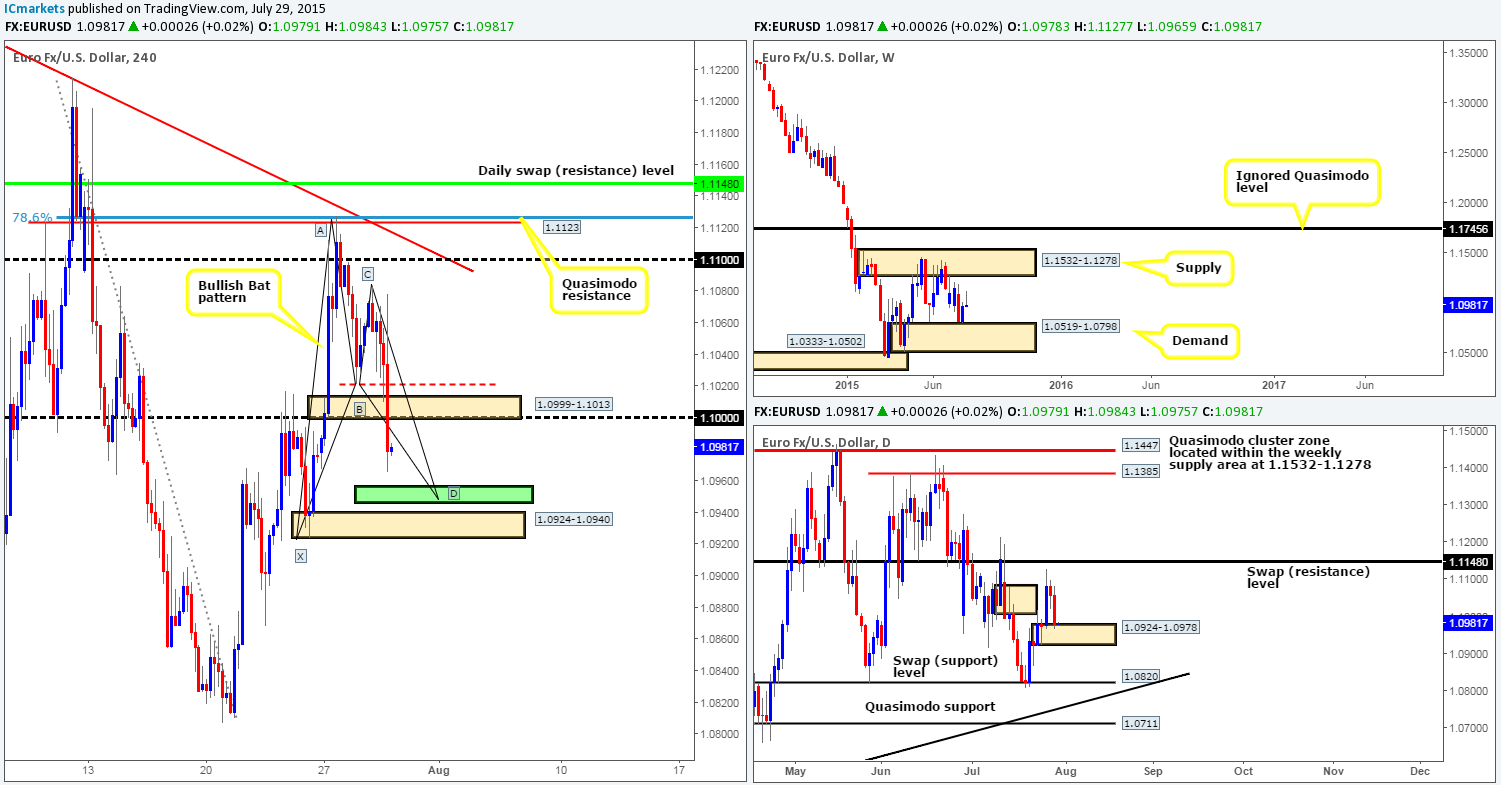
Recent events on the EUR/USD currency pair show that price did indeed fake below 1.1021 into a small 4hr decision- point (DP) demand area at 1.0999-1.1013 (as reported it may do) yesterday, rallying to highs of 1.1078 before cascading south post FOMC. This move took price below the aforementioned 4hr (DP) area reaching as low as 1.0965, which, if you look across to the daily scale, you’ll see it also forced price to collide with a daily demand area coming in at 1.0924-1.0978.
With the above in mind, and the fact that price is also still trading above weekly demand at 1.0519-1.0798, our team’s focus for today will be on looking for longs in this market…
We’re currently eyeing a (perfect) 4hr Harmonic bullish Bat pattern which completes at 1.0956-1.0946 seen in green. This potential reversal zone (PRZ) comprises of the following:
- Deep 0.886% Fibonacci retracement taken from swings A-D.
- 2.0% B-C projection.
- Alternate 127.2% AB=CD pattern.
This Harmonic PRZ is certainly somewhere we’d consider entering long from today. Nonetheless, seeing as it is hovering just above a strong looking 4hr demand area at 1.0924-1.0940, we feel that there’s a very good chance price will, if it reaches this low, likely fake below the PRZ before advancing north. That being the case, our team has come to a general consensus that instead of placing a pending buy order directly above the PRZ, we have opted to wait for the lower timeframes to confirm buying strength exists before jumping in – this should avoid any fakeout that may take place.
Levels to watch/live orders:
- Buys: 1.0924/1.0956 [Tentative – confirmation required] (Stop loss: 1.0919).
- Sells: Flat (Stop loss: N/A).
GBP/USD:
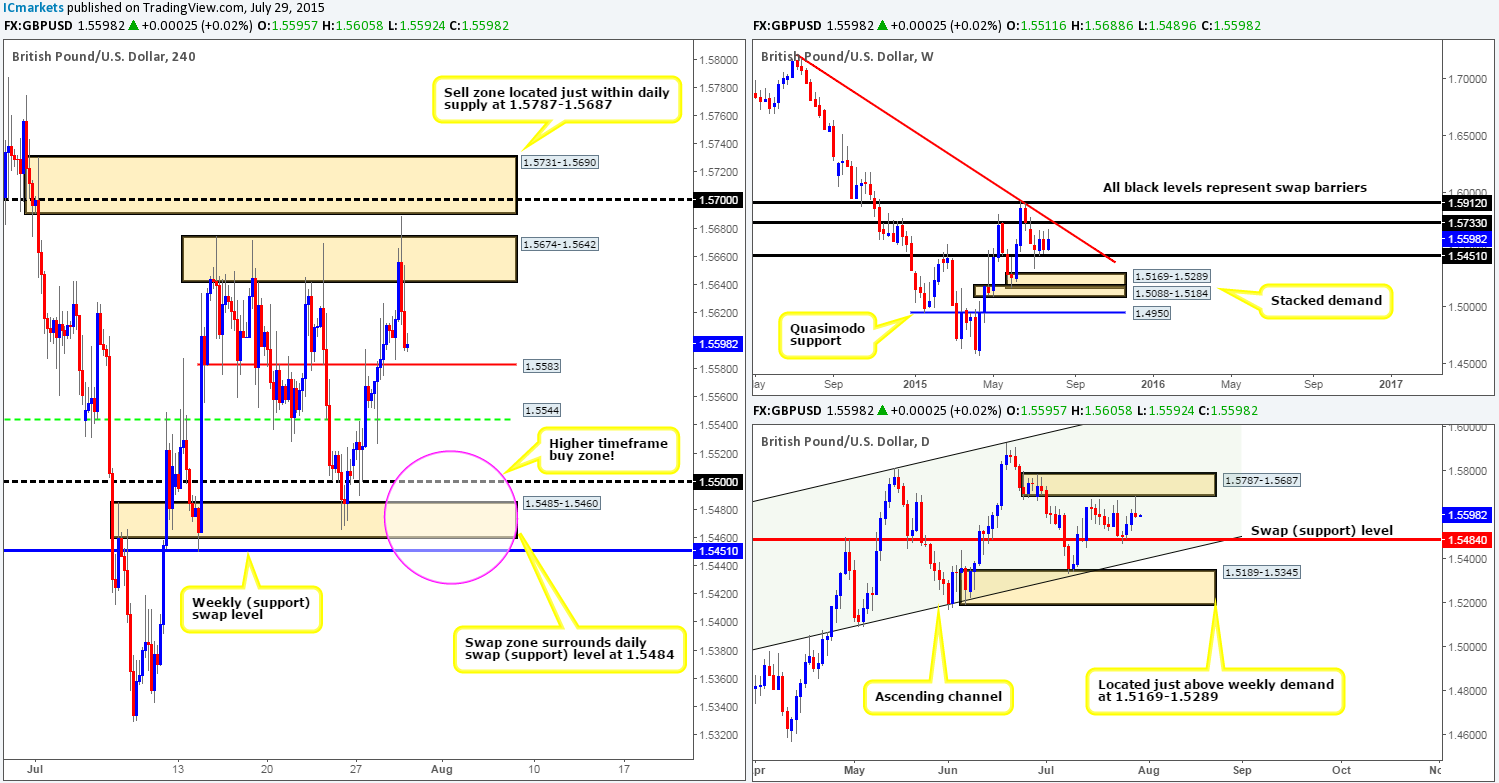
Yesterday’s action saw price miss retesting 1.5583 as support by a mere three pips before Cable shot north. The short burst of buying from here saw price fake above the 4hr resistance base at 1.5674-1.5642, and clip the lower limits of 4hr supply looming above it at 1.5731-1.5690 before sending the market back down to the 1.5593 region.
In addition to this, we can also see that the daily timeframe printed a nice looking bearish pin-bar candle during yesterday’s trade off the back of a daily supply area at 1.5787-1.5687, which could attract further sellers into this market forcing prices to retest the daily swap (support) level at 1.5484.
Given the points made above, here is what we have noted so far for today:
- Shorting the daily bearish pin-bar is not something we are keen on doing since there are two supportive ledges lurking just below current price on the 4hr timeframe – the 1.5583 level, and also the 1.5544 barrier.
- Buying from the above said 4hr levels could be ok for small bounce trade we believe, but, do keep in mind that price may be more attracted to the higher timeframe hurdles positioned lower – the aforementioned daily swap (support) level and also the weekly swap (support) level at 1.5451. As such, the pink circle on the 4hr chart is somewhere we’d definitely be interested in buying this market should price reach this low today.
Levels to watch/ live orders:
- Buys: 1.5583 [Tentative – confirmation required] (Stop loss: dependent on where one confirms this level) 1.5544 [Tentative – confirmation required] (Stop loss: dependent on where one confirms this level) 1.5500/1.5451 [Tentative – confirmation required] (Stop loss: dependent on where one confirms this area).
- Sells: Flat (Stop loss: N/A).
AUD/USD:
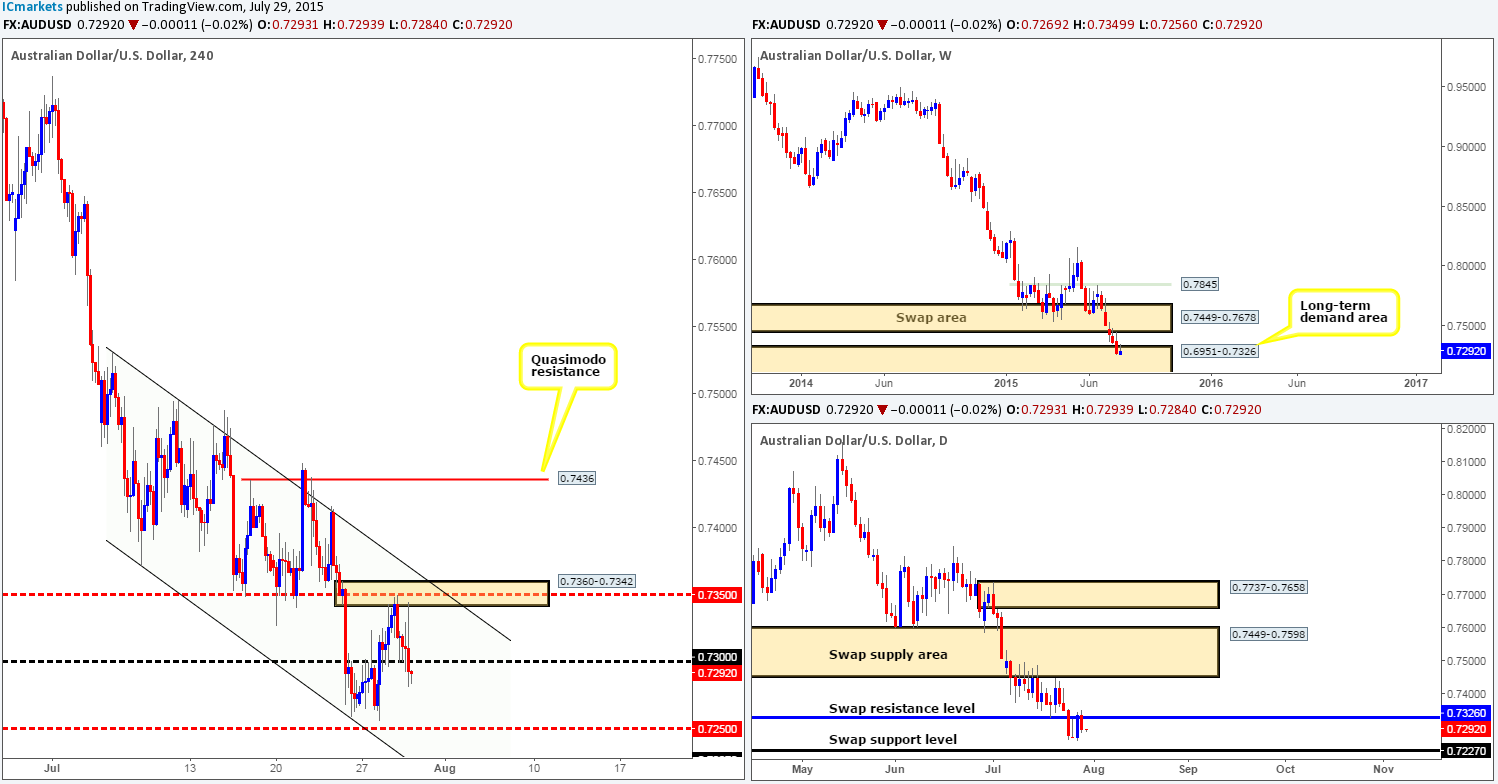
The AUD/USD pair dropped lower from a 4hr supply area coming in at 0.7360-0.7342 amid yesterday’s sessions. This saw price plunge down towards 0.7300 which held on three consecutive touches but was, as you can see, eventually engulfed.
Now, taking into account the points made below, It is very difficult for us to be bullish on this pair right now even with price trading within weekly demand. Therefore, with room being seen for prices to move further south on the daily timeframe down to the daily swap (support) level at 0.7227, today’s spotlight will be firmly focused on looking for a retest trade off the underside of 0.7300. As long as lower timeframe selling confirmation accompanies this retest, we’d likely short, taking partial profits at the mid-level number 0.7250 first and foremost, and then likely let the rest of position run with our stop at breakeven in attempt to join this seemingly never-ending downtrend.
- Long-term weekly downtrend in play.
- Price currently trading within long-term weekly demand at 0.6951-0.7326.
- Price just recently reacting off the underside of a daily swap (resistance) level at 0.7326.
Levels to watch/ live orders:
- Buys: Flat (Stop loss: N/A).
- Sells: 0.7300 [Tentative – confirmation required] (Stop loss: dependent on where one confirms this level).
USD/JPY:
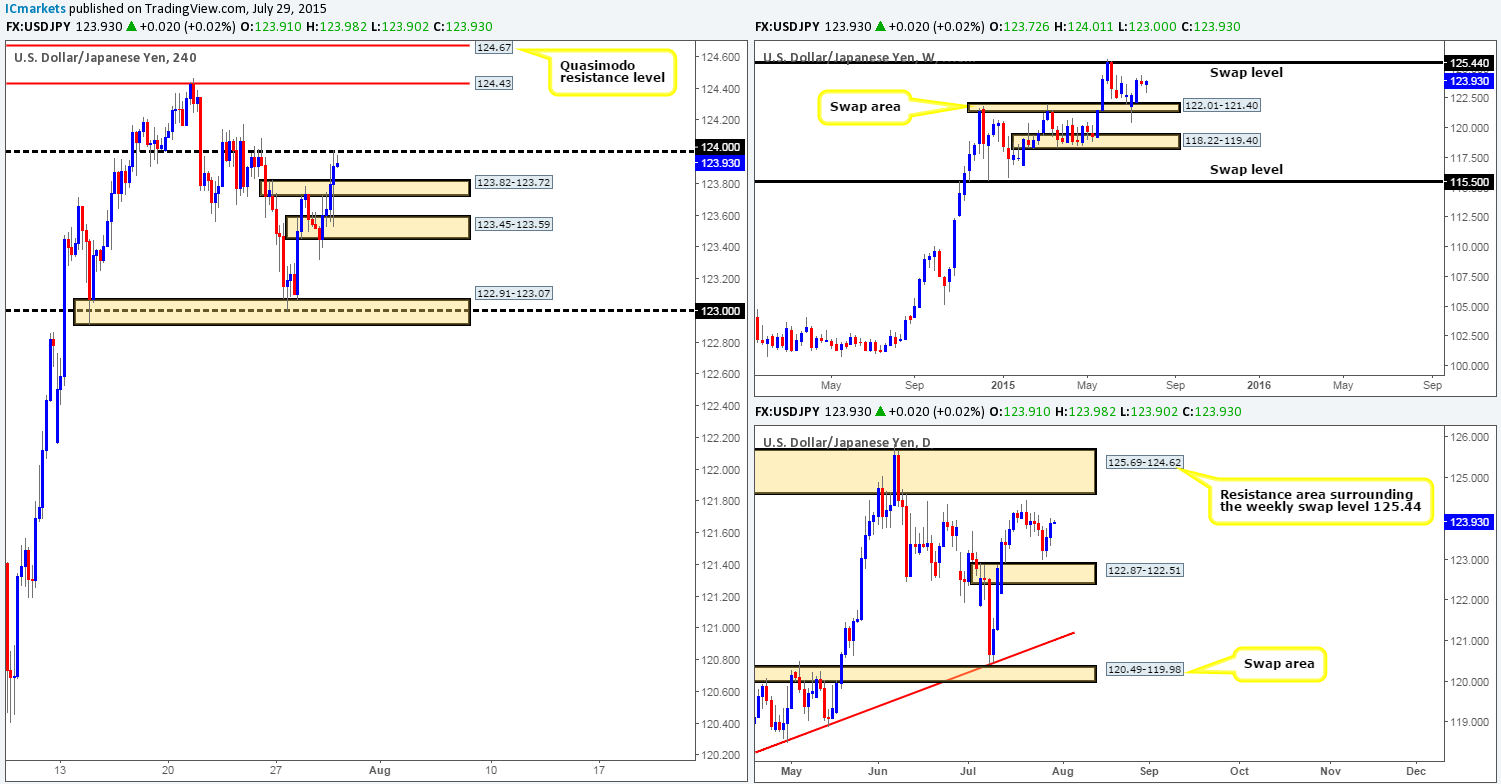
Following a rather aggressive fake below the small 4hr demand area at 123.45-123.59 yesterday, a steady wave of bids came into this market consequently pushing price above the opposing 4hr supply area at 123.82-123.72, and connecting with round-number resistance at 124.00. Well done to any of our readers who managed to lock in some green pips from this move as the aforementioned 4hr demand area was highlighted as a potential reversal zone in our previous report: http://www.icmarkets.com/blog/wednesday-29th-july-fomc-statement-today-at-6pm-gmt-could-cause-ripples-in-major-markets-remain-vigilant/
Moving forward, risk/reward parameters would argue against shorting 124.00 today due to potential support lurking just below at the recently broken 4hr supply (now demand) at 123.82-123.72. That being the case, should we see price chew through offers sitting at 124.00 today, there might be a possible buying opportunity in store, since looking across to the weekly and daily timeframes, we see very little resistance on the horizon.
To trade long following a break above 124.00, we’d need to see price not only retest 124.00 as support and hold, but also see some form of lower timeframe buying confirmation at this region. Should the above play out, our team would likely target the 4hr resistance level at 124.43 and potentially the 4hr Quasimodo resistance level sitting above it at 124.67, which, as you can probably see, is actually located just within a daily resistance area coming in at 125.69-124.62 (see daily chart).
Levels to watch/ live orders:
- Buys: Watch for 124.00 to be consumed and then look to enter on any retest seen (confirmation required).
- Sells: Flat (Stop loss: N/A).
USD/CAD:
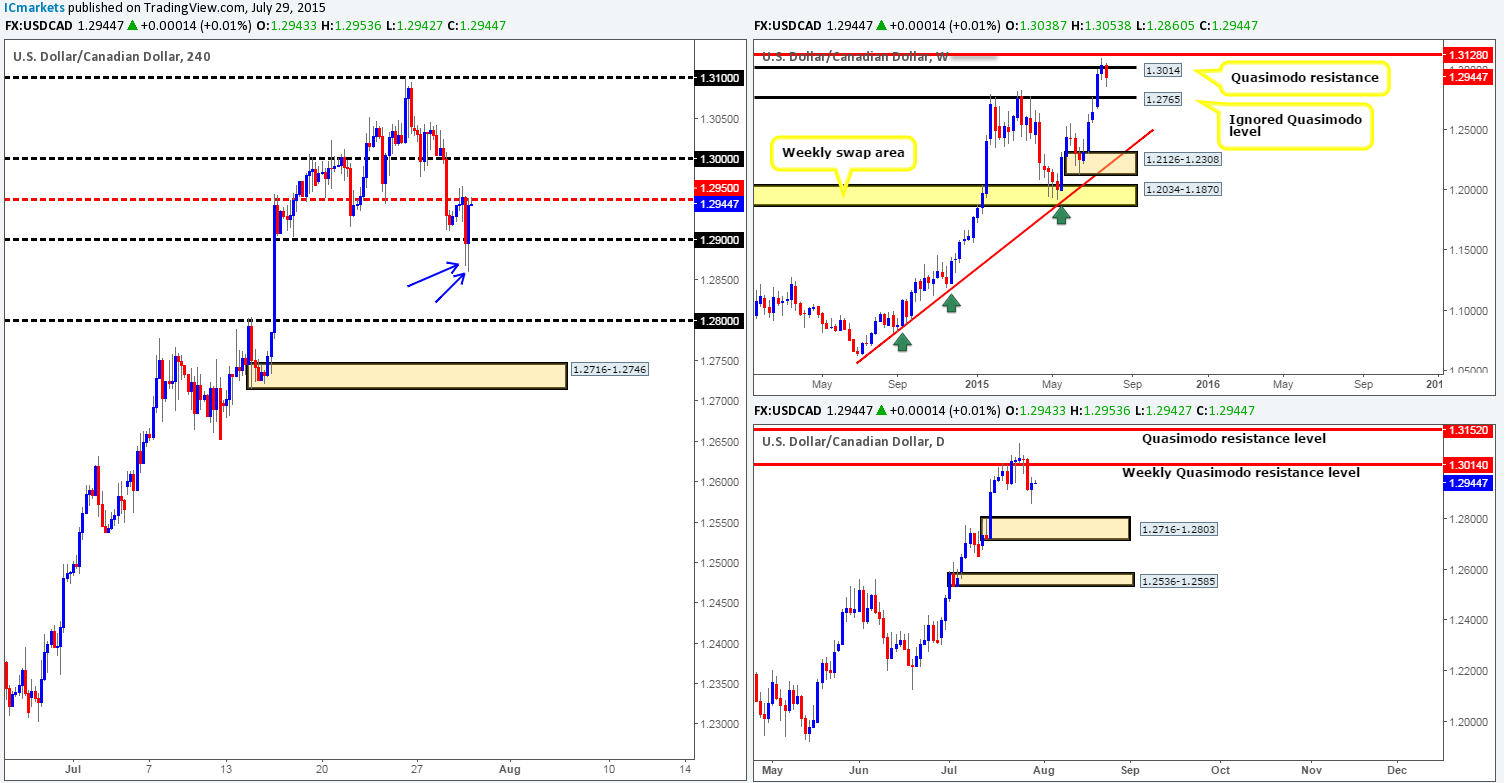
Going into the early hours of yesterday’s sessions, price drew resistance from the mid-level hurdle 1.2950 which ended with prices aggressively selling off and connecting with 1.2900. 1.2900, however, responded just as aggressively by pushing prices back up to the aforementioned mid-level barrier to end the day at 1.2943.
Given that price has just recently sold off from a weekly Quasimodo resistance level at 1.3014, we still remain hesitant about buying this market which may sound crazy to some considering the humongous uptrend this pair is in right now. Ultimately, what our team is looking for today is a convincing close below 1.2900 since the space below this number looks clean down to 1.2800. Check out the two buying tails formed yesterday (blue arrows) at 1.2867/1.2860. These tails likely stopped out a ton of traders attempting to not only fade this number, but also sell the breakout. As such, we already believe this level is weak. Nonetheless, for us to be permitted to trade below 1.2900, we’d need to see this number retested as resistance with lower timeframe selling confirmation.
Levels to watch/ live orders:
- Buys: Flat (Stop loss: N/A).
- Sells: Watch for 1.2900 to be consumed and then look to enter on any retest seen (confirmation required).
USD/CHF:
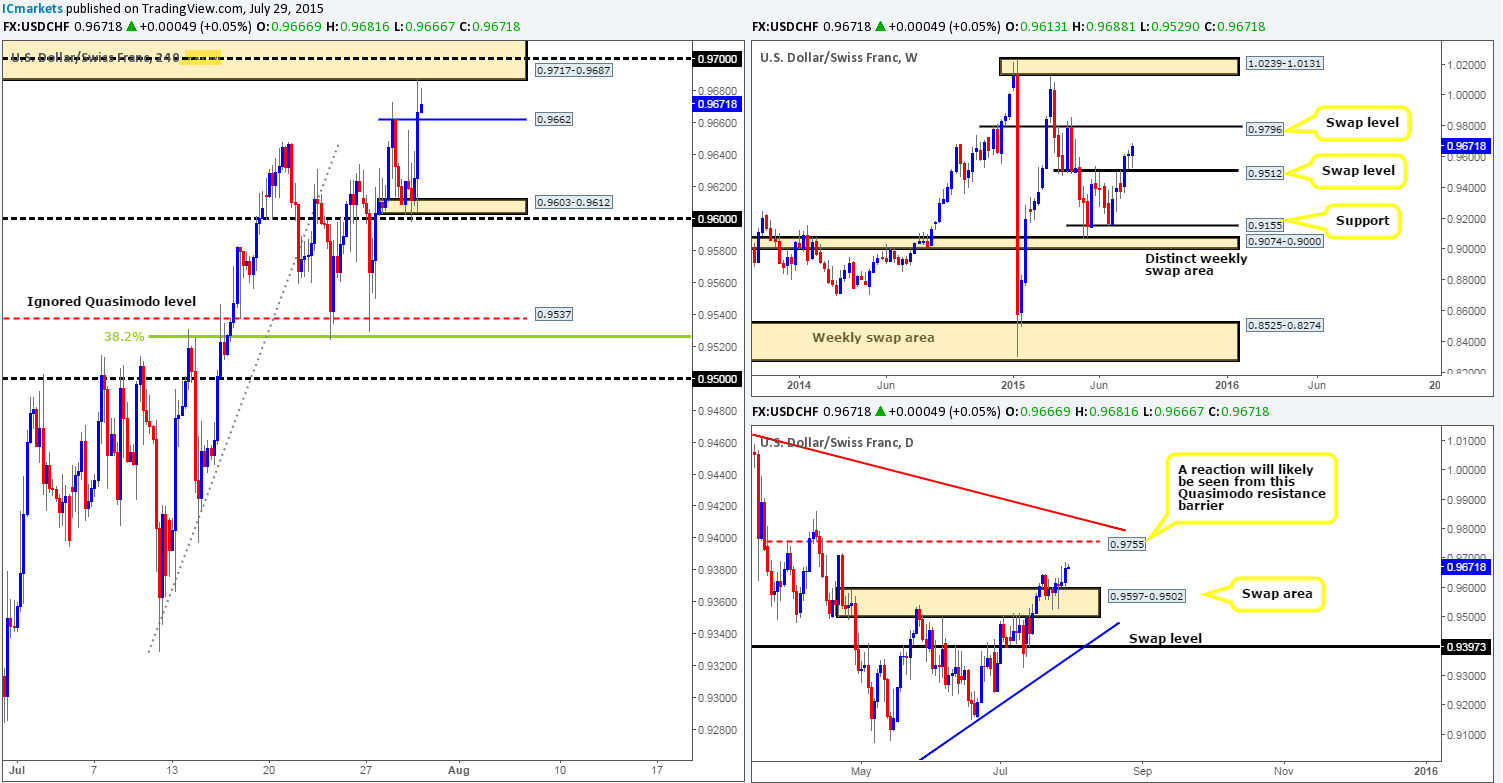
For those who read our previous report on the USD/CHF pair: http://www.icmarkets.com/blog/wednesday-29th-july-fomc-statement-today-at-6pm-gmt-could-cause-ripples-in-major-markets-remain-vigilant/ you may recall that we mentioned to keep a close eye on lower timeframe price action around the 4hr demand area at 0.9603-0.9612, as we believed price would rally from here up to the 4hr supply area at 0.9717-0.9687. As you can see, we were correct in this case. Well done to anyone who managed to lock in some green pips with this move!
Going forward, we still see very little resistance on the higher timeframes until price reaches the daily Quasimodo resistance level coming in at 0.9755. With this, we would usually say buying was an option today but considering we have just entered into the jaws of the aforementioned 4hr supply area, entering long right now may not be the best path to take. Be that as it may, should we see 0.9662 support this market today, and prices move on to attack and consume the 0.9700 level positioned within this 4hr supply zone, we may then consider entering long.
Assuming that 0.9662 is unable to hold this market higher today, however, and price breaks lower, we could potentially see a sharp drop back down to origin – the 4hr demand area at 0.9603-0.9612. This could be a tradable intraday short (confirmation required) as long as price successfully retests 0.9662 as resistance beforehand.
Levels to watch/ live orders:
- Buys: Watch for 0.9700 to be consumed and then look to enter on any retest seen (confirmation required).
- Sells: Watch for 0.9662 to be consumed and then look to enter on any retest seen (confirmation required).
DOW 30:
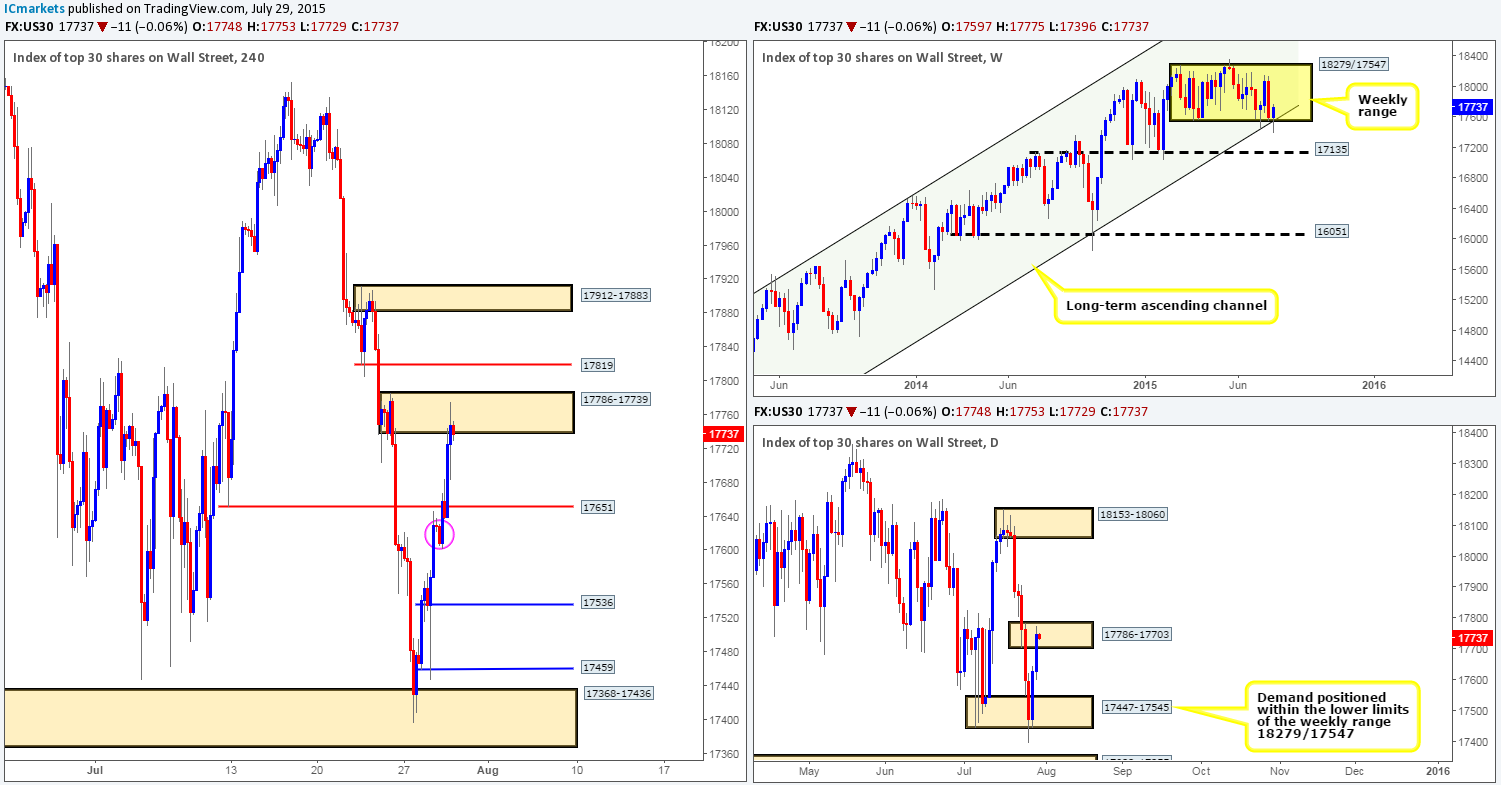
Following the rebound seen from the 4hr demand area at 17368-17436, bids continued pushing this market north during the course of yesterday’s sessions. Consequent to this, price action took out the 4hr swap (resistance which is now support) level 17651, and has just recently crossed swords with a 4hr supply area seen at 17786-17739, which if you look across to the daily timeframe, you’ll likely see that this 4hr area is lodged firmly within the upper limits of a daily supply zone at 17786-17703.
Now, with the weekly timeframe showing room for price to move further north, and both the daily and 4hr timeframes sitting within supply at the moment, it is quite difficult to judge any sort of medium-term direction at this point. That being the case, we have decided to simply only trade intraday moves today from the following pre-determined levels of interest using lower timeframe confirmation as extra guidance:
Buy zones:
- 17561. This 4hr swap (support) level may see a bounce should price return here today. Waiting for lower timeframe confirmation here is especially important since there is a very good chance that price will likely fakeout lower to the 4hr demand area circled in pink at 17629-17637.
Sell zones:
- Current 4hr supply area at 17786-17739. This beauty is not only sitting deep within a daily supply area (see above), but also shows that strong selling momentum was seen during the formation of this 4hr supply zone, thus making it a key area for us today.
- Should price fake above the aforementioned 4hr supply area, however, there is a good chance it will connect with 17819. To catch this move, you’ll likely have to zoom right down into the 5 minute or even the 1 minute timeframe to confirm this trade, or, if you’re feeling brave, one could simply place a pending sell order just below this barrier at 17810.
Levels to watch/ live orders:
- Buys: 17651 [Tentative – confirmation required] (Stop loss: dependent on where one confirms this level).
- Sells: 17786-17739 [Tentative – confirmation required] (Stop loss: 17793) 17819 [Tentative – confirmation required] (Stop loss: dependent on where one confirms this level).
XAU/USD: (Gold)
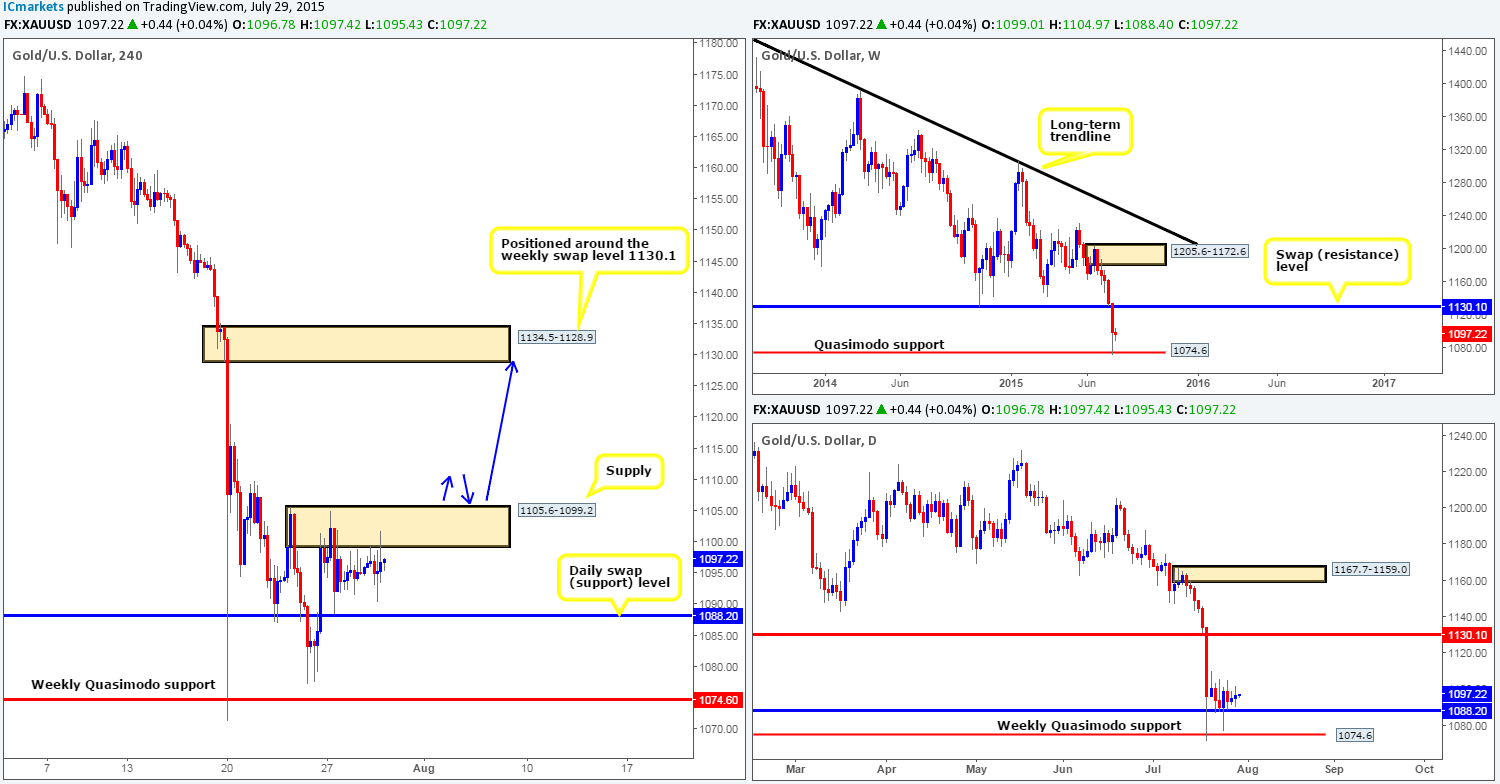
Much the same as yesterday’s report, the Gold market seems to have recently stagnated. As such, most of the following analysis will be similar to the previous…
From the bigger picture, price is currently seen holding above a weekly Quasimodo support level at 1074.6, while on the daily timeframe, price is being supported by a long-term daily swap (support) level coming in at 1088.2. Moving down to the 4hr scale, we can still see price hovering just below a 4hr supply area at 1105.6-1099.2, which we believe is a key obstacle to a move towards the 4hr supply area at 1134.5-1128.9 (located around the weekly swap [resistance] level at 1130.1).
Therefore, what we’re ideally looking to see during today’s sessions is a push above the 4hr supply zone at 1105.6-1099.2, since this could give rise to the possibility of a long position on the retest of this area as demand (check blue arrows). Lower timeframe confirmation will be needed here (at least for us) since one can never be sure how stable the zone is or how deep price will fakeout.
Levels to watch/ live orders:
- Buys: Watch for 1105.6-1099.2 to be consumed and then look to enter long on any retest seen (confirmation required).
- Sells: Flat (Stop loss: N/A).


