Lower timeframe confirmation: is something we use a lot in our analysis. All it simply means is waiting for price action on the lower timeframes to confirm direction within a higher timeframe area. For example, some traders will not enter a trade until an opposing supply or demand area has been consumed, while on the other hand, another group of traders may only need a trendline break to confirm direction. As you can probably imagine, the list is endless. We, however, personally prefer to use the two methods of confirmation mentioned above in our trading.
EURUSD:
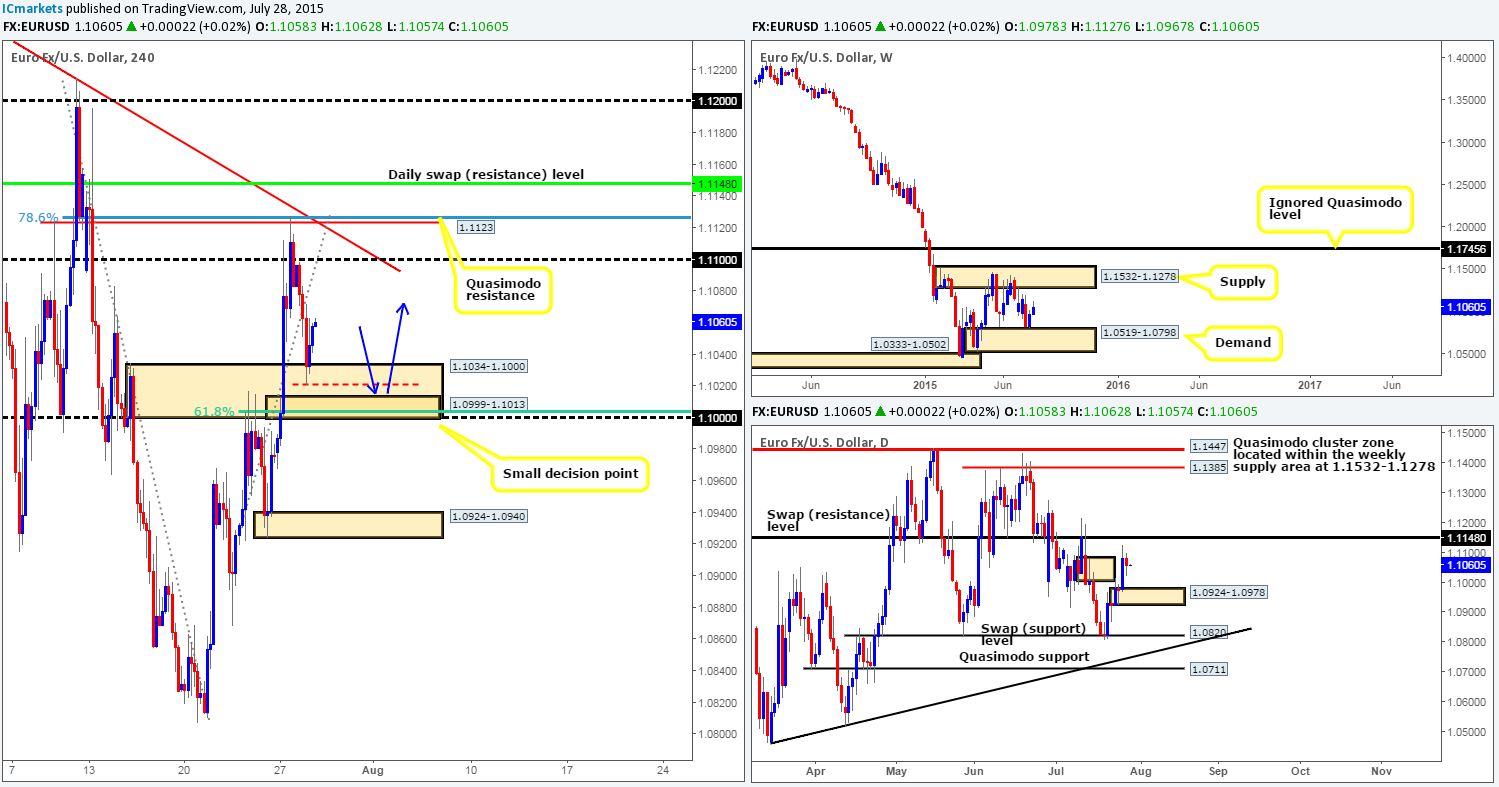
Following the rebound from the 4hr Quasimodo resistance level at 1.1123, price broke below and retested the 1.1100 region before selling off yesterday. It was only once we saw price connect with a 4hr swap (demand) area at 1.1034-1.1000 did the market begin to reverse.
Now, with regards to the bigger picture, the buyers are still in overall control after touching base with weekly demand at 1.0519-1.0798 last week. Should bids remain strong here, there is no reason (on this timeframe) why price will not attempt to challenge the weekly supply seen above at 1.1532-1.1278. Rolling a page lower down to the daily scale, we can see that the majority of offers have now likely been consumed around the daily supply area at 1.1083-1.1006, consequently leaving the path north clear up to at least 1.1148 – a daily swap (resistance) level.
Therefore, with a certain harmony being seen on this pair at the moment (see above in bold), our main focus for today will be on looking for longs. Nonetheless, as things stand, it appears we may have missed the boat so to speak at entering long at the aforementioned 4hr swap (demand) area, which was a shame as there was beautiful 15 minute price action buying confirmation! With that, the best thing we believe we can do today is look, or dare we say ‘hope’, that price retraces and retests this swap (demand) area once more. In the event that this does occur, we’ll be looking for price to fake below1.1021 into a small 4hr decision-point demand area at 1.0999-1.1013 (blue arrows). It would be here that we’d begin watching for lower timeframe price action confirmation since other than providing a perfect fakeout base; it also converges with the following:
- Sits within the larger aforementioned 4hr swap (demand) area.
- Round-number support at 1.1000.
- 61.8% Fibonacci support level.
Levels to watch/live orders:
- Buys:1.0999-1.1013 [Tentative o confirmation required] (Stop loss: 1.0994).
- Sells: Flat (Stop loss: N/A).
GBP/USD:
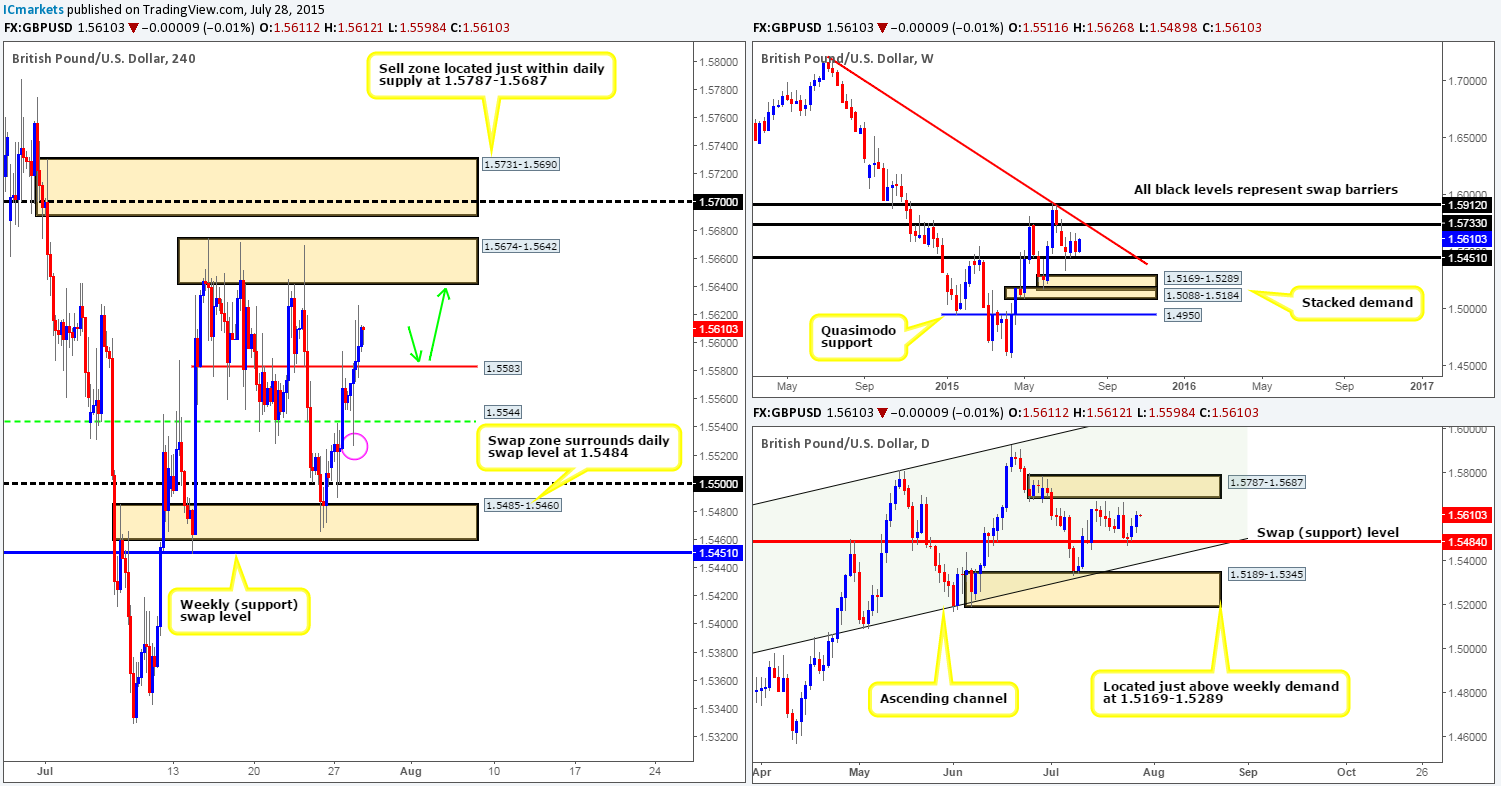
For those who read our previous report on Cable, you may recall us mentioning to keep an eye on the 4hr swap (support) level at 1.5544 for potential buying opportunities http://www.icmarkets.com/blog/tuesday-28th-july-daily-technical-outlook-and-review/. As we can all see, price did indeed react to this hurdle which followed with an advance north breaking above 1.5583, and opening up the strong possibility that we may see price collide with the 4hr resistance base at 1.5674-1.5642 today, which is located just below the daily supply area at 1.5787-1.5687 (a nice take-profit target for any long trades taken from 1.5544).Unfortunately, price reacted so quickly to 1.5544 that we had little chance of entering long with lower timeframe confirmation – well done to any of our readers who did though!
Going forward, should price retrace before reaching the aforementioned take-profit area, we may see price retest 1.5583 as support which could provide a nice base to look for intraday longs today as per the green arrows. Just to be on the safe side here though, we would not place a pending buy order at this barrier due to the high risk of a fakeout as we saw yesterday below at 1.5544 (circled). Therefore, we will only consider an entry long from here should lower timeframe price action also be agreeable.
Levels to watch/ live orders:
- Buys: 1.5583 [Tentative – confirmation required] (Stop loss: dependent on where one confirms this level).
- Sells: Flat (Stop loss: N/A).
AUD/USD:
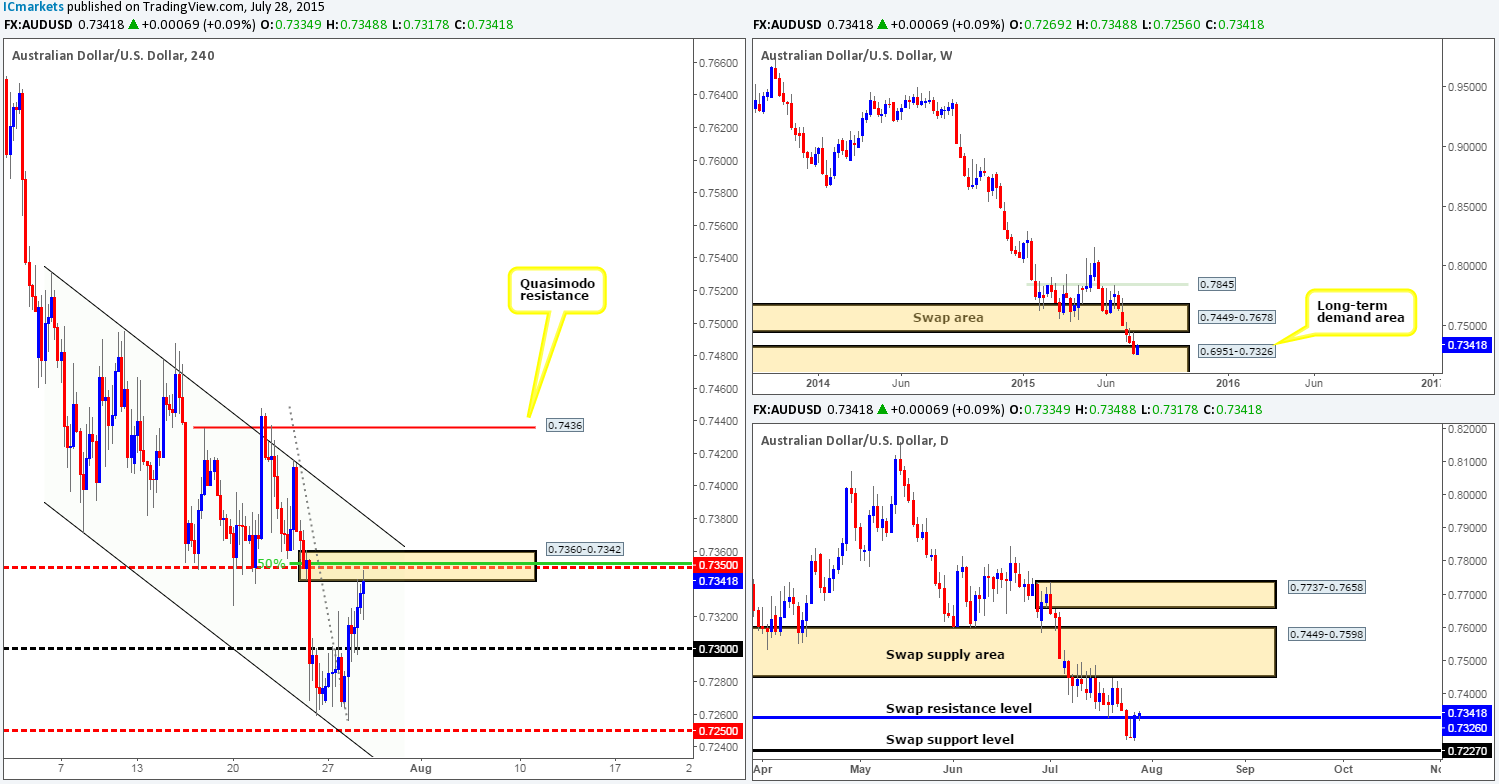
Beginning with the weekly timeframe this morning – buying interest is currently being seen within the long-term weekly demand area at 0.6951-0.7326, which as a result, has forced price to close just above a daily swap (resistance) level at 0.7326. Should the buyers remain strong above this hurdle, we might, just might, see the Aussie advance further north to shake hands with the daily swap (supply) area at 0.7449-0.7598.
As we slide lower down to the 4hr timeframe, we can see that this recent buying has forced price to cross swords with a small, yet confluent, 4hr supply area coming in at 0.7360-0.7342. Confluence is currently being seen from the following structures:
- Mid-level number 0.7350.
- 50% retracement point from the high 0.7448 to the low 0.7256.
- Overhead resistance seen from the upper limit of a 4hr descending channel taken from the high 0.7531 and low 0.7371.
Therefore, to buy based on the current higher timeframe action may not be the best path to take until we see price breakout above the 4hr descending channel, since we believe the path north would then likely be clear up to the 4hr Quasimodo resistance level at 0.7436 – positioned just below the aforementioned daily swap (supply) area.
Levels to watch/ live orders:
- Buys: Flat (Stop loss: N/A).
- Sells: Flat (Stop loss: N/A).
USD/JPY:
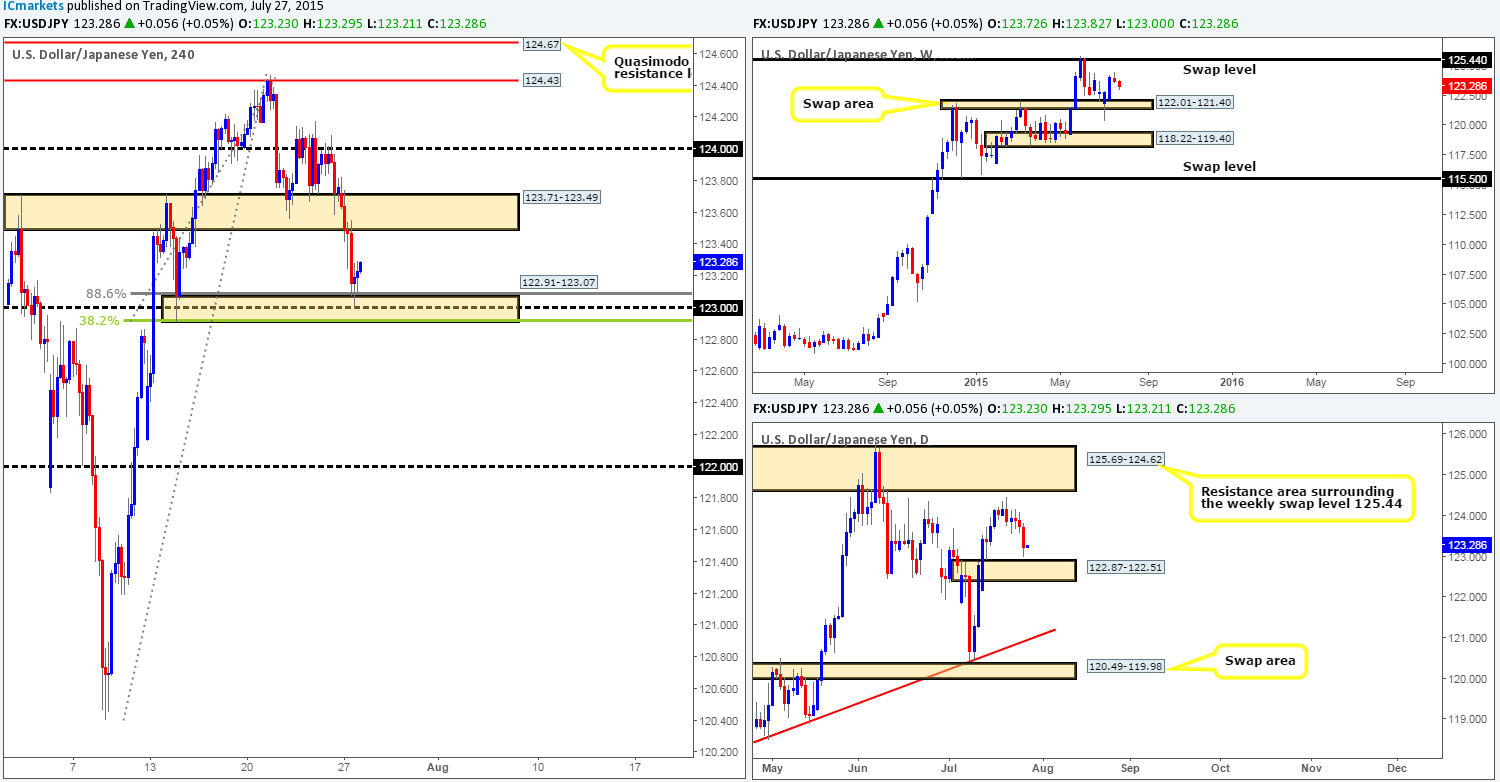
During the course of yesterday’s trade, a strong wave of bids came into this market from the 4hr demand area coming in at 122.91-123.07, which, as you can see, allowed price to connect with a small, yet clearly resilient 4hr supply area at 123.82-123.72. We were, as you can see by looking at our previous report http://www.icmarkets.com/blog/tuesday-28th-july-daily-technical-outlook-and-review/, intending to enter long from this 4hr demand barrier should lower timeframe price action display a suitable buy signal. Regrettably, we were not able to pin-point an entry which was a terrible shame since the risk/reward was extremely favorable on this trade.
Going forward, we can see that price is currently trading within a small ‘kink’ 4hr demand at 123.45-123.59, which is holding firm at the time of writing. In the event that this zone continues to hold going into the more liquid sessions today, we may see prices rally up to 124.00 (potential long opportunity – confirmation is required) since offers at the aforementioned 4hr supply area are likely consumed now. Be that as it may, should we see this current 4hr demand zone give way, however, we could then be in for a shard drop back down to the 4hr demand area at 122.91-123.07, which would certainly be somewhere we’d consider entering long again due to the following converging structures (repeated from the previous analysis):
- Sits just above the daily swap (demand) area at 122.87-122.51.
- Round-number support at 123.00.
- 38.2% Fibonacci barrier at 122.91.
- Deep 88.6 Fibonacci level at 123.08.
However, as we mentioned in yesterday’s report, should price hit this confluent 4hr demand area once more, price could effectively dive lower to connect with the aforementioned daily swap (demand) area thus faking below the current 4hr demand zone. This would consume a ton of sell stops from both traders already long and breakout sellers looking to sell, thus providing liquidity for the big boys to buy into. In the event that a fake lower does indeed happen and price springs back forming a pin bar of sorts, we would likely take the plunge here and enter long at market.
Levels to watch/ live orders:
- Buys:123.45-123.59 [Tentative – confirmation required] (Stop loss: 123.42) 122.91-123.07 [Tentative – confirmation required] (Stop loss: dependent on where one confirms this area since a fakeout is likely here).
- Sells: Flat (Stop loss: N/A).
USD/CAD:
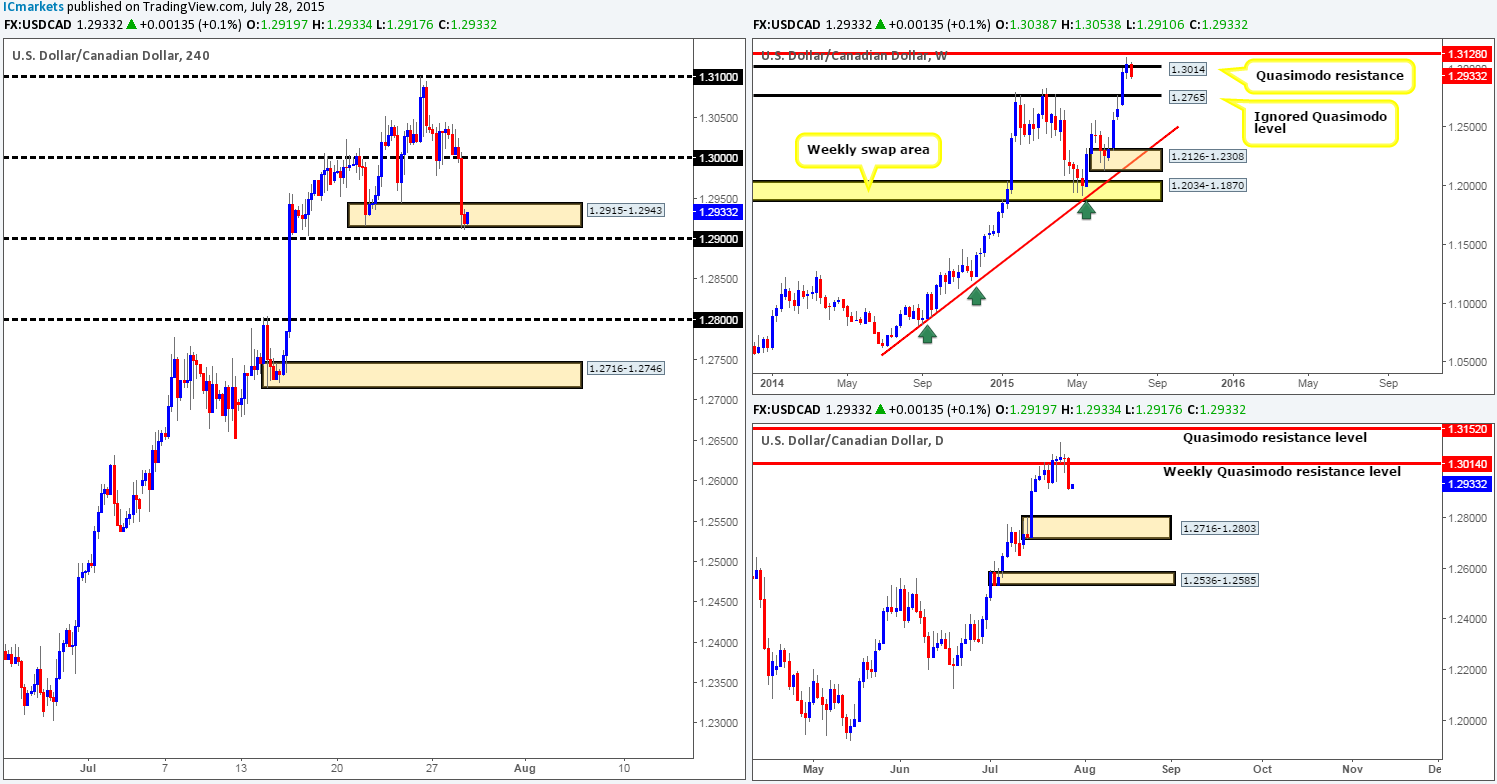
The floor from under the round number 1.3000 was ripped apart as we entered into the U.S session yesterday. This, as you can see, forced price to hit and extend slightly below 4hr demand at 1.2915-1.2943. Now, considering that this market is currently trading from a weekly Quasimodo resistance level at 1.3014 at the moment, we could potentially see further downside today. With that said, however, price has to break through both the aforementioned 4hr demand area and the round number 1.2900 before this market can indeed move lower.
Given the points made above, here is what we have noted so far:
- Buying from the current 4hr supports is not something we’d feel comfortable with due to how aggressively price sold off from the weekly Quasimodo resistance level, which sounds a little crazy we imagine considering the USD/CAD pair is in a humongous uptrend right now! In addition to this though, we also see space below on the higher timeframes for prices to continue selling off, which as we’re sure you’re already aware, is not really something you’d want to buy into when price has just reacted off of a weekly resistance barrier.
- In the event that 1.2900 is taken out today, we may then be interested in shorting this market, since the space below this number looks clean down to 1.2800. Nonetheless, for us to be permitted to trade this move, we’d need to see 1.2900 retested as resistance, and some sort of lower timeframe selling signal accompanying this retest.
Levels to watch/ live orders:
- Buys:Flat (Stop loss: N/A).
- Sells:Watch for 1.2900 to be consumed and then look to enter on any retest seen (confirmation required).
USD/CHF:
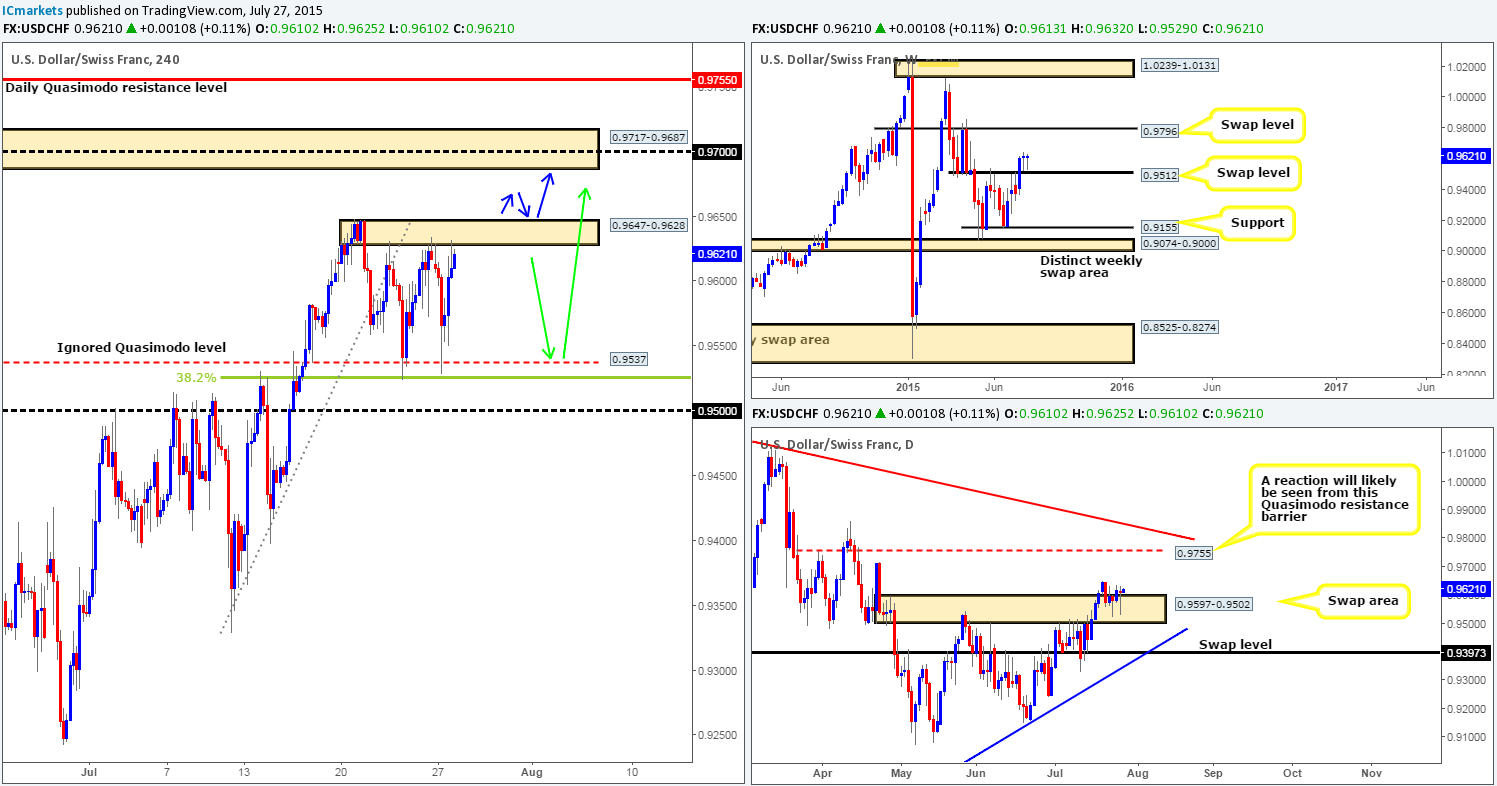
Going into yesterday’s London session, strong bids came into the market consequently forcing price to break above the 4hr supply area coming in at 0.9647-0.9628. This buying came to an abrupt end, however, around the 0.9070 mark at the U.S. open which saw price aggressively sell-off down to a small 4hr demand area at 0.9603-0.9612. Although this demand zone is small, it is very significant in our opinion since this is where we believe pro money made the initial decision to break higher, thus this area may contain unfilled buy orders here. This – coupled with the fact that price is once again seen respecting the top-side limit of the weekly swap (support) level at 0.9512, and bids are still seen holding firm within the daily swap (demand) area at 0.9597-0.9502, makes this an awesome 4hr demand area to look for buying opportunities today.
Waiting for lower timeframe confirmation at the current 4hr demand area is highly recommended, nonetheless, since this area is so small; a fakeout lower is almost guaranteed to be seen down to the 0.9600 region. Should we manage to find a long entry here today, we’ll then look to trail this position up to the next 4hr supply area seen at 0.9717-0.9687 – our take-profit target.
Levels to watch/ live orders:
- Buys: 0.9603-0.9612 [Tentative – confirmation required] (Stop loss: dependent on where one confirms this area).
- Sells: Flat (Stop loss: N/A).
DOW 30:
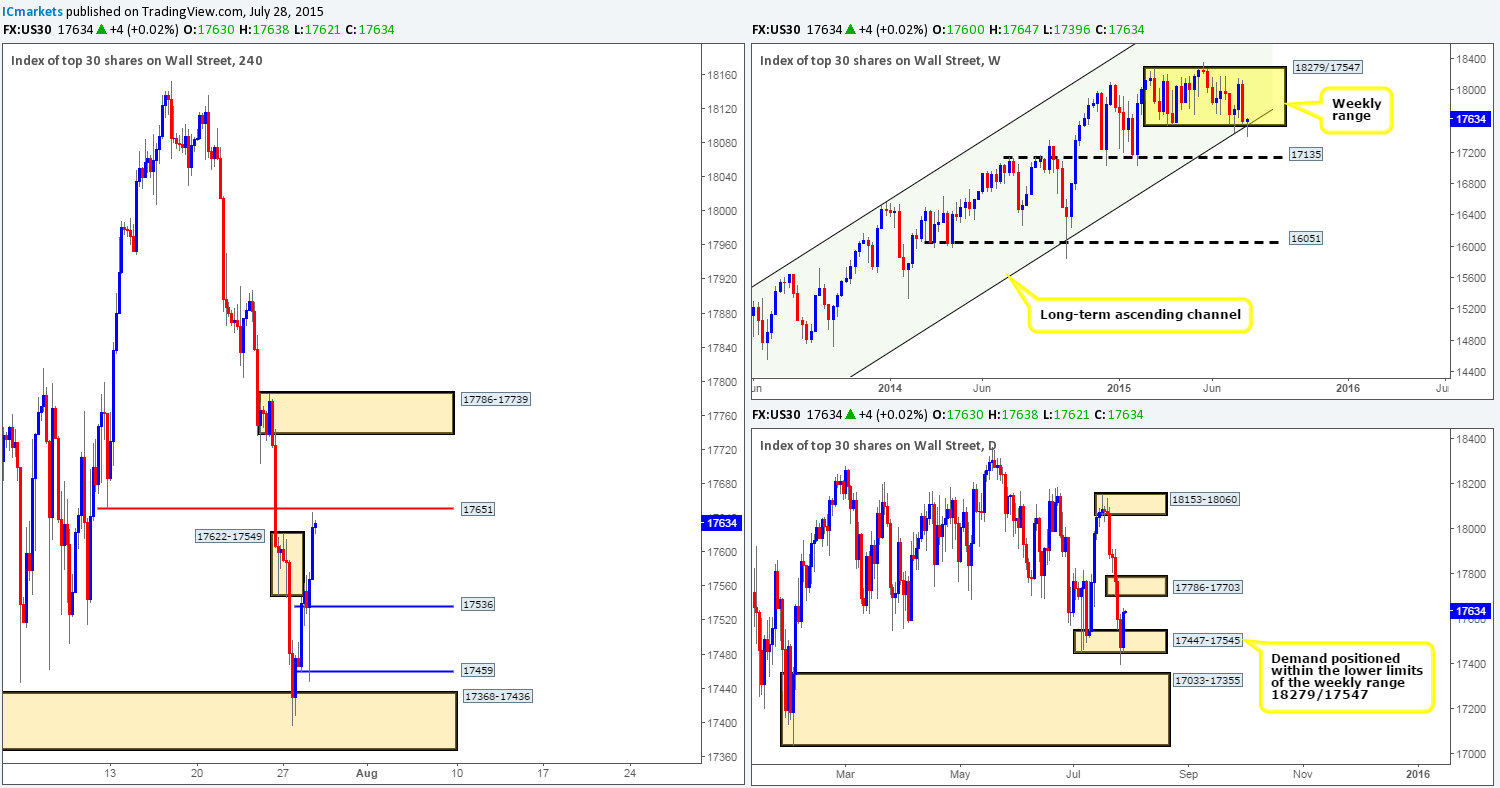
Working our way from the top this morning, the DOW index shows that price once again faked below the lower limits of the weekly range at 18279/17547, which, as you can see,boasts additional support from the weekly ascending channel support limit taken from the low 10402. Moving down to the daily timeframe, however, we can see that price also faked out below the daily demand area 17447-17545, missing the daily demand area at 17033-17355 below it by only a few points.
Sliding down to the 4hr timeframe, it is clear that the fakeout seen on the higher timeframes found support from a fresh 4hr demand area coming in at 17368-17436. The rebound seen from this barrier saw price take out the 4hr supply zone seen at 17622-17549, thus potentially clearing the path north up to 4hr supply seen at 17786-17739. This – banded together with clear higher timeframe support (see above in bold) firmly places us in the buyers’ camp today. Levels we currently have our eye on for longs are as follows:
- 17536 – This was where we believe the decision was made to initially break higher, thus there could very well be unfilled buy orders still remaining here.
- 17459 – This is actually a small Quasimodo support which coupled with the 4hr demand area seen below it at 17368-17436 may see a reaction.
Just to be clear here, we would ideally like to see price spike above 17651 before retracing to our areas of interest, that way, we can be relatively confident that offers at this level have likely been taken out there already. On a final note, we would not consider setting pending orders at these levels – lower timeframe confirming price action will be needed since it is difficult to tell which zone will react, if any!
Levels to watch/ live orders:
- Buys: 17536 [Tentative – confirmation required] (Stop loss: dependent on where one confirms this level) 17459 [Tentative – confirmation required] (Stop loss: dependent on where one confirms this level).
- Sells: Flat (Stop loss: N/A).
XAU/USD: (Gold)
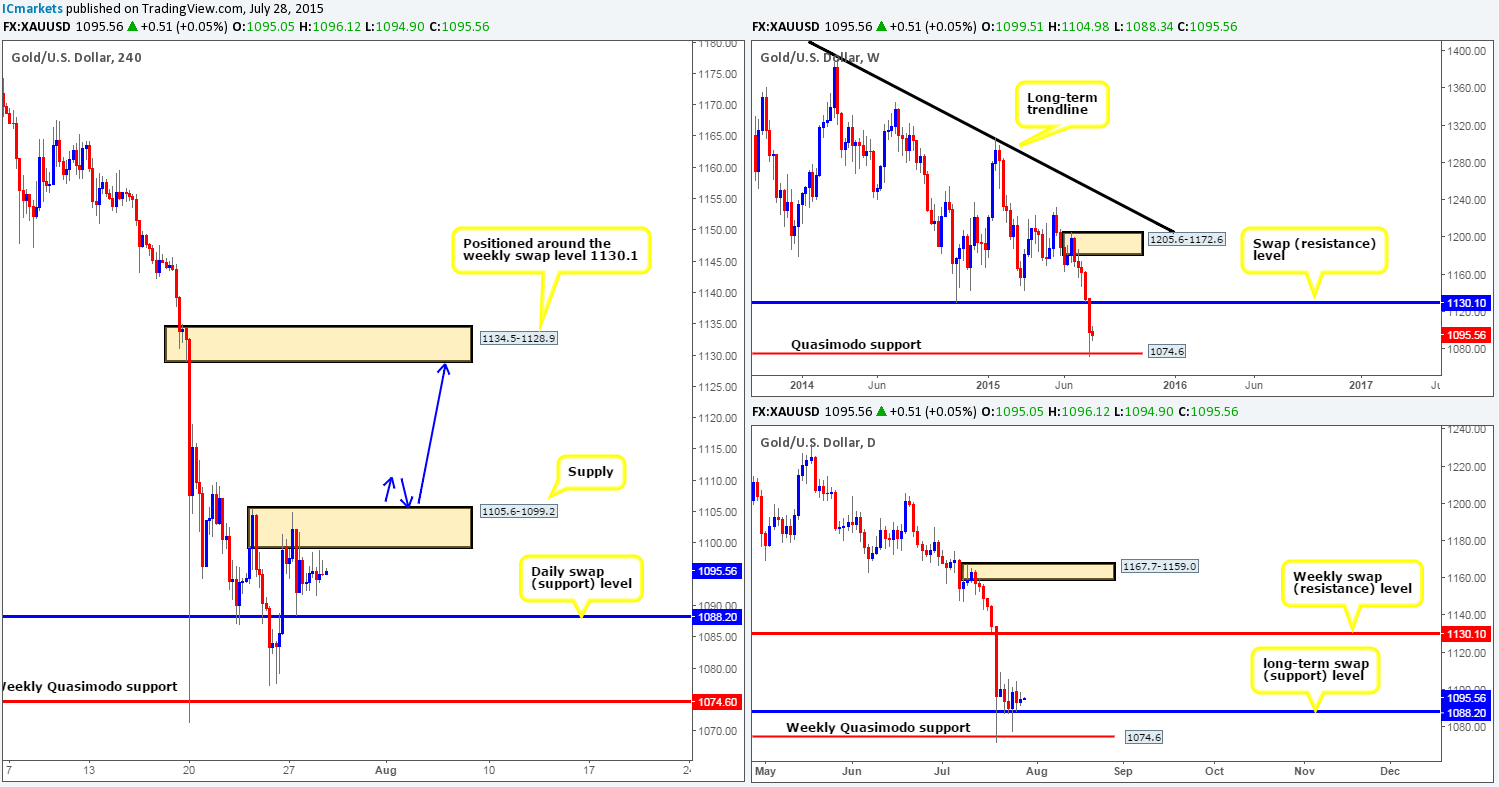
Consequent to yesterday’s lackluster performance, much of the following analysis will be similar to the previous…
From the bigger picture, price is currently seen holding above a weekly Quasimodo support level at 1074.6, while on the daily timeframe, price is being supported by a long-term daily swap (support) level coming in at 1088.2. Moving down to the 4hr scale, we can still see price hovering just below a 4hr supply area at 1105.6-1099.2, which we believe is a key obstacle to a move towards the 4hr supply area at 1134.5-1128.9 (located around the weekly swap [resistance] level at 1130.1).
Therefore, what we’re ideally looking to see during today’s sessions is a push above the 4hr supply zone at 1105.6-1099.2, since this could give rise to the possibility of a long position on the retest of this area as demand (check blue arrows). Lower timeframe confirmation will be needed here (at least for us) since one can never be sure how stable the zone is or how deep price will fakeout.
Levels to watch/ live orders:
- Buys: Watch for 1105.6-1099.2 to be consumed and then look to enter long on any retest seen (confirmation required).
- Sells:Flat (Stop loss: N/A).


