
Key risk events today:
BoJ Outlook Report, Monetary Policy Statement and Press Conference; US Advance GDP q/q; US Advance GDP Price Index q/q; US Unemployment Claims; ECB Main Refinancing Rate, Monetary Policy Statement and Press Conference; US Pending Home Sales m/m.
(Previous analysis as well as outside sources – italics).
EUR/USD:
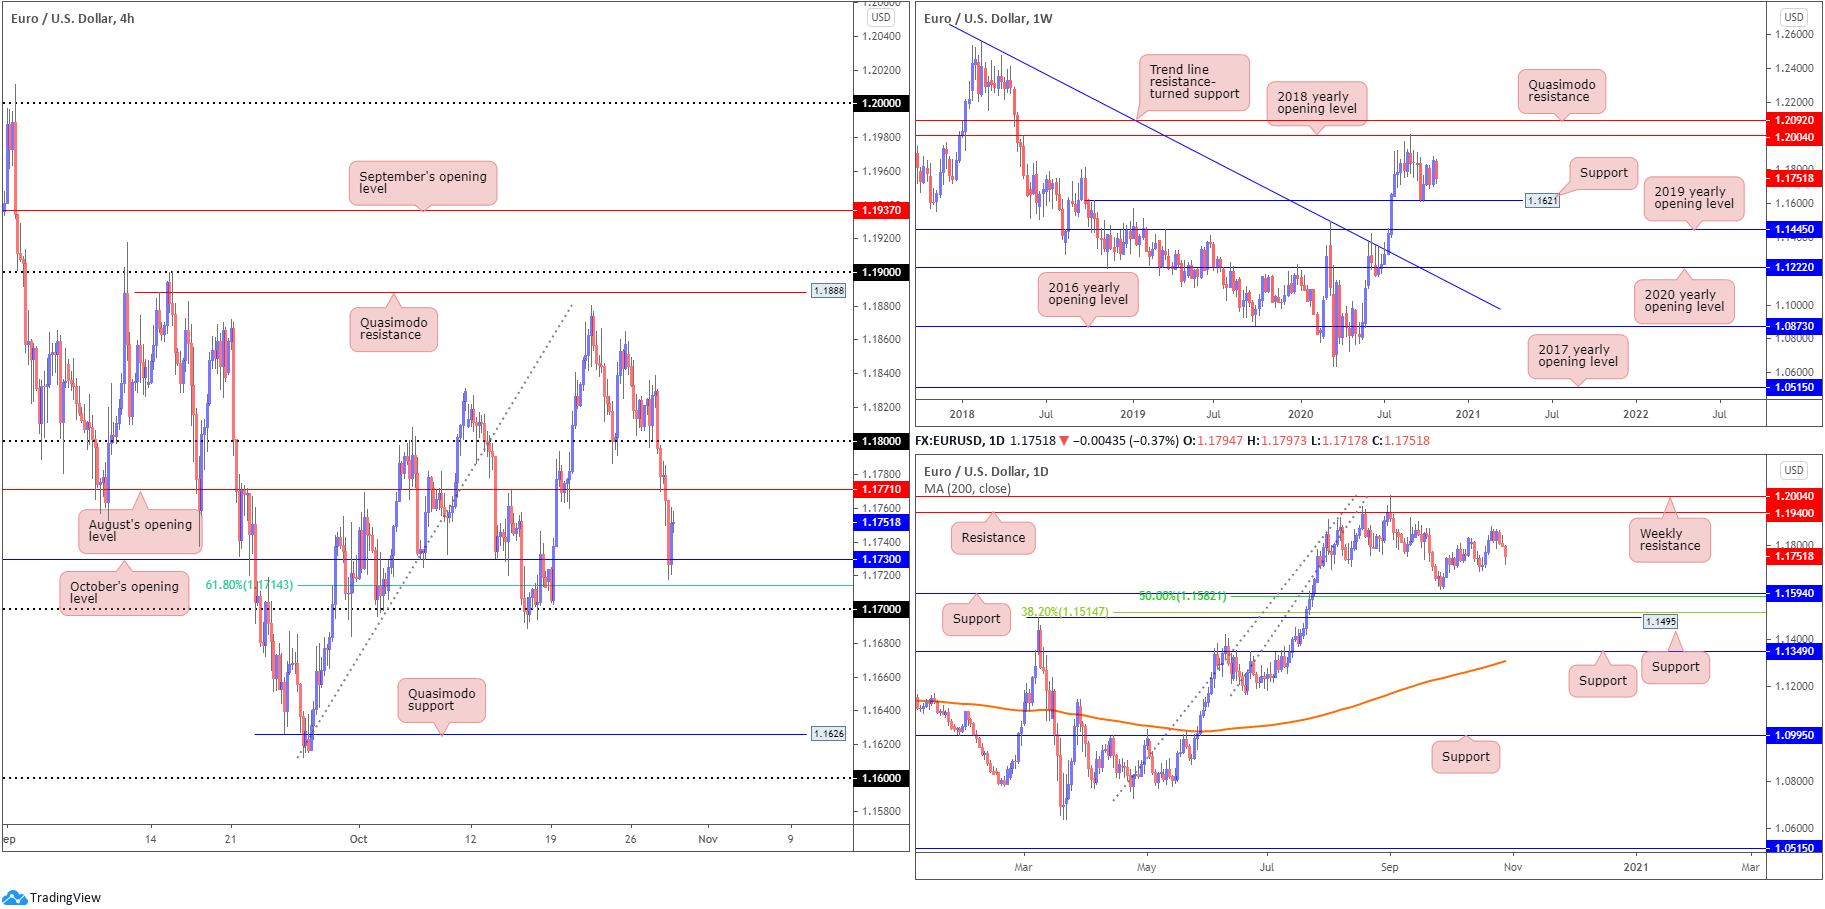
Risk aversion dominated market movement in recent trading, despite the safe-haven buck trading off best levels. EUR/USD sailed through the 1.18 level on the H4 timeframe, with enough force to take on August’s opening value at 1.1771 and test October’s opening value from 1.1730. Traders will also acknowledge a 61.8% Fibonacci retracement ratio at 1.1714 and a 1.17 handle lies beneath here, a level that capped downside on a number of occasions since October.
From the weekly timeframe, in spite of recent selling, we remain holding north of minor support at 1.1621, with the possibility of a run to the 2018 yearly opening value at 1.2004. Also important to consider is we recently unseated trend line resistance (mid-July), taken from the high 1.2555.
The technical position on the daily timeframe also still exhibits scope to explore higher terrain, with little seen in the way of obvious resistance preventing bulls from taking a run at resistance coming in from 1.1940. It is also worth acknowledging this base is sited just under weekly resistance mentioned above at 1.2004.
Areas of consideration:
- 17 on the H4, along with the 61.8% Fibonacci retracement ratio at 1.1714, is a particularly interesting support. Conservative buyers, however, knowing round numbers are prone to fakeouts, may opt to wait for additional candlestick confirmation before committing.
- Breaking through 1.17, on the other hand, could spark bearish scenarios towards H4 Quasimodo support at 1.1626.
GBP/USD:
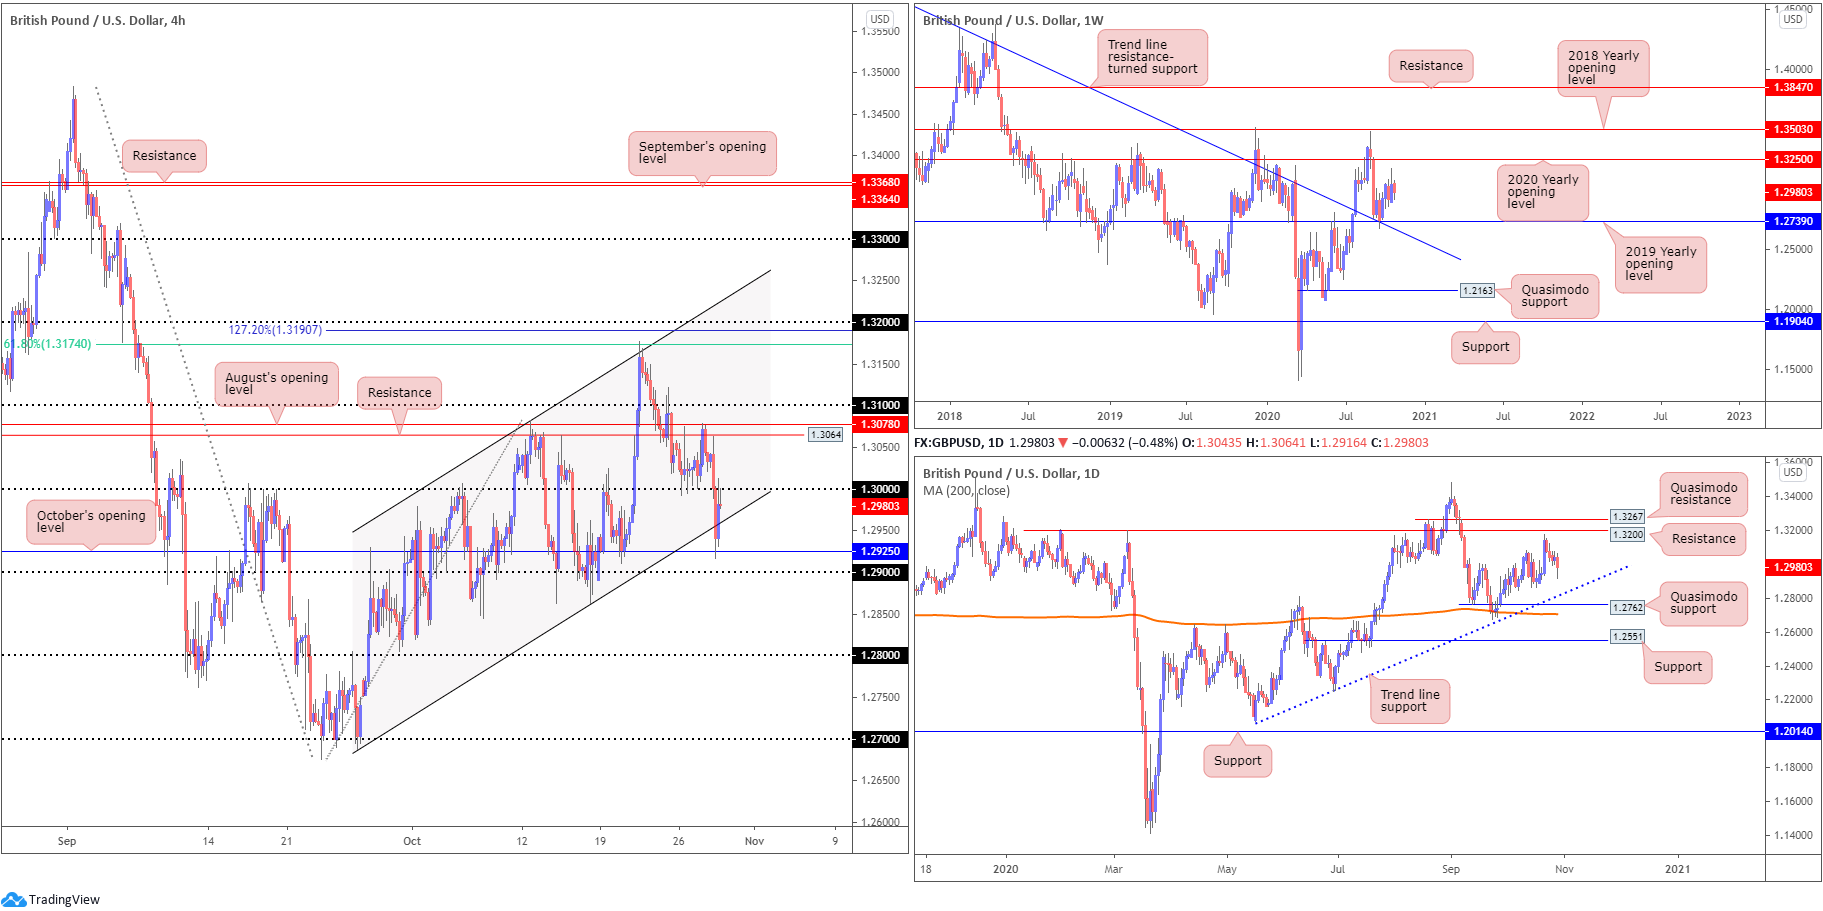
Cable, as you can see, swarmed the key figure 1.30 on Wednesday and whipsawed through channel support (taken from the low 1.2687) to shake hands with October’s opening value at 1.2925. The reaction from the aforementioned supports were enough to trigger a recovery back to the underside of 1.30.
Reclaiming 1.30+ status today could trigger a run to H4 resistance at 1.3064 and August’s opening value priced in at 1.3078. Though, interestingly, under the 1.29 handle we see limited active demand until crossing swords with the 1.28 handle.
From the weekly chart, we can see that following a bout of dip-buying off support at 1.2739 (a 2019 yearly opening value blending with trend line resistance-turned support, extended from the high 1.5930), weekly candles now target the 2020 yearly opening value at 1.3250. Should 1.2739 fail, nonetheless, the 1.2251 low (June 29) is in sight, shadowed by Quasimodo support from 1.2163. It is also worth pointing out the aforementioned trend line was engulfed in late July this year, announcing an uptrend could be on the cards.
Price action on the daily timeframe smothered Tuesday’s attempt at recovery on Wednesday, spiking to lows at 1.2916. Areas to be aware of on this chart are resistance from 1.3200, a level pinned just south of Quasimodo resistance at 1.3267. To the downside, trend line support, extended from the low 1.2075, is seen, followed by Quasimodo support at 1.2762.
Areas of consideration:
- The 1.30 handle could continue to forge resistance on the H4 chart today and eventually convince sellers to push for lower levels.
- Bearish scenarios forming under 1.29 remain a possibility owing to the lack of demand to the left of price until reaching 1.28.
- 31/1.3064 echoes strong resistance on the H4.
AUD/USD:
For those who read Wednesday’s technical briefing you may recall the piece underlined the following (italics):
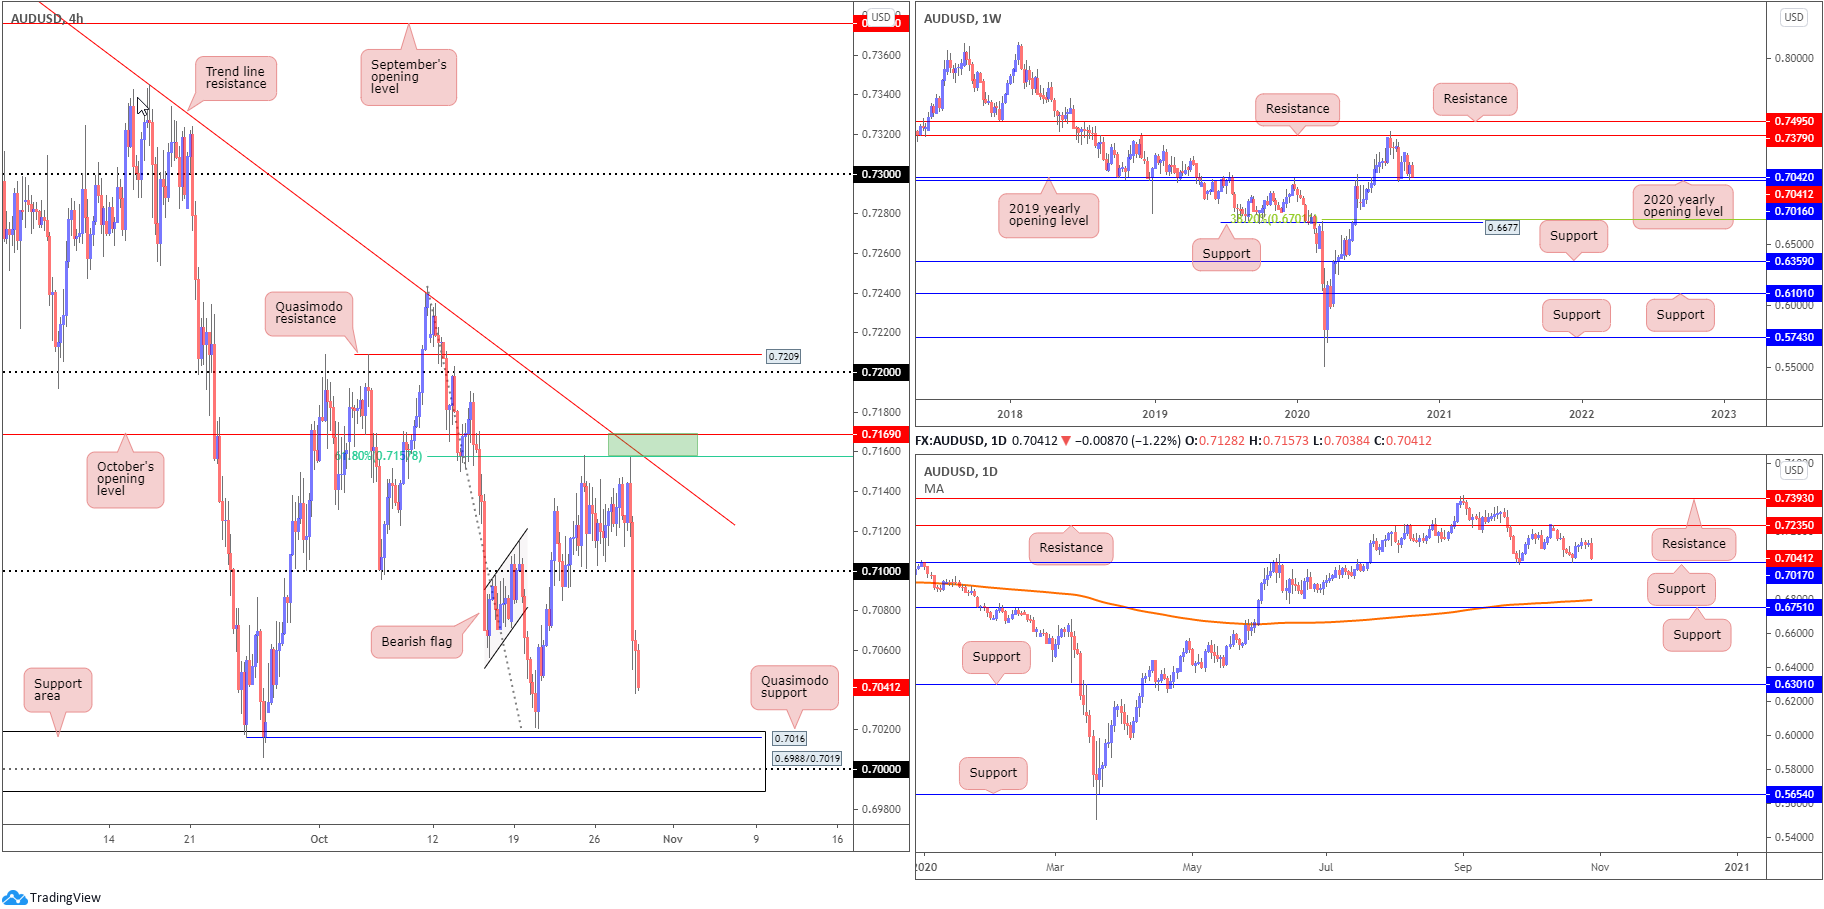
While north is likely to be the favoured direction, traders could still witness an intraday response from H4 trend line resistance (0.7413), due to 61.8% Fibonacci at 0.7157 and 0.7169 resistance convergence (green).
Granted, we did not imagine selling from 0.7169/0.7157 to be quite so dominant. Downside clearly had a helping hand from the safe-haven greenback catching a bid as risk sentiment suffered considerably on Wednesday. As for the H4 candles, we’re now fast approaching a support area coming in at 0.6988/0.7019, which holds Quasimodo support within at 0.7016 and the key figure 0.70.
From the weekly timeframe, in spite of recent downside, price remains at the 2020 (0.7016) and 2019 (0.7042) yearly opening values, recognised as support on the weekly chart. Resistance at 0.7379 lines up as the next upside hurdle should an advance materialise. Failure to maintain position off 0.7016/0.7042 shifts motivation towards support plotted at 0.6677, and a corresponding 38.2% Fibonacci retracement ratio at 0.6701.
A closer examination of price action on the daily timeframe shows price nearing support at 0.7017, a level with a reasonably interesting history. Breaking through here could refresh a bearish perspective to support at 0.6751 and nearby 200-day SMA (orange – 0.6797).
Areas of consideration:
- Owing to the overall trend in this market facing north right now, producing sizeable gains since early 2020, and the weekly and daily timeframes trading around support, buyers could make an appearance out of the H4 support area from 0.6988/0.7019 today.
The accuracy, completeness and timeliness of the information contained on this site cannot be guaranteed. IC Markets does not warranty, guarantee or make any representations, or assume any liability regarding financial results based on the use of the information in the site.
News, views, opinions, recommendations and other information obtained from sources outside of www.icmarkets.com.au, used in this site are believed to be reliable, but we cannot guarantee their accuracy or completeness. All such information is subject to change at any time without notice. IC Markets assumes no responsibility for the content of any linked site.
The fact that such links may exist does not indicate approval or endorsement of any material contained on any linked site. IC Markets is not liable for any harm caused by the transmission, through accessing the services or information on this site, of a computer virus, or other computer code or programming device that might be used to access, delete, damage, disable, disrupt or otherwise impede in any manner, the operation of the site or of any user’s software, hardware, data or property


