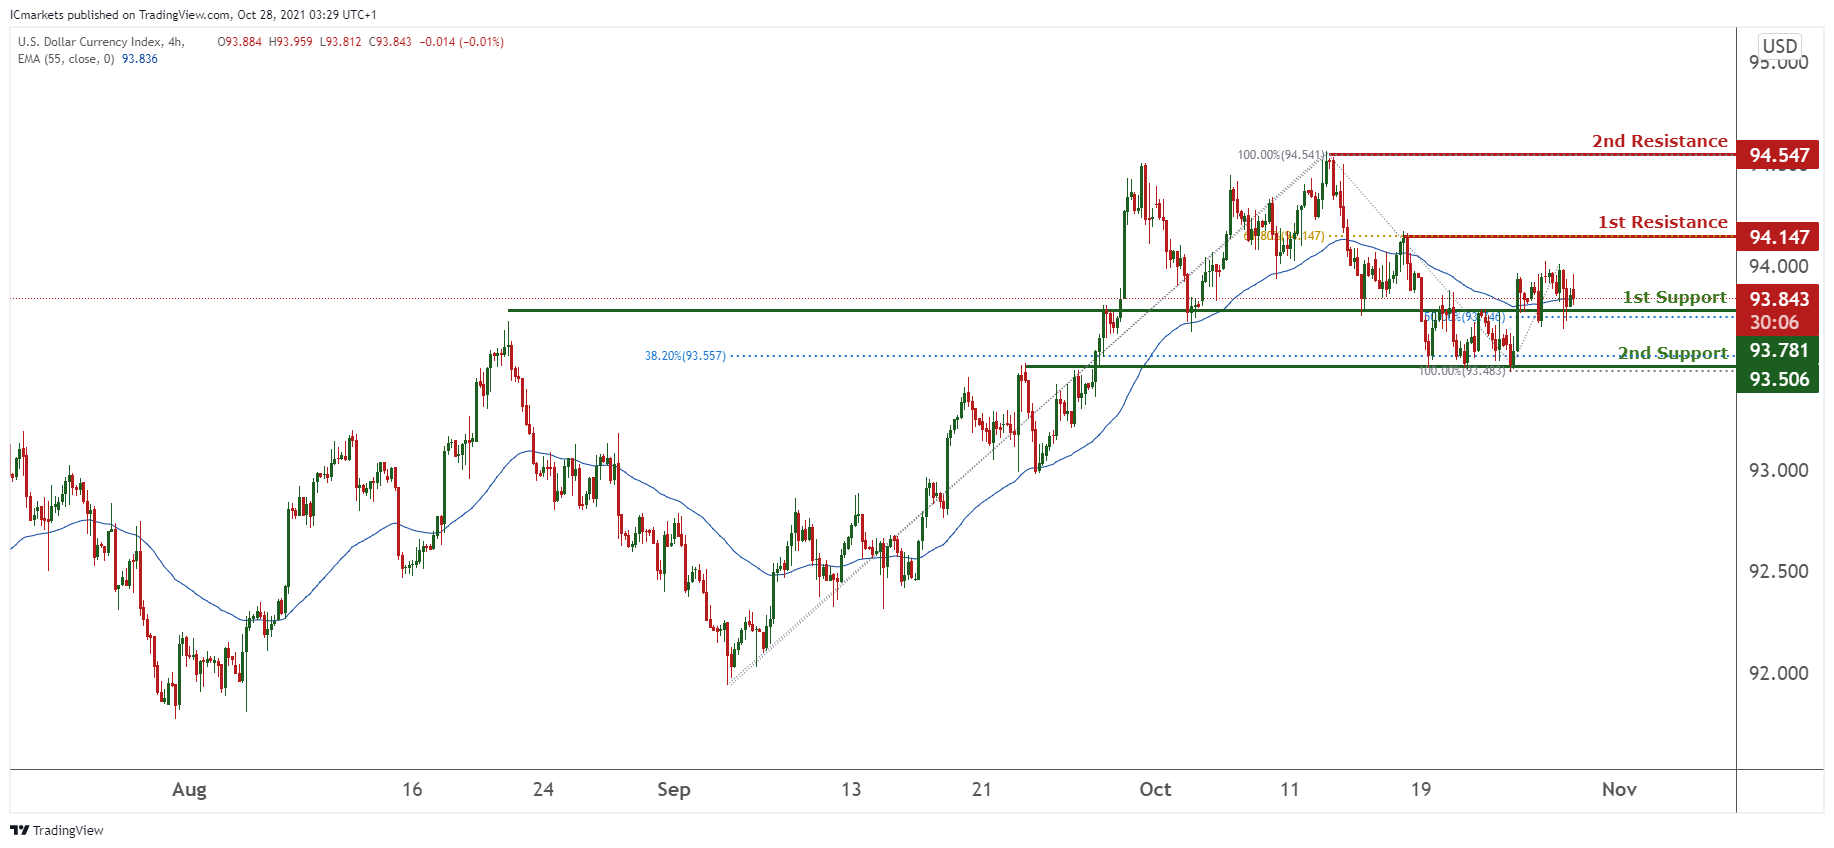
DXY:
On the H4 timeframe, prices are on a bullish momentum. Prices are currently testing our 1st support could potentially climb from our 1st support at 93.781 in line with 50% Fibonacci retracement towards our 1st resistance at 94.147 in line with 100% Fibonacci extension and 61.8% Fibonacci retracement. Technical indicators are showing bullish momentum. Alternatively, breaking our 1st support can find prices dipping towards our 2nd support at 93.506 in line with 38.2% Fibonacci retracement.
Areas of consideration:
- H4 time frame, 1st resistance at 94.147
- H4 time frame, 1st support at 93.843
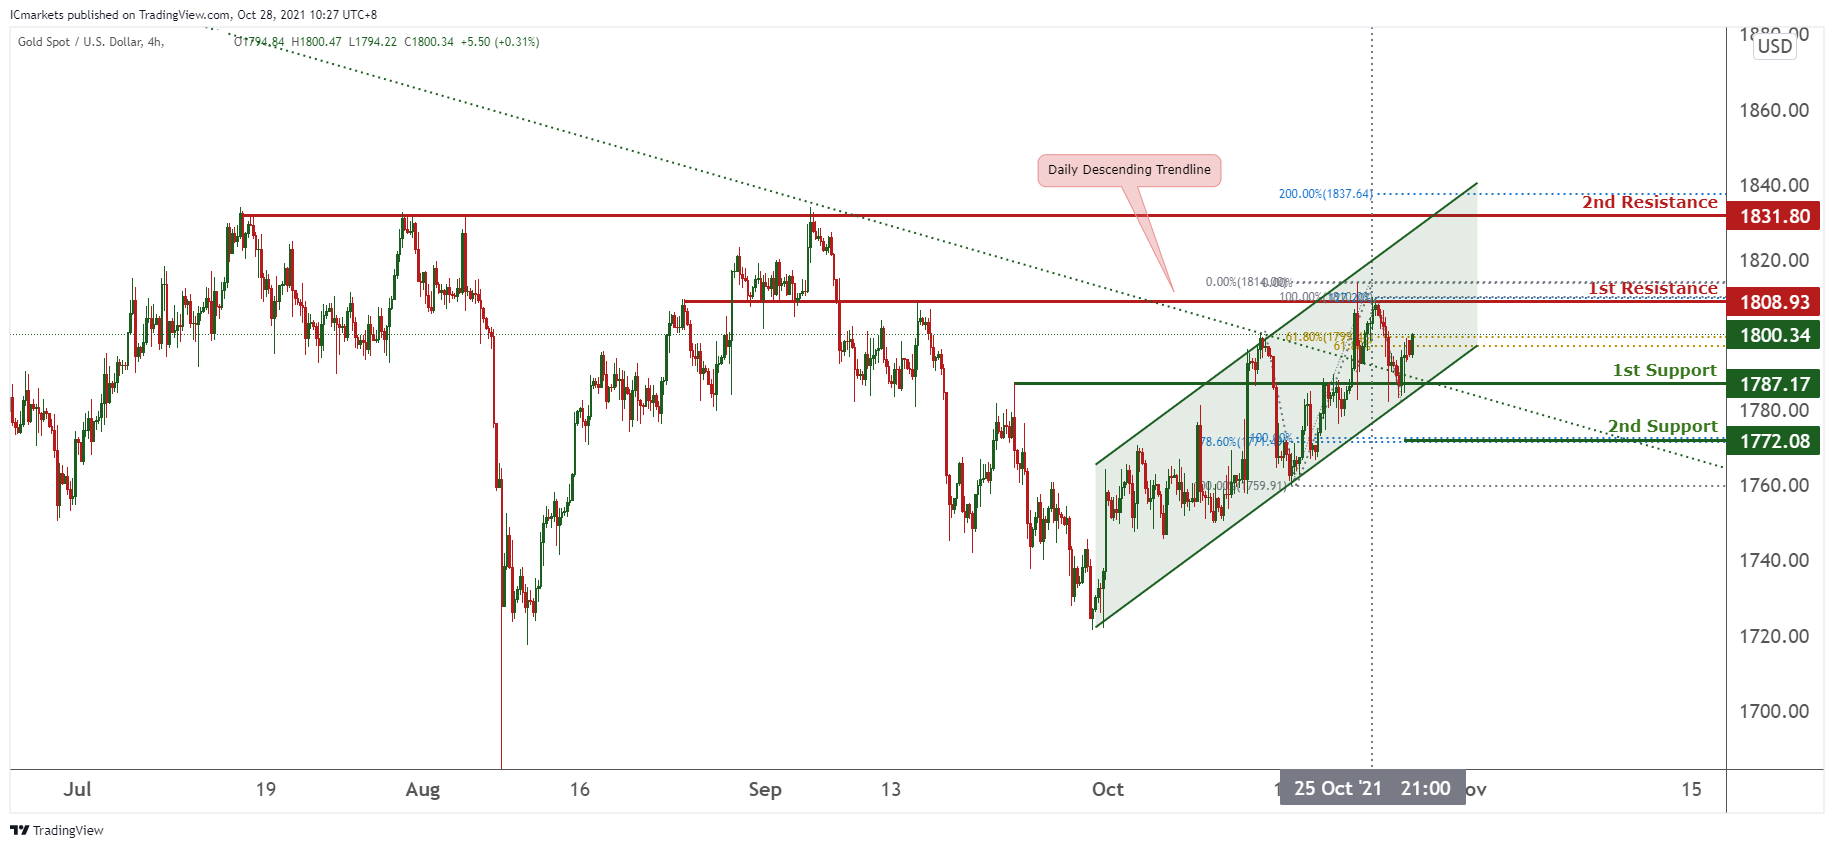
XAU/USD (GOLD):
On the H4 chart, prices are consolidating in a parallel channel and are currently retesting our bearish trendline and bottom of our bearish channel. As technical indicators are showing mixed signals, we will remain neutral for now.
Areas of consideration:
- 4h 1st support at 1787.17
- 4h 1st resistance at 1808.93
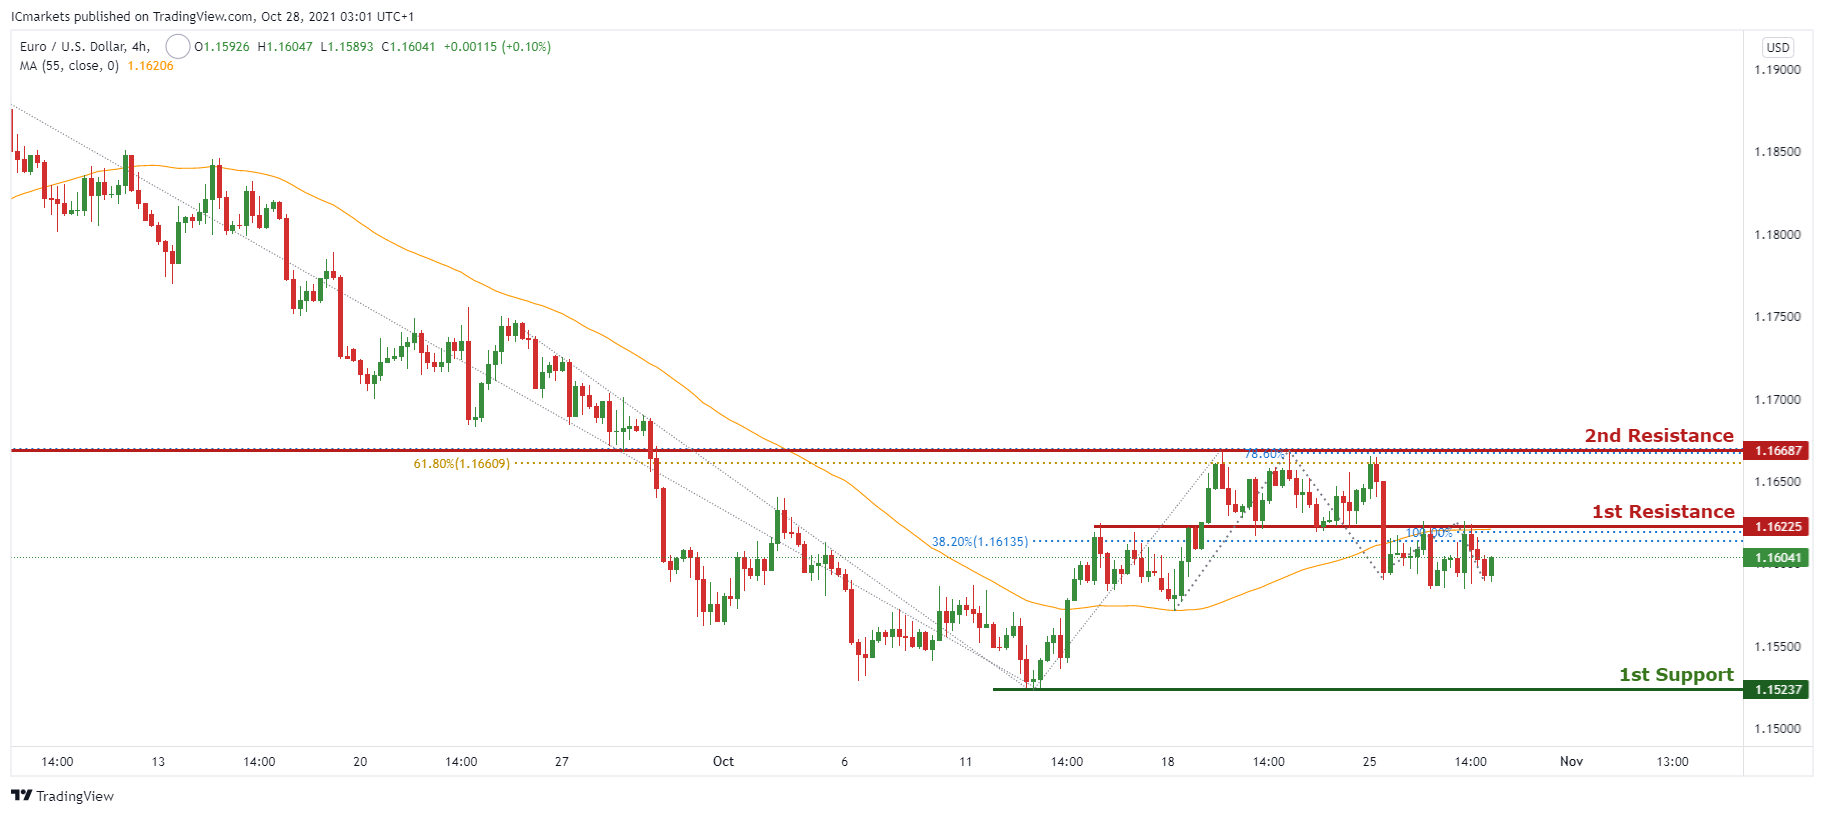
EUR/USD:
On the H4 chart, price has recently reacted off the 1st resistance level of 1.16225 which is 100% Fibonacci projection and 38.2% Fibonacci retracement. Price can potentially dip to the first support level of 1.15237 which is also the graphical swing low level. Alternatively if price were to break the first resistance, price might go to the 2nd resistance of 1.16687 which is 61.8% Fibonacci retracement and 78.6% Fibonacci projection. The bearish bias is supported by the natural moving average as price is trading below it.
Areas of consideration
1st resistance – 1.16225
1st Support 1.15237
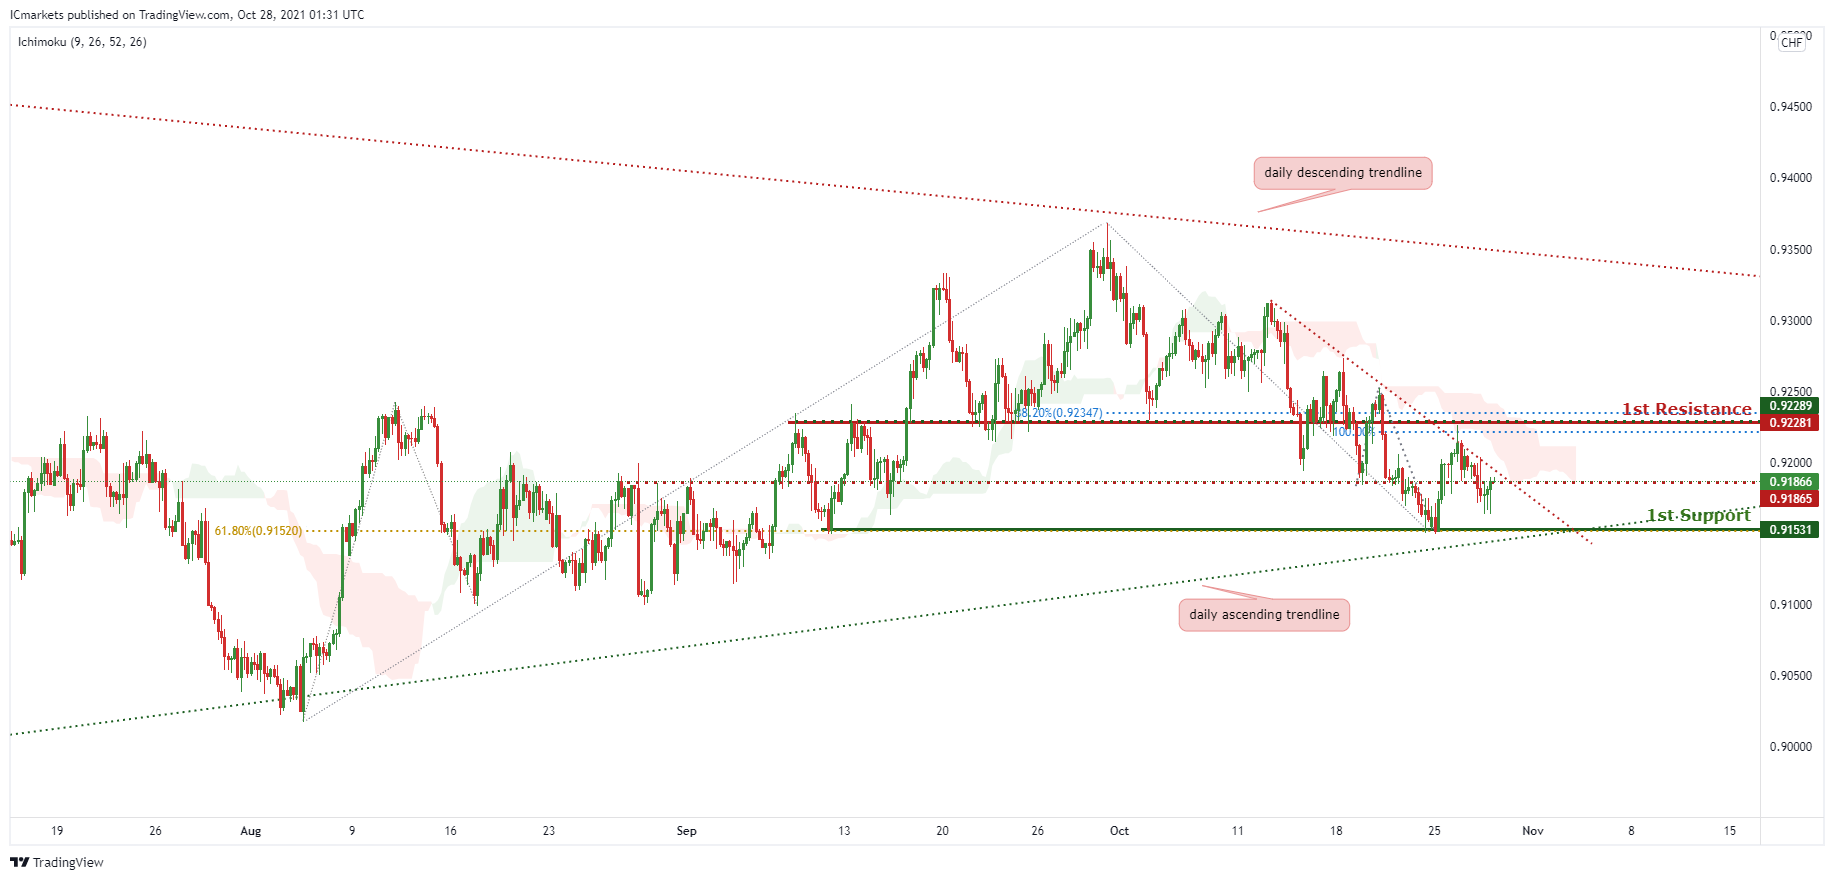
USD/CHF:
On the H4, price is seen to be reacting in a potential triangle. In reference to yesterday’s analysis, price was unable to break past the small descending trendline resistance, hence we can expect price to drop further down to the 1st Support in line with 61.8% Fibonacci retracement and 78.6% Fibonacci retracement.
Areas of consideration:
- Watch 1st Support at 0.91531
- Watch 1st Resistance at 0.92281
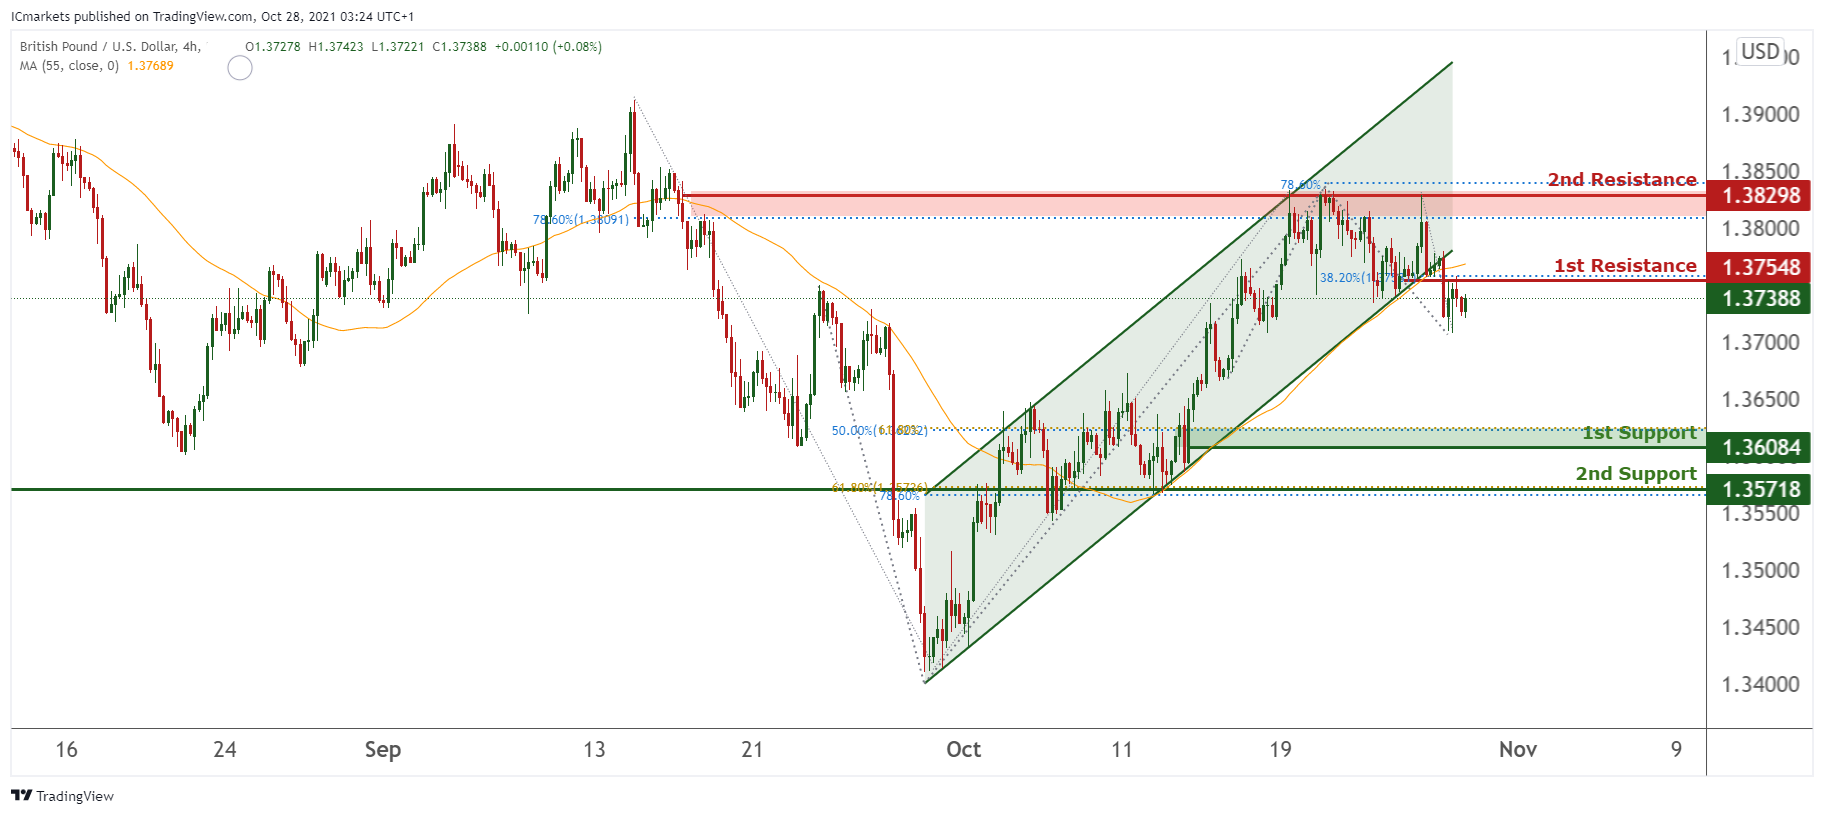
GBP/USD:
Price has recently broken off the channel and reacted off the first resistance level of 1.37548 which is 78.6% Fibonacci retracement and 78.6% Fibonacci projection. It can then potentially dip to the first support level of 1.36084 which is also 50% Fibonacci retracement and 61.8% Fibonacci projection. Our bearish bias is supported by the moving average as price is trading below it.
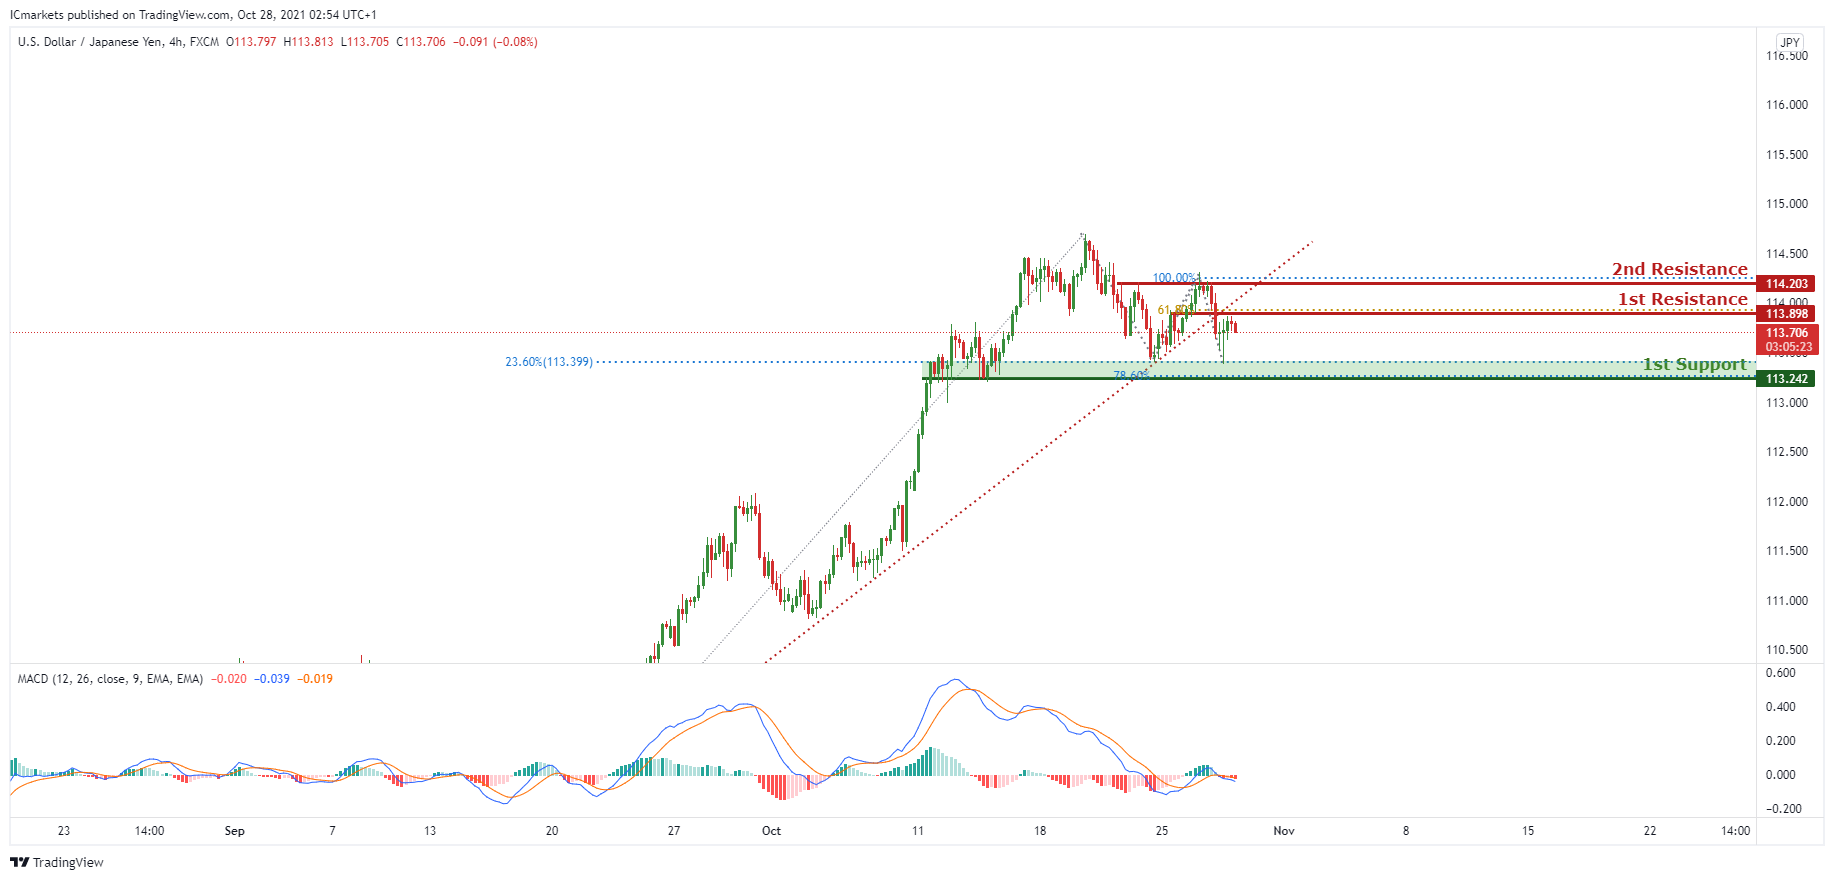
USD/JPY
On the H4 timeframe, price broke out of the ascending trendline support, signifying a bearish momentum. We can expect price to drop from 1st resistance level in line with 61.8% Fibonacci projection towards the 1st support in line with 23.6% Fibonacci Retracement and 78.6% Fibonacci projection. If price pushes further down past 1st support, we can expect price to drop to the 2nd support in line with 38.2% Fibonacci retracement. Our bearish bias is further supported by the MACD indicator where the signal line crossed above the MACD line.
Areas of consideration:
- H4 1st resistance level 113.898
- H4 1st support level 113.242
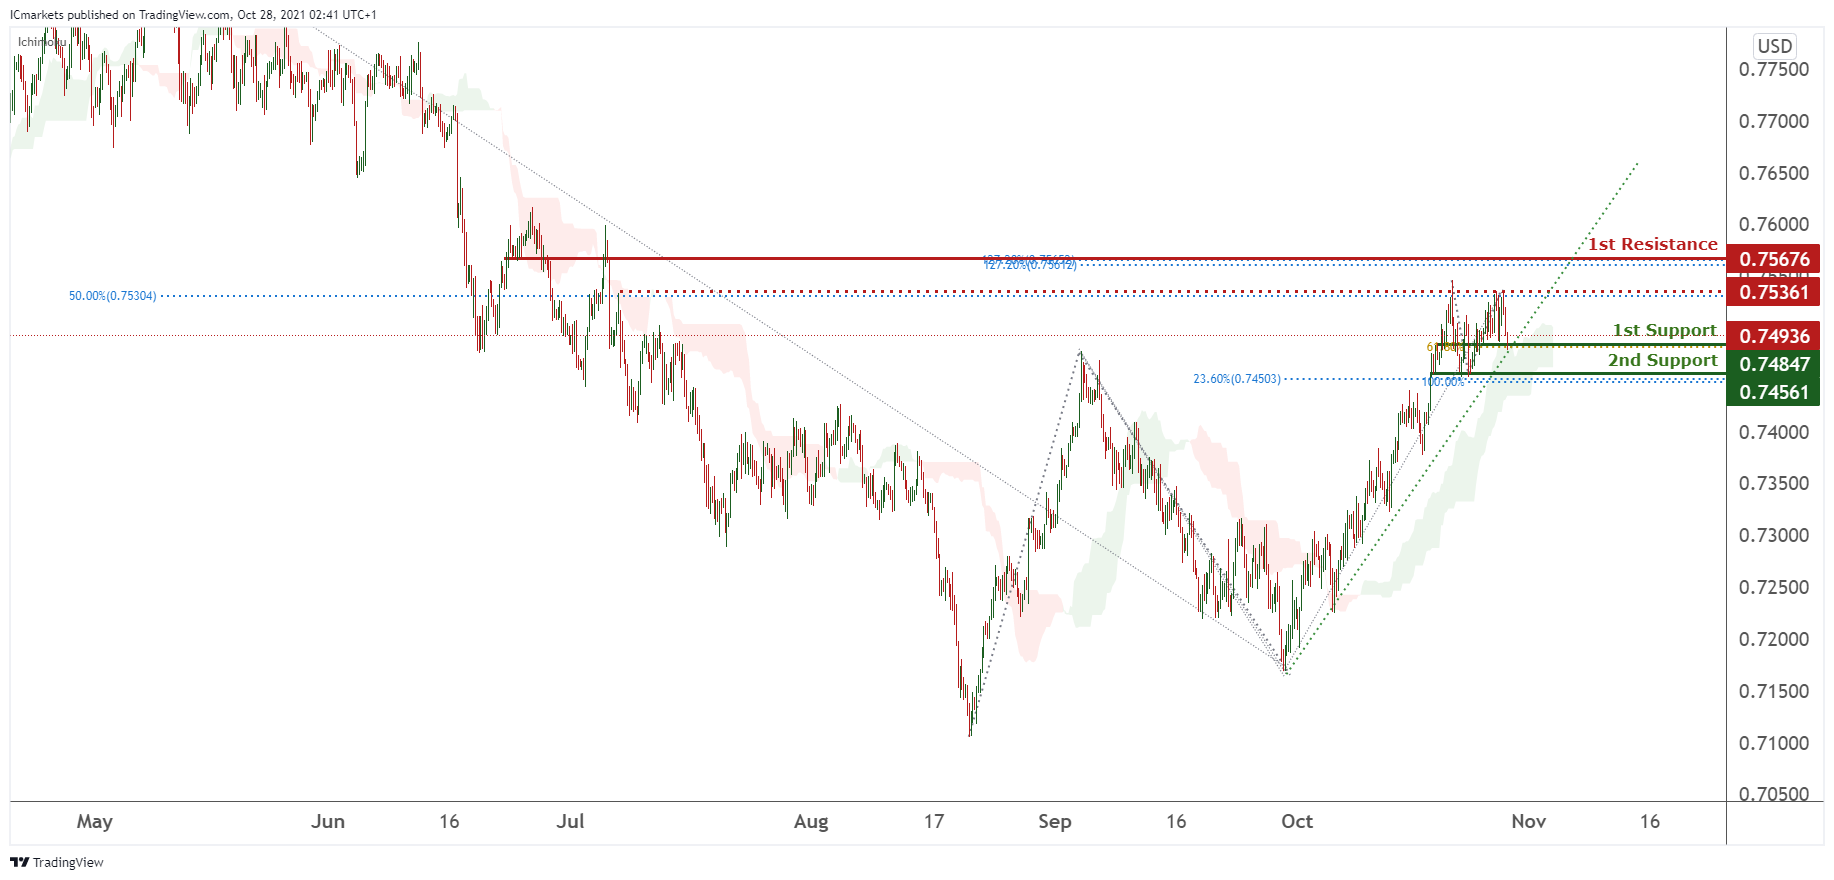
AUD/USD:
On the H4, we can see that price is reacting in between the 1st Resistance and 1st Support. Price is reacting in between 1st Resistance and 1st Support, price failed to push past the intermediate resistance level and dropped back down to the 1st Support. We can expect the price to bounce up from the 1st Support in line with 61.8% Fibonacci projection towards the intermediate resistance level.
Areas of consideration:
- H4 1st resistance level 0.75364
- H4 1st support level 0.74822
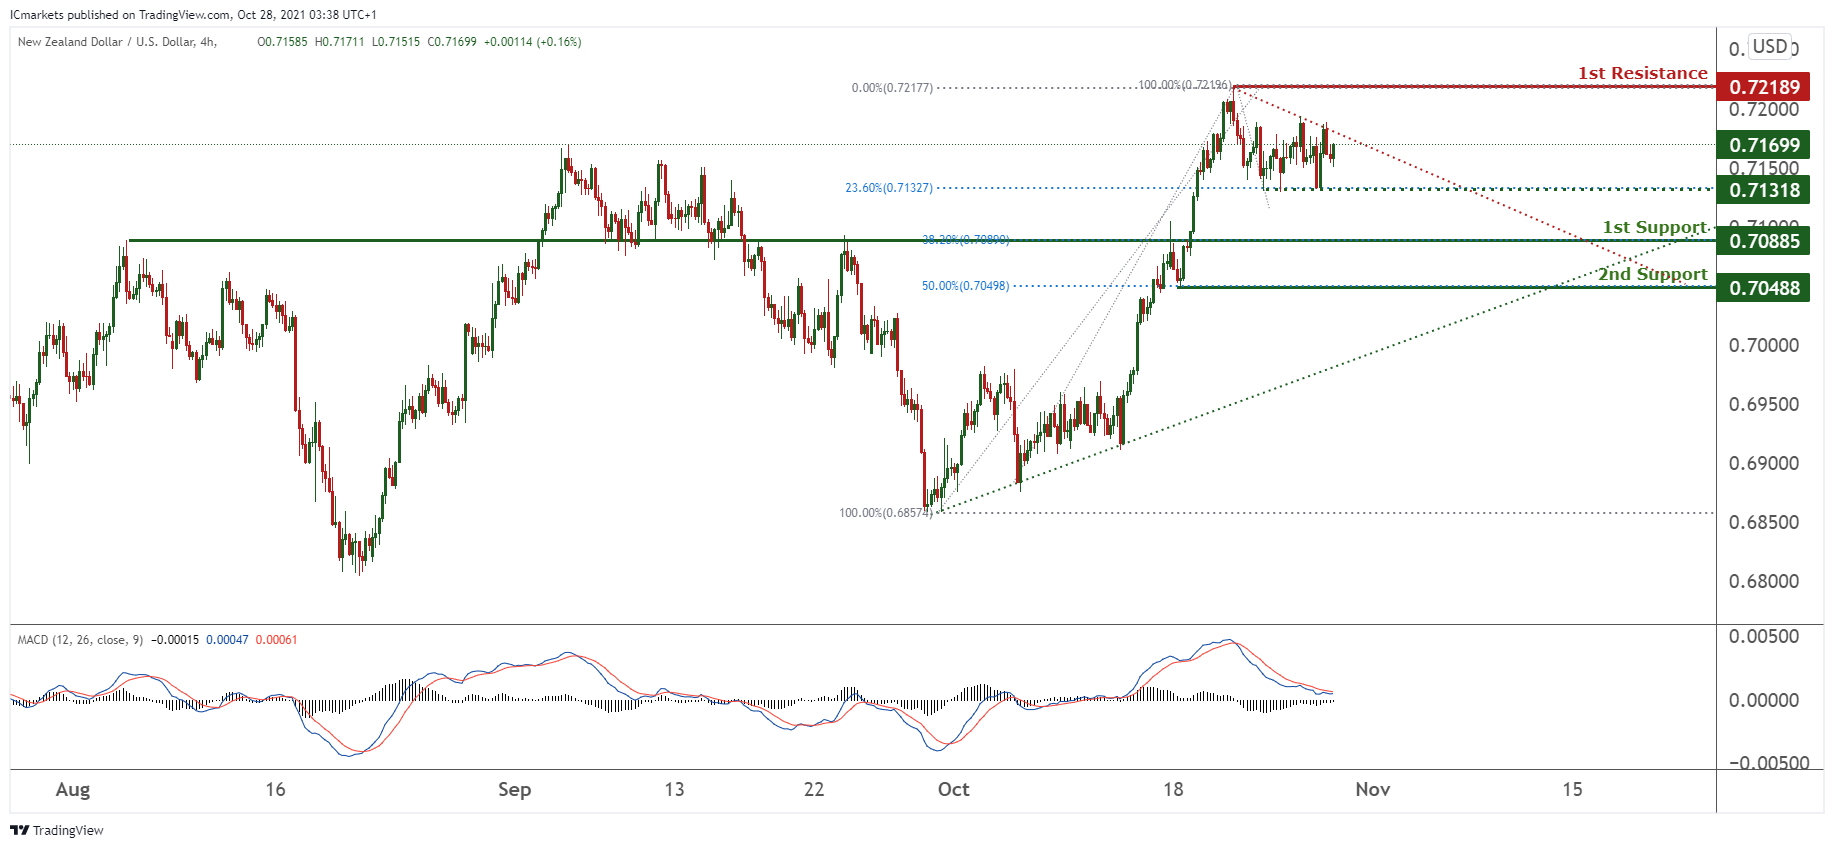
NZD/USD:
On the H4 timeframe, prices are on a bearish momentum. We watch our intermediate support at 0.71318 in line with 23.6% Fibonacci retracement for a confirmation of bias. As technical indicators showing mixed signals, we prefer to remain neutral for now.
Areas of consideration:
- H4 time frame, 1st resistance at 0.72189
- H4 time frame, 1st support at 0.70885
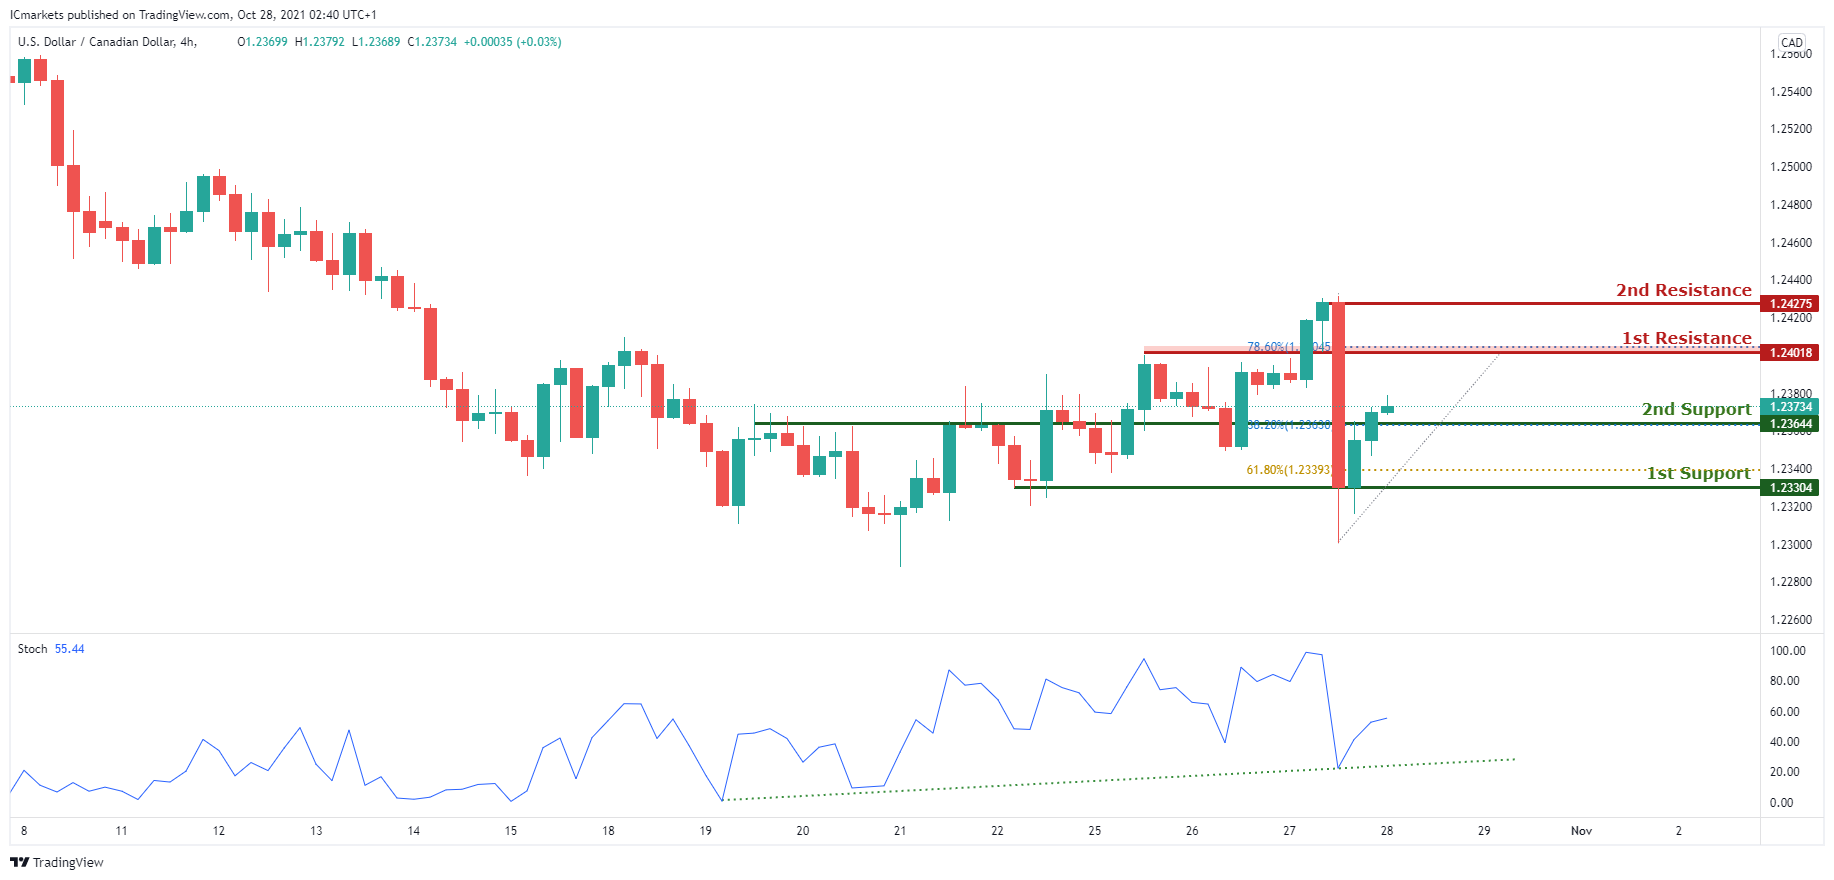
USD/CAD:
On the H4, with stochastics bouncing off support, we are expecting to see price climb to 1st resistance at 1.24018 in line with the 78.6% Fibonacci retracement and graphical overlap resistance from 1st support at 1.23644 in line with the 38.2% Fibonacci retracement and confluent to our graphical overlap support. Price may break 1st resistance and head for 2nd resistance at 1.24275. Alternatively, it may break 1st support and head for 2nd support at 61.8% Fibonacci retracement in line with the graphical swing low support.
Areas of consideration:
- H4 time frame, support at 23644
- H4 time frame, resistance at 24018
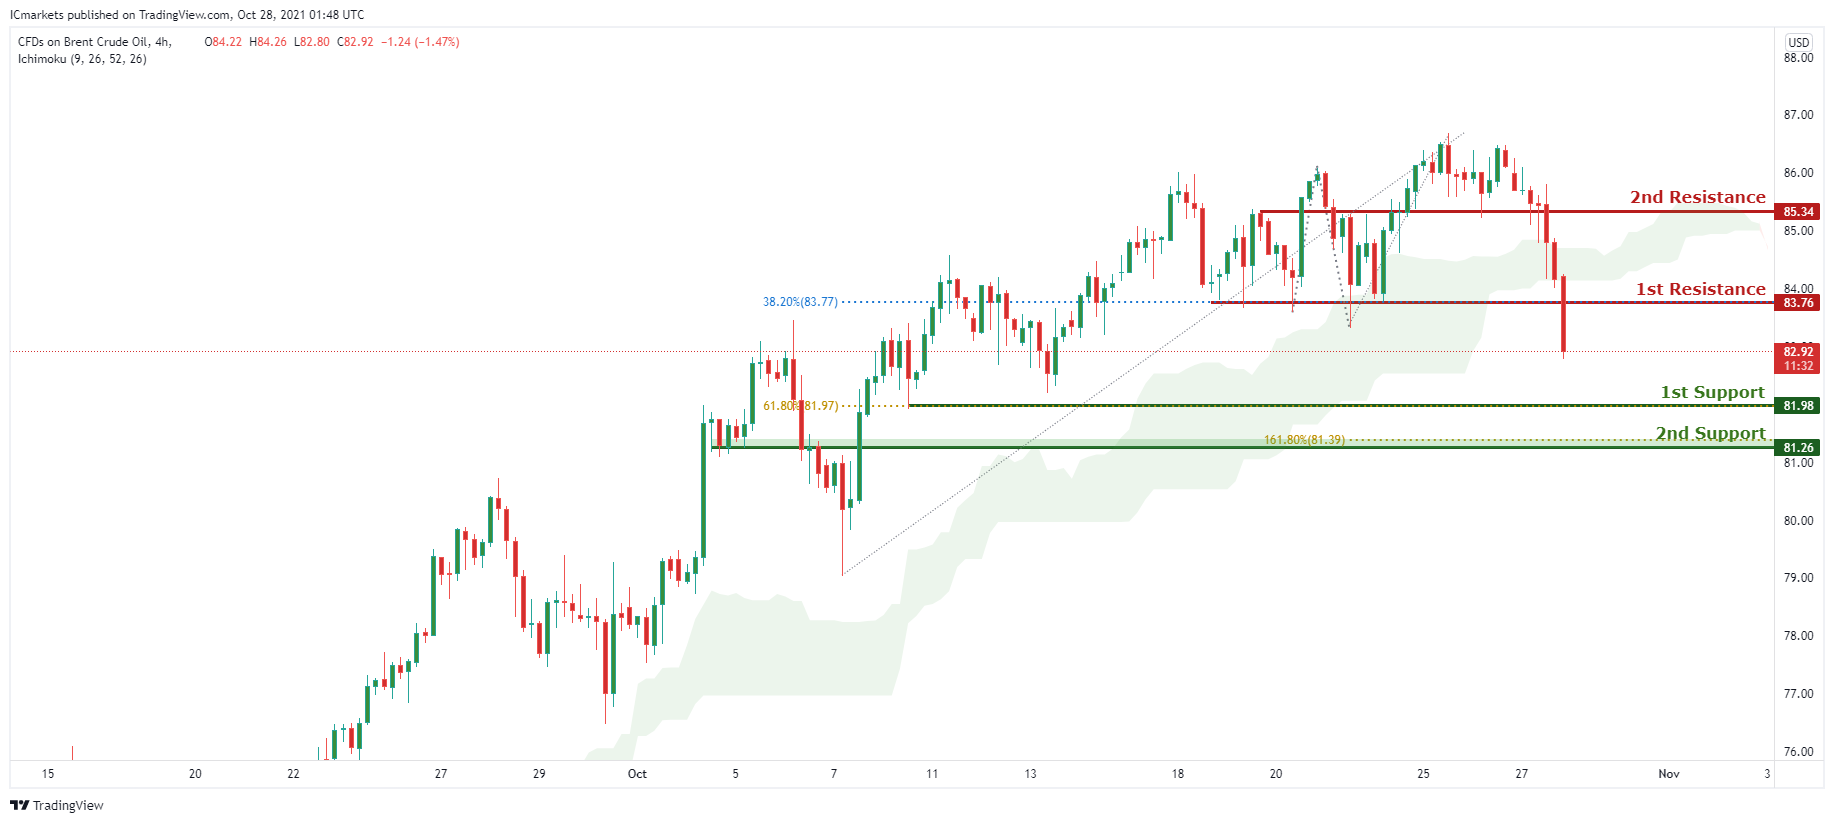
OIL:
On the H4 timeframe,with the ichimoku indicator showing that there was a break in the ichimoku cloud and support, we are expecting to see price fall to 1st support at 81.98 in line with the 61.8% Fibonacci retracement level and graphical swing low support from 1st resistance at 83.76 in line with the graphical overlap resistance. Price may even break 1st support and head for 2nd support at 81.98 in line with the 161.8% Fibonacci extension level and horizontal overlap support. Alternatively, price do a retest at 1st resistance before continuing with the bearish momentum.
Areas of consideration:
- H4 time frame, 1st resistance of 76
- H4 time frame, 1st support of98
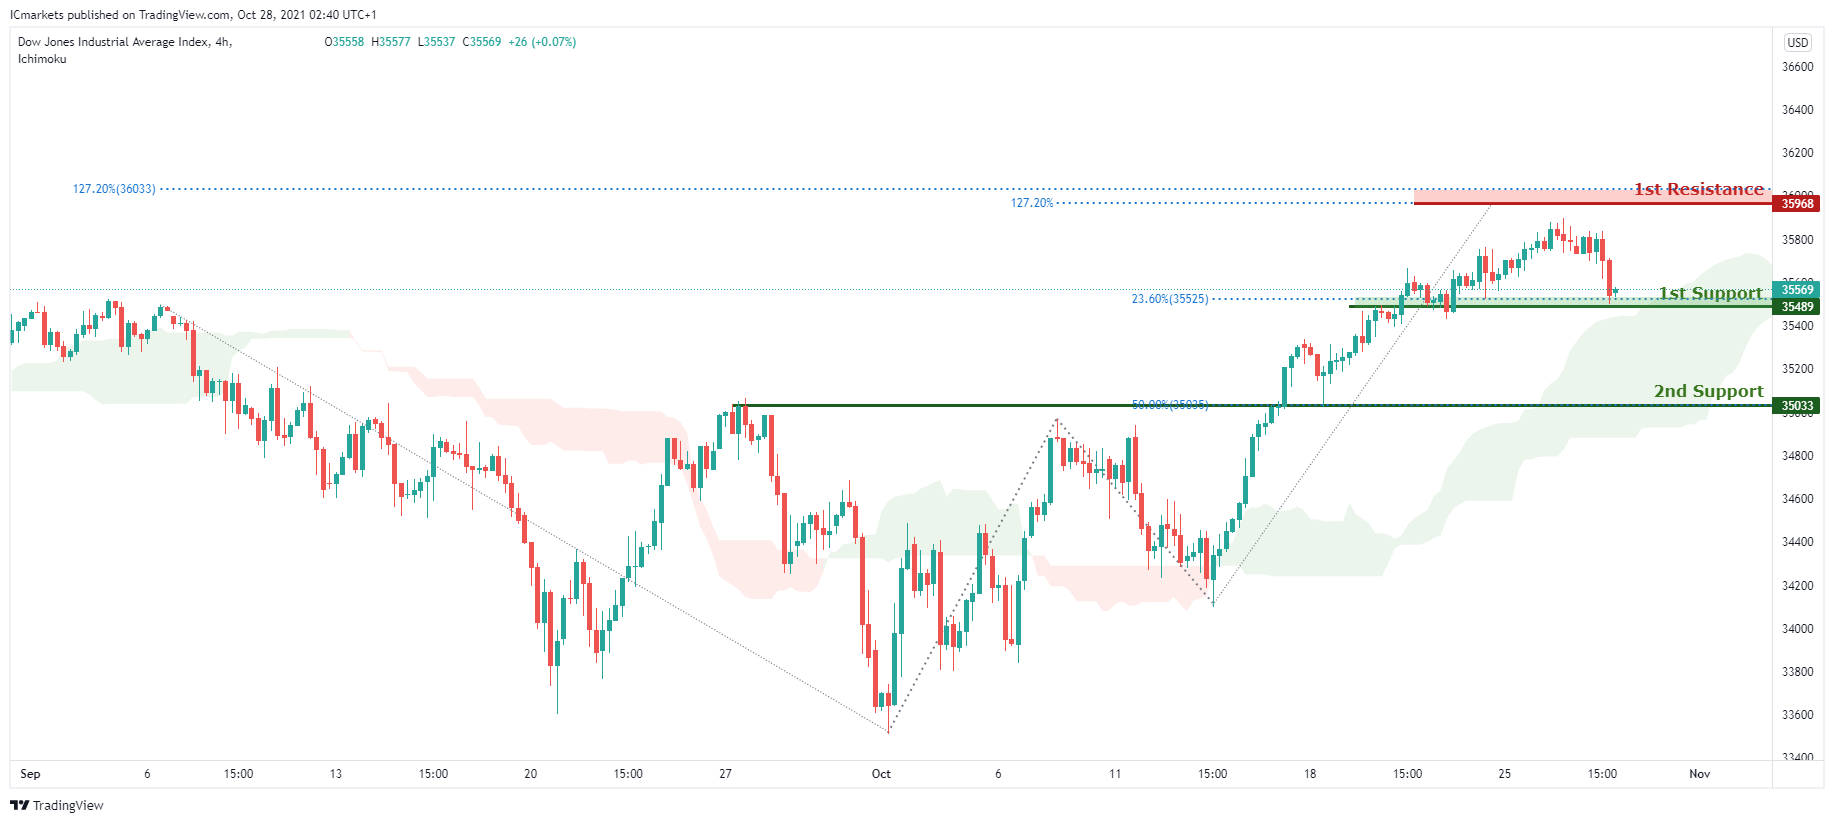
Dow Jones Industrial Average:
On the H4, we are expecting for price to rise to 1st resistance at 35968 in line with two 127.2% Fibonacci extension levels from 1st support at 35489 in line with the 23.6% Fibonacci retracement confluence to the ichimoku indicator where price is moving above the cloud indicating more bullish momentum. Alternatively, we may see price break 1st support and head for 2nd support at 35033 in line with the 50% Fibonacci retracement and graphical swing low.
Areas of consideration:
- 4H resistance at 35968
- 4H support at 35489
The accuracy, completeness and timeliness of the information contained on this site cannot be guaranteed. IC Markets does not warranty, guarantee or make any representations, or assume any liability regarding financial results based on the use of the information in the site.
News, views, opinions, recommendations and other information obtained from sources outside of www.icmarkets.com.au, used in this site are believed to be reliable, but we cannot guarantee their accuracy or completeness. All such information is subject to change at any time without notice. IC Markets assumes no responsibility for the content of any linked site.
The fact that such links may exist does not indicate approval or endorsement of any material contained on any linked site. IC Markets is not liable for any harm caused by the transmission, through accessing the services or information on this site, of a computer virus, or other computer code or programming device that might be used to access, delete, damage, disable, disrupt or otherwise impede in any manner, the operation of the site or of any user’s software, hardware, data or property.