Key risk events today:
US Advance GDP q/q; US Advance GDP Price Index q/q; US Unemployment Claims; US CB Leading Index m/m.
(Previous analysis as well as outside sources – italics).
EUR/USD:
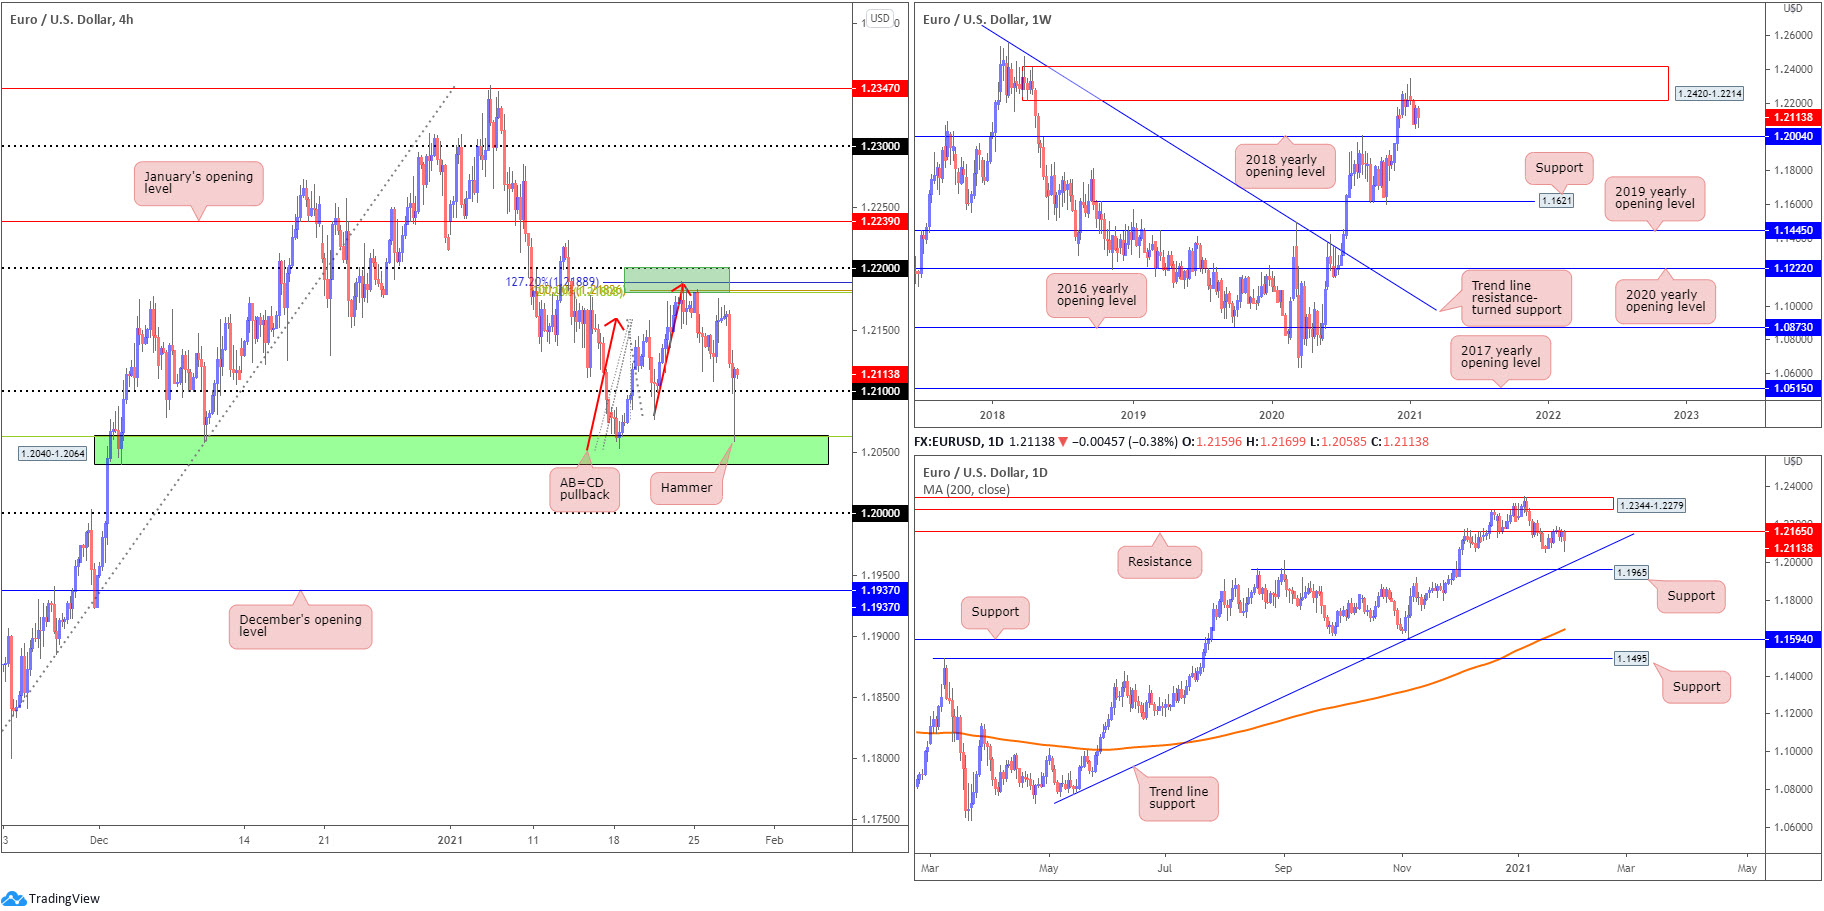
Monday responding from H4 resistance at 1.22-1.2180 (composed of the 1.22 figure, a collection of Fibonacci ratios and an AB=CD bearish formation [red arrows]), along with Wednesday’s stronger USD and dovish ECB commentary, guided price aggressively through the 1.21 figure into the jaws of demand at 1.2040-1.2064 (converging with a 38.2% Fibonacci retracement ratio at 1.2062). Candlestick fans will acknowledge the move established a hammer pattern as EUR/USD reclaimed 1.21+ status. 1.22-1.2180, therefore, is perhaps back on the radar today.
In isolation, the 1.22 figure is also noteworthy resistance on the H4. This is due to the level fixed just south of the lower side of weekly supply at 1.2420-1.2214. So, as noted in Tuesday’s technical briefing, 1.2214-1.22 is an area to be watchful of.
Daily resistance at 1.2165—an active S/R level since June 2010—is a base also in the spotlight. Downside targets on the daily timeframe are seen at trend line support, taken from the low 1.0774, plotted just north of support at 1.1965, a previous Quasimodo resistance level. North of 1.2165, supply drawn from 1.2344-1.2279 (nestled within the walls of weekly supply mentioned above at 1.2420-1.2214) could work its way back in sight.
Areas of consideration:
Technical areas unchanged.
- H4 resistance at 1.22-1.2180.
- The round number and weekly supply combination form possible resistance at 1.22-1.2214.
- Daily resistance at 1.1265.
GBP/USD:
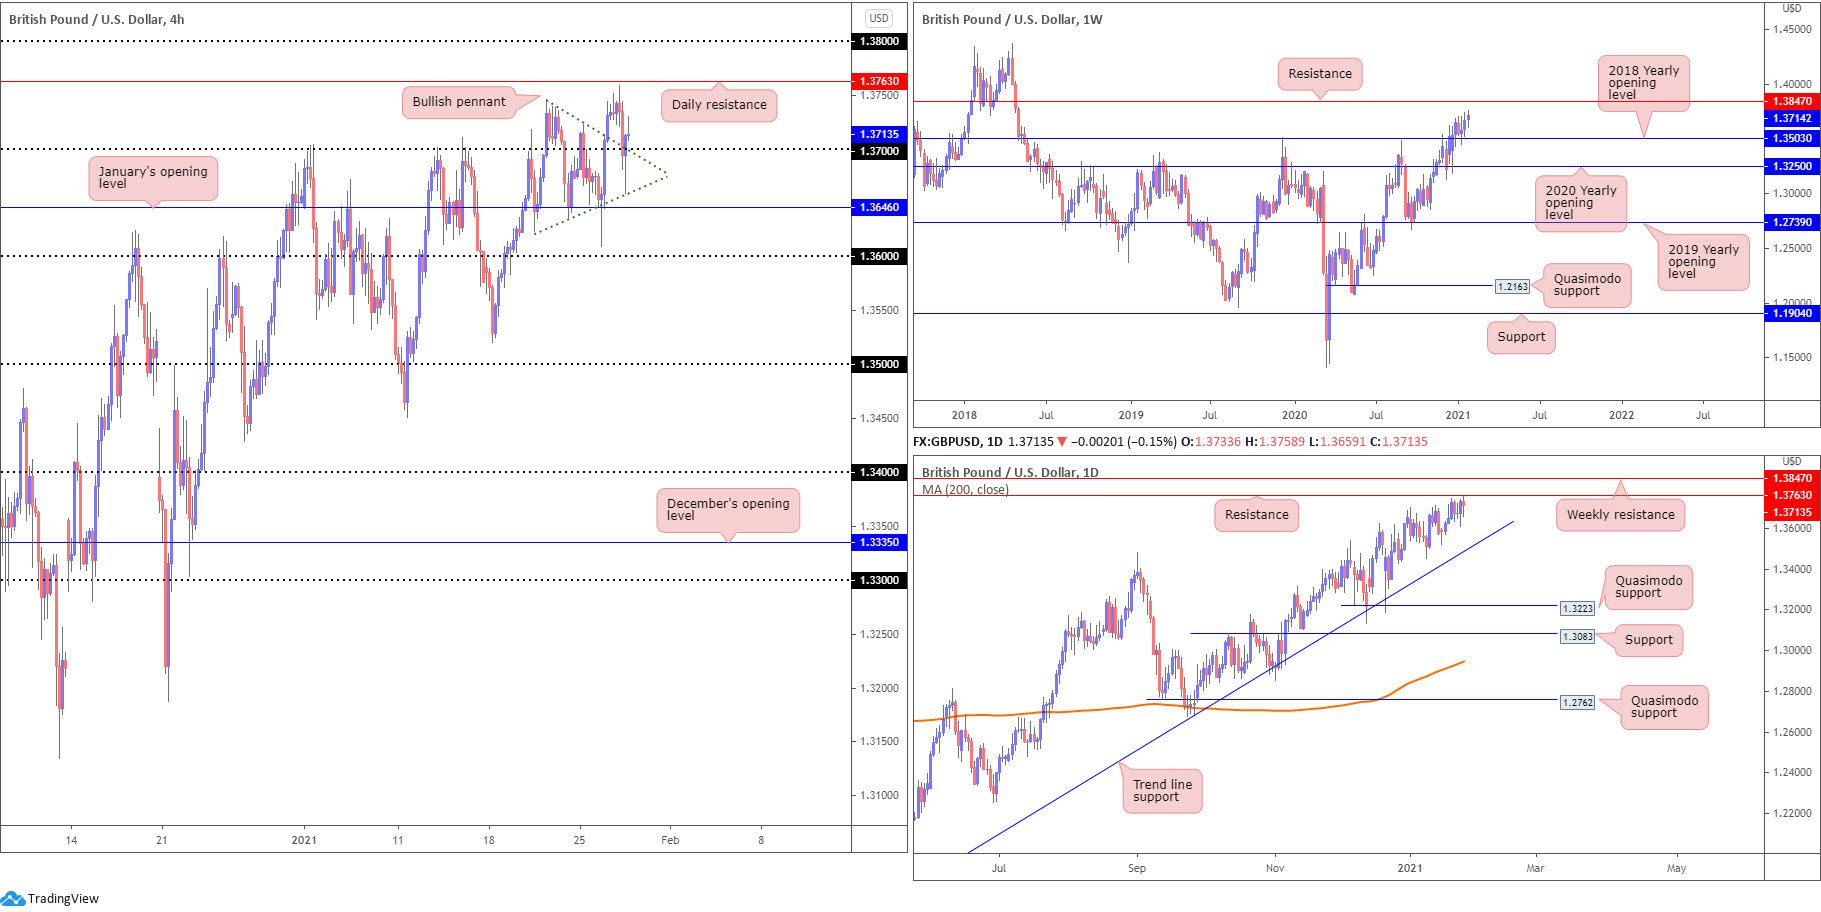
Weekly support at 1.3503 holding (2018 yearly opening value) and price recently registering fresh 2021 highs, in a market trending higher, places long-term buyers in a favourable position. With reference to higher timeframe resistance, the daily chart shows price came within touching distance of 1.3763 on Wednesday, yet a break signals weekly resistance at 1.3847 is likely on the radar.
In partnership with higher timeframes, H4 traders penetrated the upper edge of a bullish pennant pattern on Tuesday (established between the 2021 peak at 1.3745 and a low at 1.3623), with Wednesday violently retesting both the 1.37 figure and the upper side of the pennant formation.
As evident from the H4 timeframe, daily resistance at 1.3763 is the next ceiling on tap.
Areas of consideration:
- The combination of a bullish pennant breakout/retest on the H4, together with the prevailing uptrend and room to reach for at least daily resistance at 1.3763, could see a continuation higher emerge. Beyond 1.3763, the 1.38 figure is in sight on the H4, followed by weekly resistance at 1.3847.
USD/CAD:
Wednesday witnessed the US dollar advance sharply against the Canadian dollar, in line with the US dollar index rallying north of the 90.00 figure.
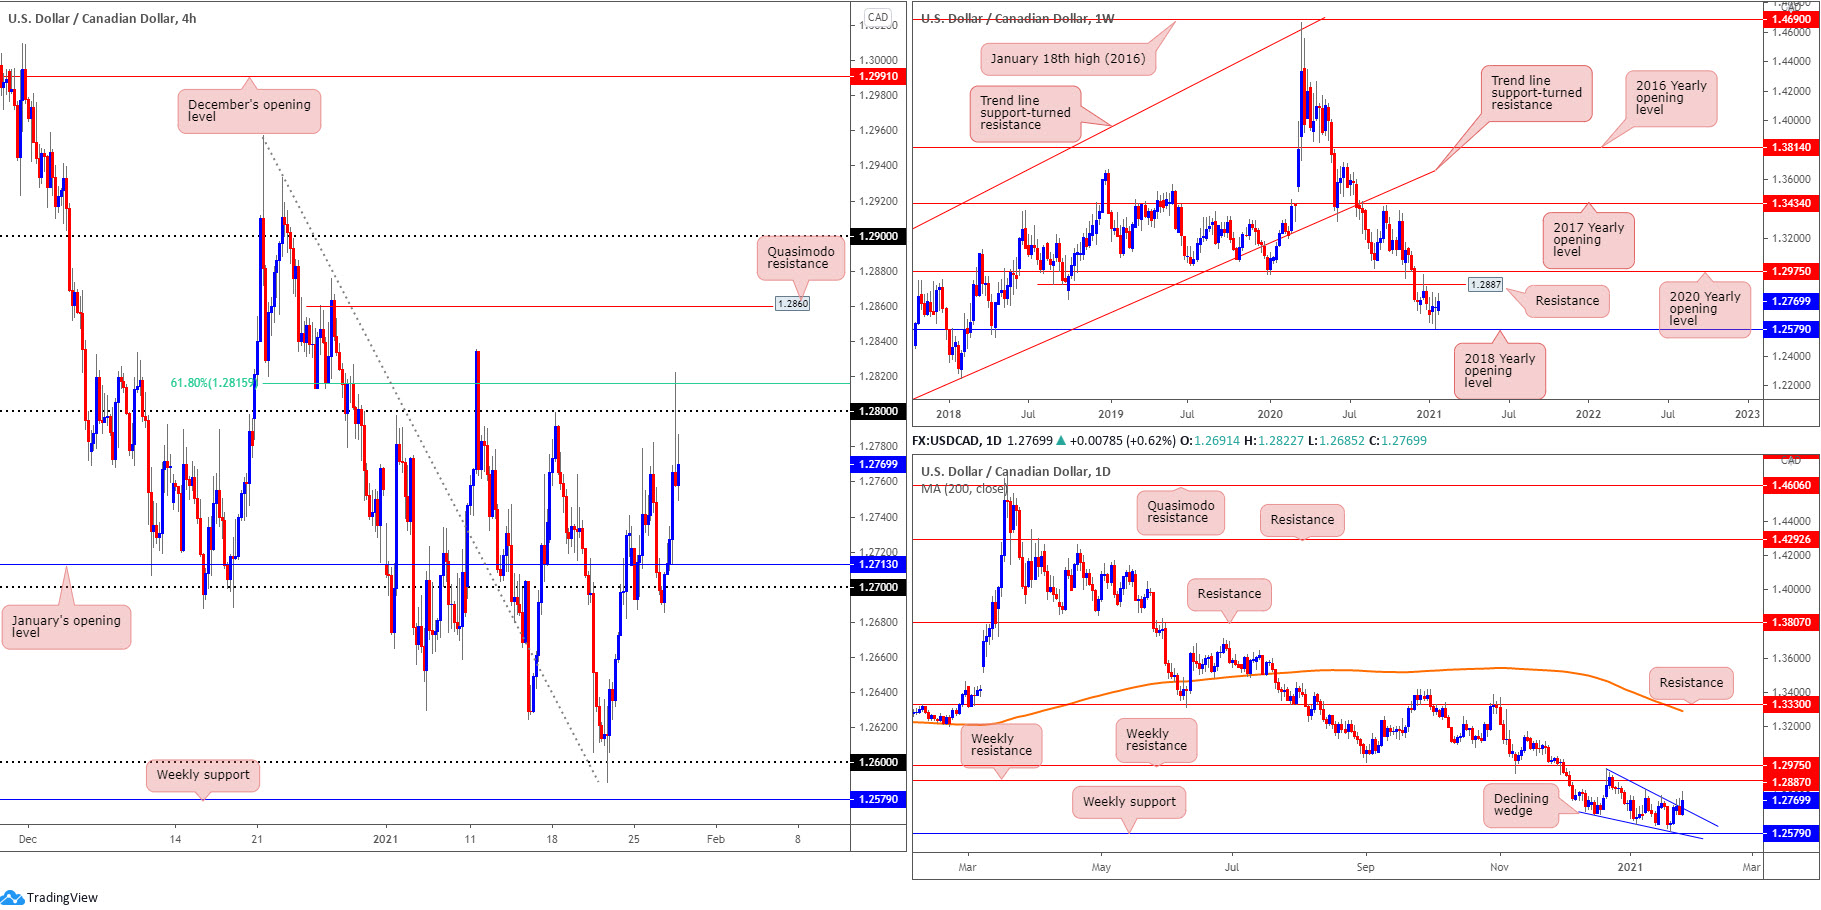
USD/CAD H4 observed candles shake hands with space above 1.28 to connect with a 61.8% Fibonacci retracement ratio at 1.2815, following solid moves from the 1.27 region. North of here, Quasimodo resistance at 1.2860 is seen.
Further out on the weekly timeframe, we can see buyers and sellers battling for position between the 2018 yearly opening value at 1.2579 and resistance at 1.2887 in late December (a previous Quasimodo support level). It is important to note long-term flow (trend) has been pointing lower since topping in March (2020).
On the daily timeframe, the upper edge of the declining wedge (1.2957/1.2688) was penetrated on Wednesday. A breakout higher, according to the pattern’s rules of engagement, is considered a reversal signal, given it forming within a downtrend. This could lead to weekly resistance mentioned above at 1.2887 making an appearance.
Areas of consideration:
- The daily breakout above the daily declining wedge offers a potential bullish scenario, targeting at least weekly resistance at 1.2887.
- On the back of the above point, a H4 close north of 1.28 may unlock an intraday bullish theme that positions Quasimodo resistance at 1.2860 in the firing range.
USD/CHF:
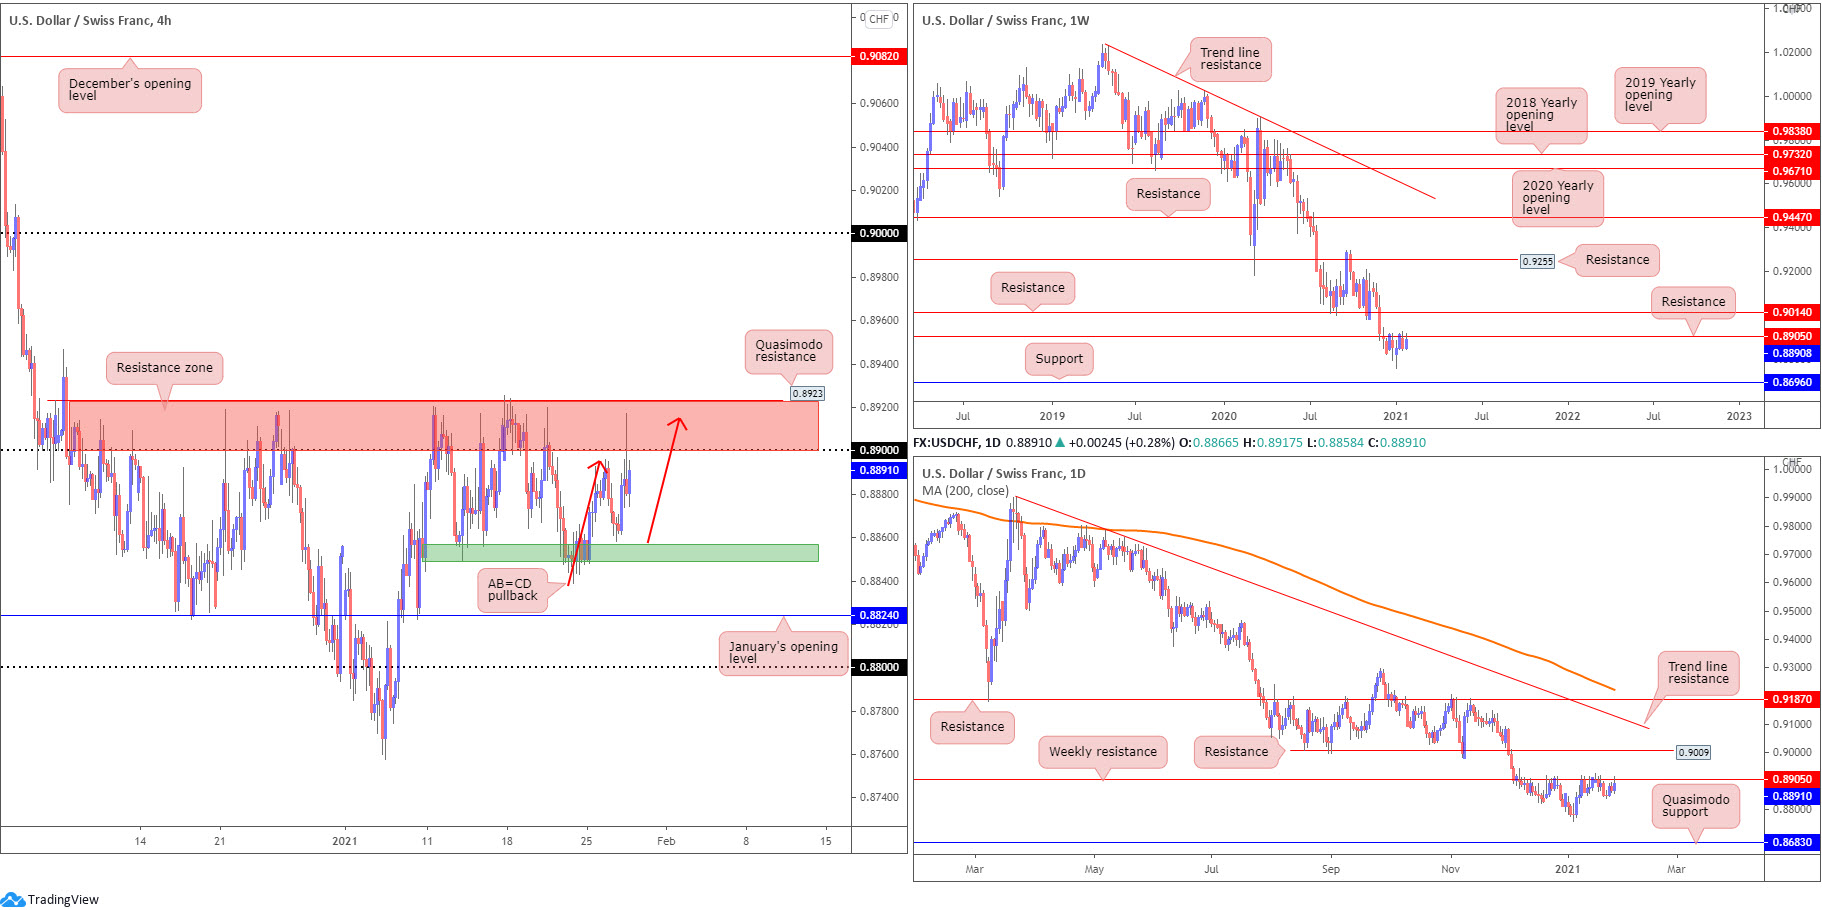
Latest action saw USD/CHF spike into H4 resistance at 0.8923-0.89 (Quasimodo resistance and psychological resistance) and produce an AB=CD pullback (red arrows) at 0.8914. As you can see, price reacted strongly to AB=CD resistance, though buyers remain resilient off 0.8874.
Any sustained buying above 0.8923-0.89 could shine the technical spotlight on the 0.90 figure, a level merging closely with daily resistance 0.9009. Beneath 0.8850, on the other hand, January’s opening value calls for attention at 0.8824, with follow-through selling pointing at the 0.88 figure.
The technical picture from the weekly timeframe reveals the unit has been trending southbound since May 2019, with price action currently retesting the underside of resistance at 0.8905 (converges with the H4 resistance zone mentioned above at 0.8923-0.89).
Areas of consideration:
- Retesting H4 resistance at 0.8923-0.89, in the shape of a H4 AB=CD configuration, is interesting, particularly as the level combines with weekly resistance at 0.8905.
- Should sellers stand aside, nonetheless, breakout bullish themes could develop north of 0.8923 on the H4 scale, targeting the 0.90 neighbourhood.
- Bearish scenarios may form should H4 close south of 0.8850. Although short-term downside targets rest between 0.8824 (January’s opening value) and the 0.88 figure, longer-term targets to be aware of are the multi-month troughs around 0.8757 (formed early January), with further selling to possibly take aim at weekly support drawn from 0.8696 and daily Quasimodo support at 0.8683.
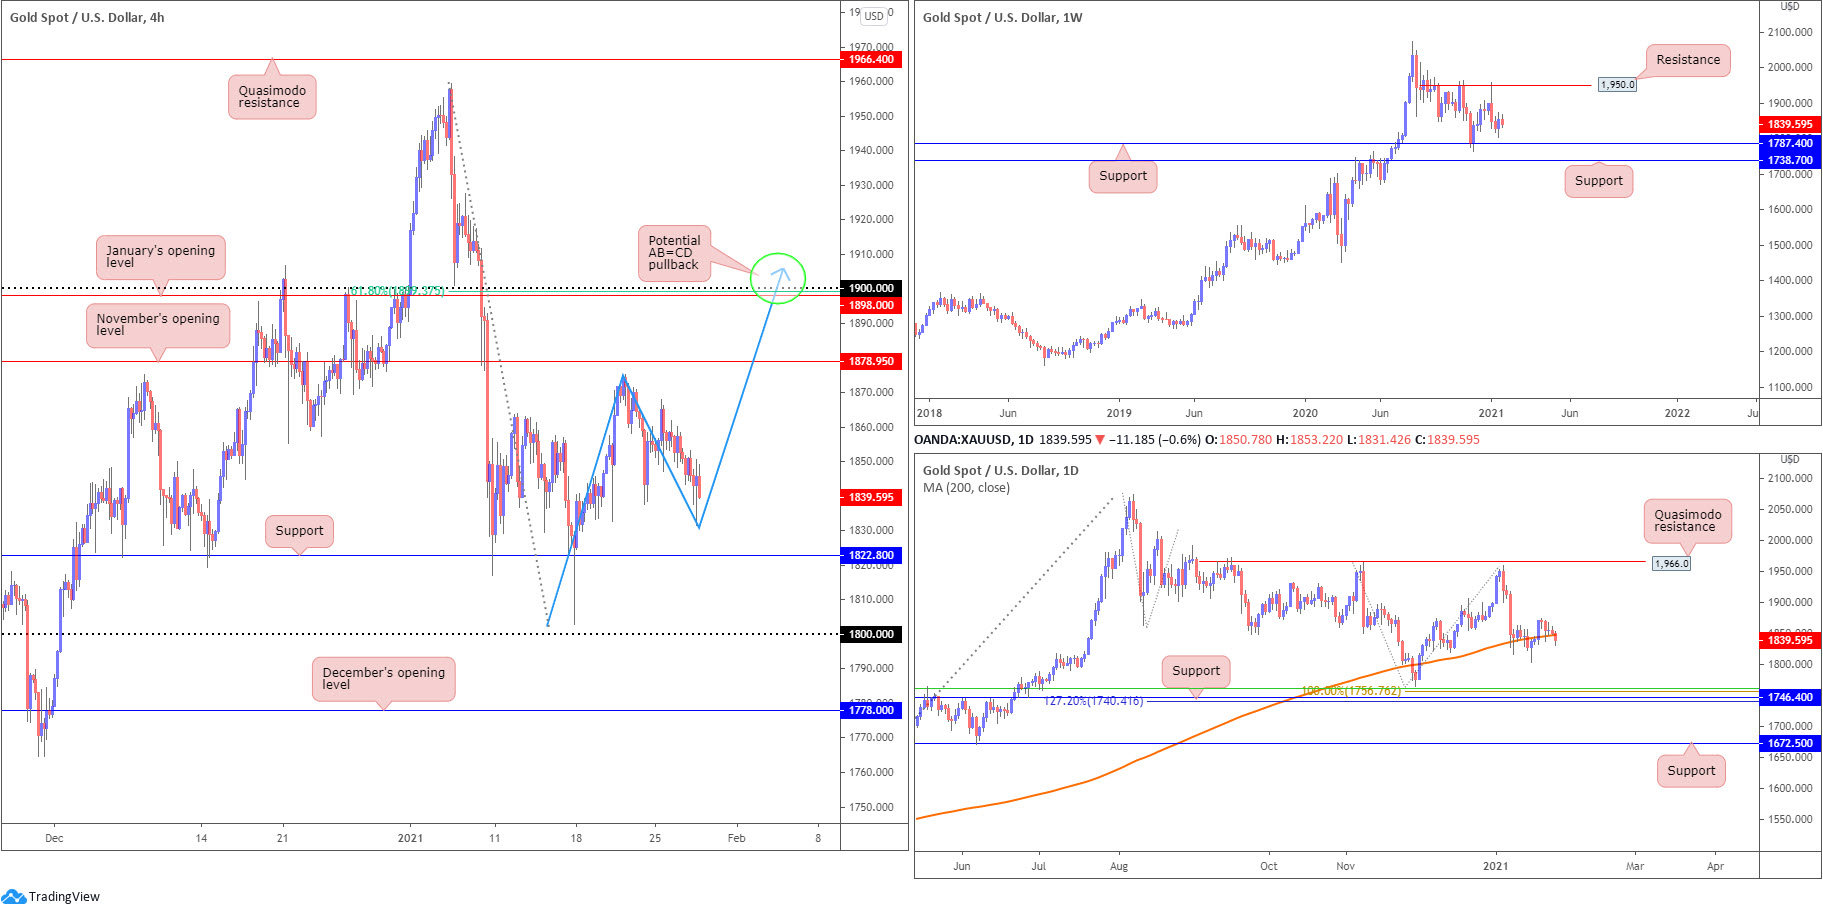
XAU/USD (GOLD):
The US dollar finding a foothold on Wednesday weighed on the precious metal, sending XAU/USD to $1,831.
Last week’s weekly bullish outside reversal candle, as you can see, has failed to provide impetus so far this week. This implies weekly support at $1,787—set north of another support at $1,738—is perhaps to call for attention.
Price action on the daily timeframe modestly slipped through the 200-day SMA (orange – $1,848) yesterday. Any sustained selling south of this dynamic value is likely to be interpreted as a bearish cue. Below the noted SMA, support is arranged around $1,746, sited south of a 100% Fibonacci extension point at $1,756, a 50.0% retracement ratio at $1,762 and above a 127.2% Fibonacci extension point at $1,740.
Across the page on the H4 chart, $1,822 is seen as immediate support, with a break exposing $1,800. To the upside, November’s opening value at $1,878 represents possible resistance, followed by January’s opening value at $1,898, a 61.8% Fibonacci ratio at $1,899, the $1,900 figure and a potential AB=CD pullback (blue arrows) at $1,906.
Areas of consideration:
- The 200-day SMA breach has likely caught the eye of sellers, particularly with room seen on the weekly timeframe to approach support at $1,787.
- H4 support at $1,822 is in view, with November’s opening value at $1,878 seen to the upside.
- H4 AB=CD pullback around $1,900 may interest sellers should November’s opening value at $1,878 step aside.
The accuracy, completeness and timeliness of the information contained on this site cannot be guaranteed. IC Markets does not warranty, guarantee or make any representations, or assume any liability regarding financial results based on the use of the information in the site.
News, views, opinions, recommendations and other information obtained from sources outside of www.icmarkets.com.au, used in this site are believed to be reliable, but we cannot guarantee their accuracy or completeness. All such information is subject to change at any time without notice. IC Markets assumes no responsibility for the content of any linked site.
The fact that such links may exist does not indicate approval or endorsement of any material contained on any linked site. IC Markets is not liable for any harm caused by the transmission, through accessing the services or information on this site, of a computer virus, or other computer code or programming device that might be used to access, delete, damage, disable, disrupt or otherwise impede in any manner, the operation of the site or of any user’s software, hardware, data or property.


