
DXY:
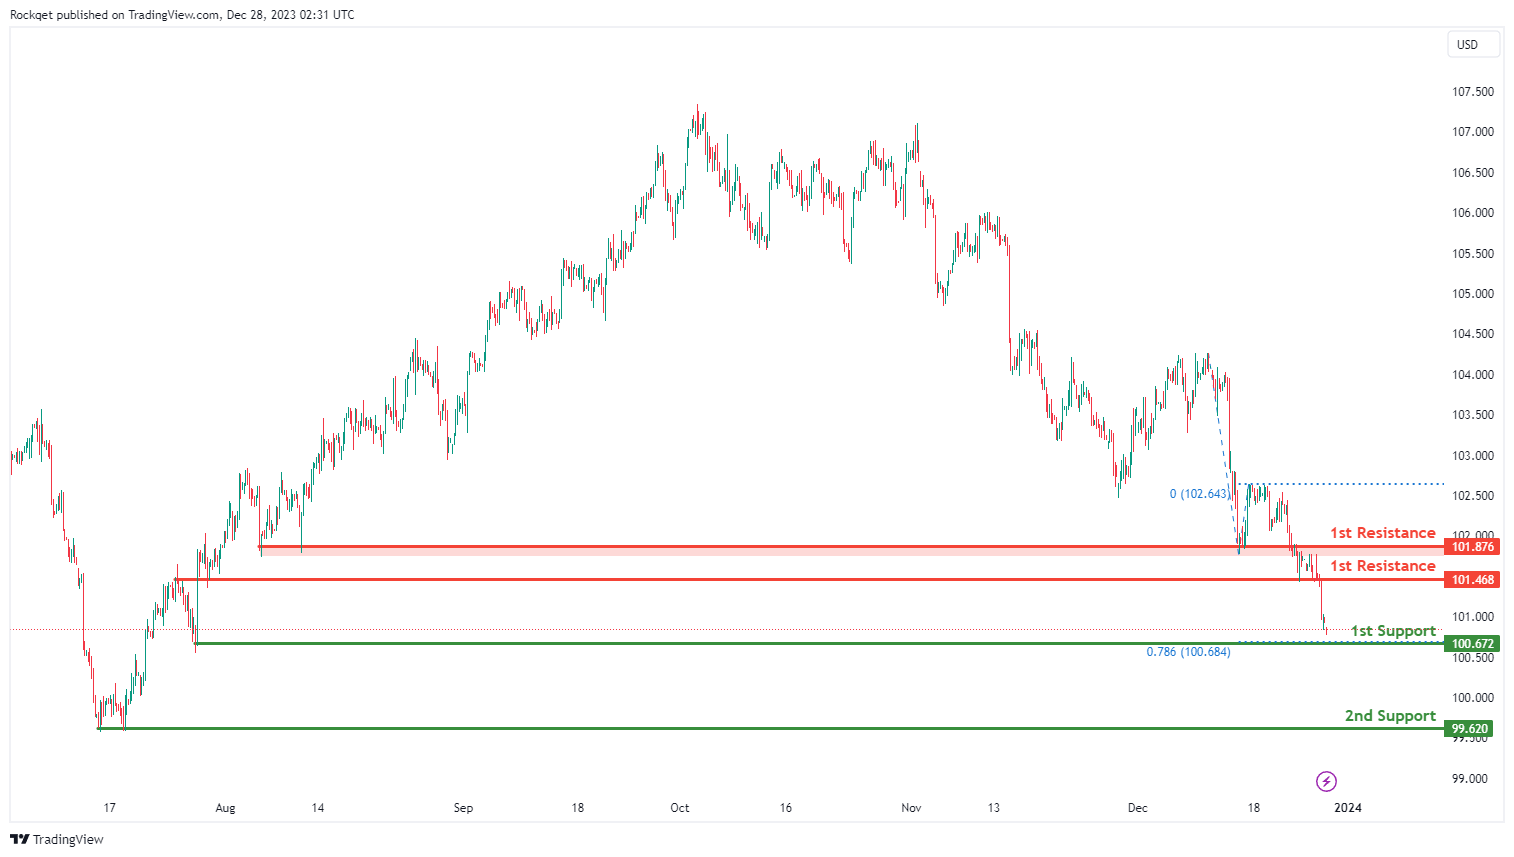
The DXY (US Dollar Index) chart currently shows an overall bearish momentum, indicating a potential for price to make a bearish continuation towards the 1st support.
The 1st support level at 100.67 is identified as a swing-low support that aligns with the 78.60% Fibonacci projection level. Further below, the 2nd support level at 99.62 is noted as pullback support, further reinforcing its importance as a potential key support level.
To the upside, the 1st resistance level at 101.46 is identified as an overlap resistance. Higher up, the 2nd resistance level at 101.87 is also marked as an overlap resistance, suggesting a potential barrier for further upside movement.
EUR/USD:
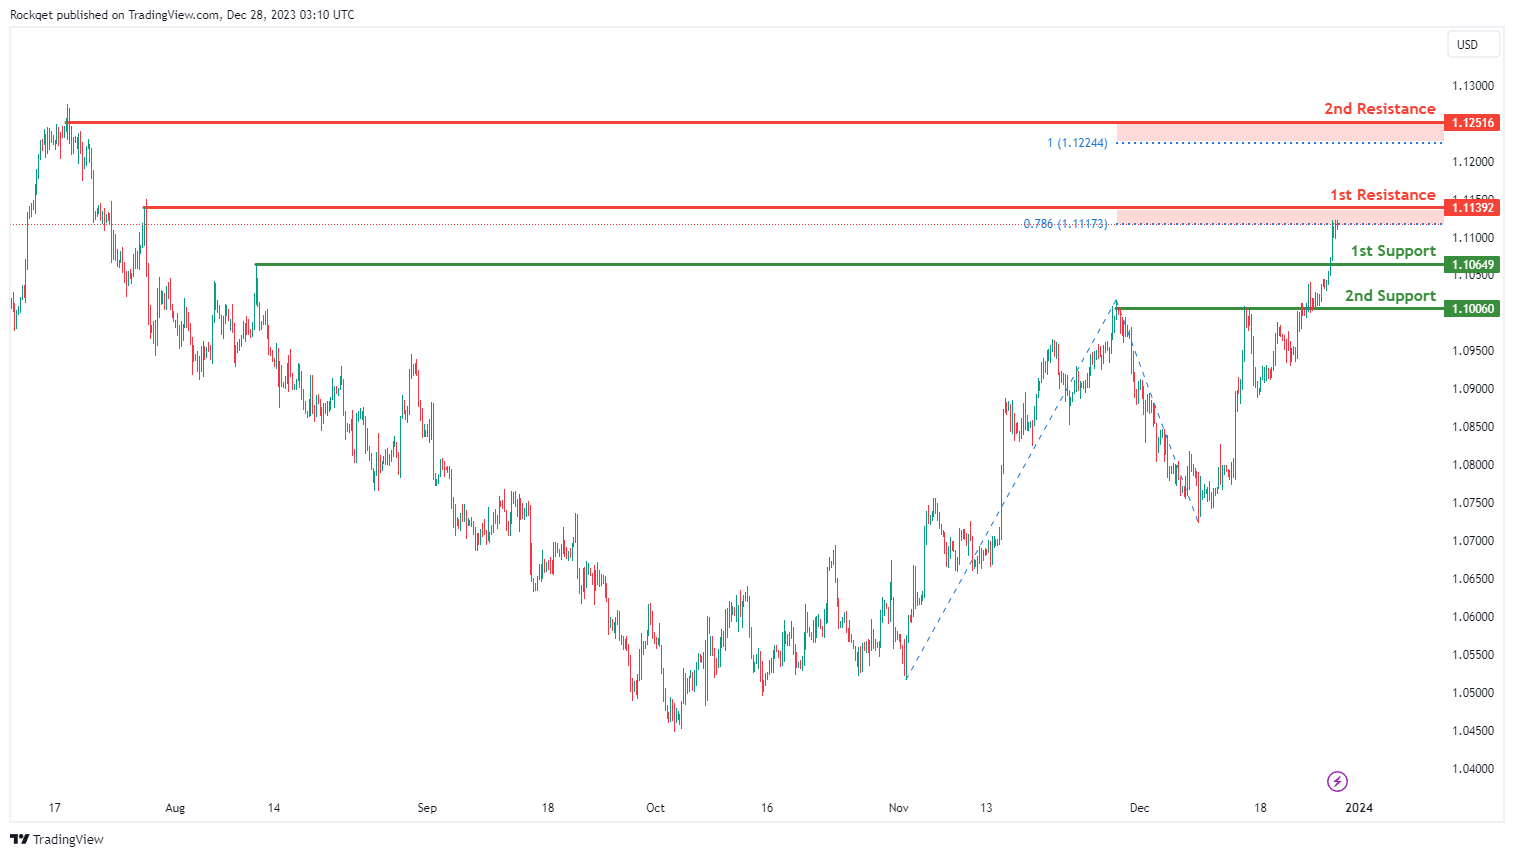
The EUR/USD chart currently exhibits an overall bullish momentum. In this context, there is a potential scenario for price to make a bullish continuation towards the 1st resistance.
The 1st resistance level at 1.1139 is identified as a swing-high resistance that aligns close to the 78.60% Fibonacci projection level. Higher up, the 2nd resistance level at 1.1251 is also noted as a swing-high resistance that aligns close to the 100.00% Fibonacci projection level, suggesting a potential barrier for further upside movement.
To the downside, the 1st support level at 1.1064 is identified as a pullback support. Further below, the 2nd support level at 1.1006 is marked as an overlap support, further reinforcing its importance as a potential key support level.
EUR/JPY:
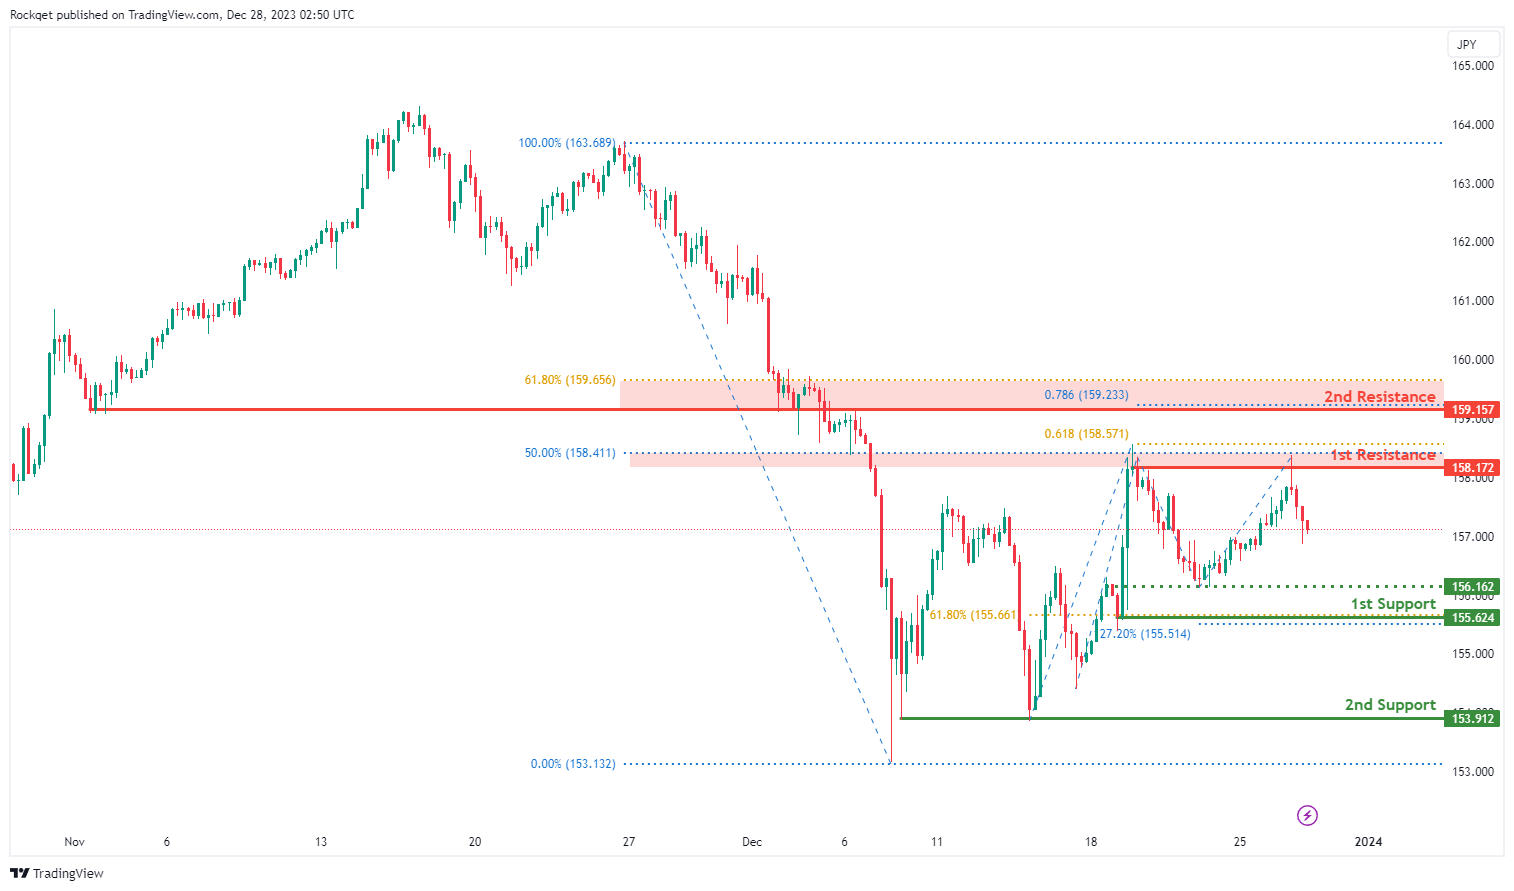
The EUR/JPY chart currently exhibits a bearish overall momentum, indicating a potential scenario for a bearish continuation towards the 1st support.
The 1st support at 155.62 is considered significant as it represents a pullback support and is associated with the 61.80% Fibonacci Retracement and the -27% Fibonacci Expansion. This level indicates a historical area where buying interest has been present.
Additionally, the 2nd support at 153.91 is identified as a multi-swing low support, providing an additional layer of potential support for the currency pair.
The intermediate support at 156.62 is marked as an overlap support.
On the resistance side, the 1st resistance at 158.17 is marked as a swing high resistance and is associated with the 61.80% Fibonacci Projection. This represents a level where selling interest could intensify.
Furthermore, the 2nd resistance at 159.16 is identified as an overlap resistance and is associated with the 61.80% Fibonacci Retracement and the 78.60% Fibonacci Projection, presenting potential barriers for upward movement.
EUR/GBP:
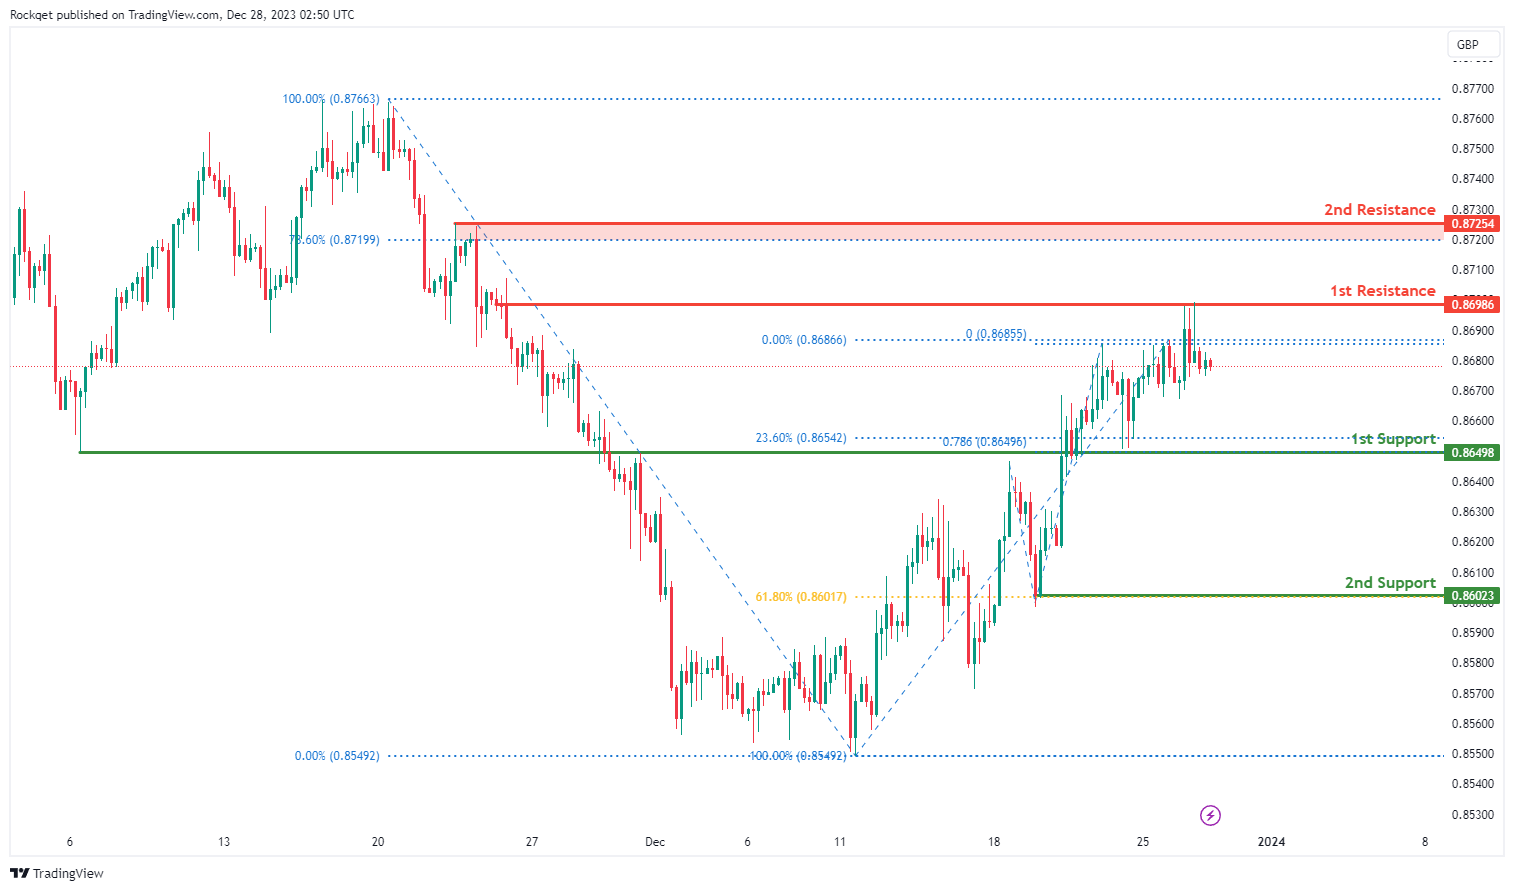
The EUR/GBP chart currently exhibits a bearish overall momentum, indicating a potential scenario for a bearish continuation towards the 1st support.
The 1st support at 0.8650 is considered significant as it represents an overlap support and is associated with the 23.60% Fibonacci Retracement and the 78.60% Fibonacci Projection. This level indicates a historical area where buying interest has been present.
Additionally, the 2nd support at 0.8602 is identified as a pullback support and is associated with the 61.80% Fibonacci Retracement, providing an additional layer of potential support for the currency pair.
On the resistance side, the 1st resistance at 0.8689 is marked as an overlap resistance, representing a level where selling interest could intensify.
Furthermore, the 2nd resistance at 0.8725 is identified as a pullback resistance and is associated with the 78.60% Fibonacci Retracement, presenting potential barriers for upward movement.
GBP/USD:
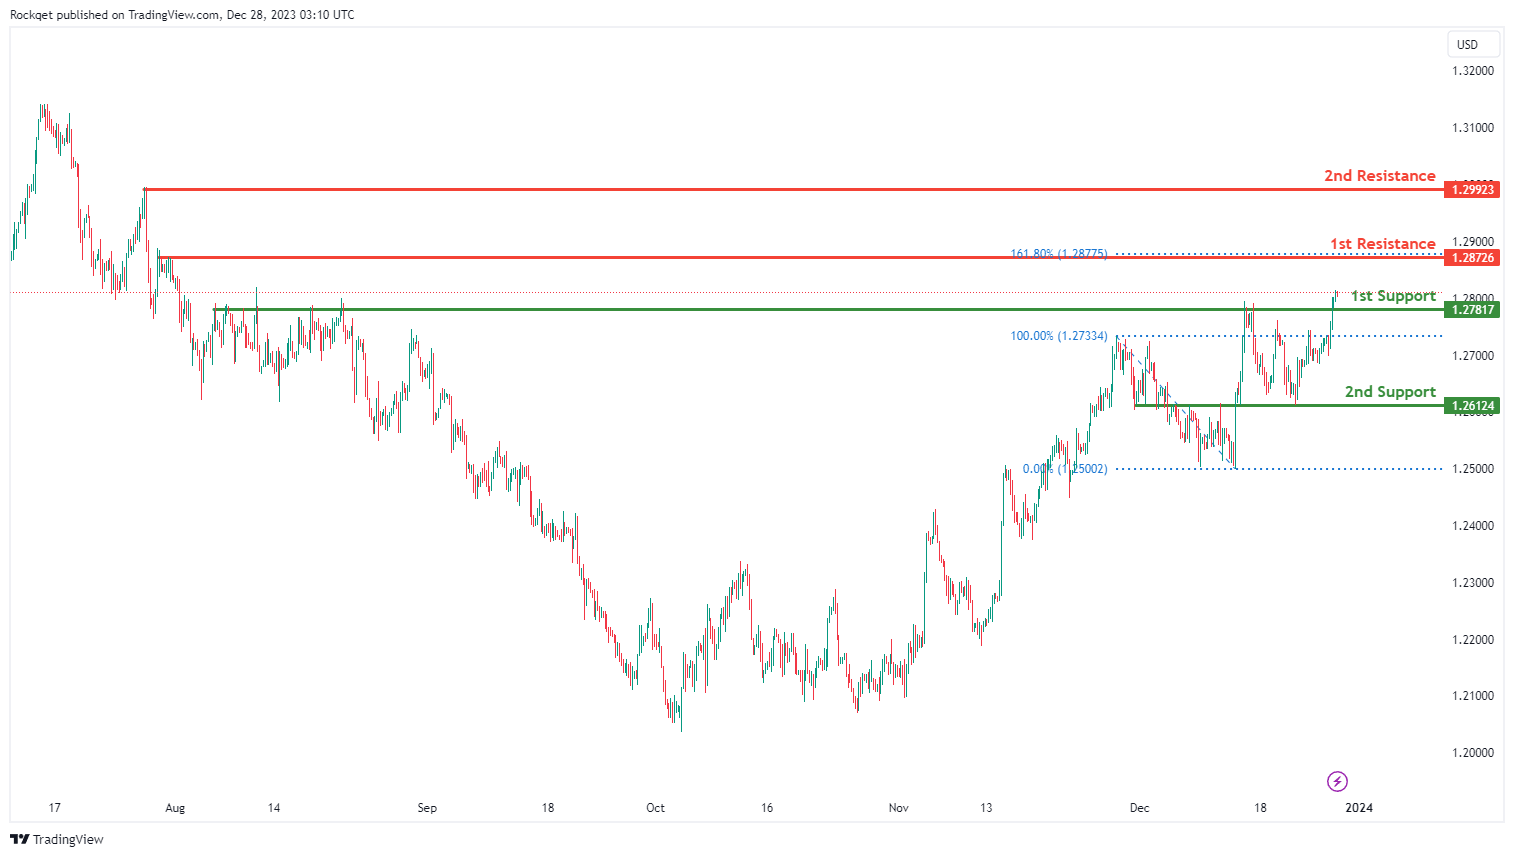
The GBP/USD chart currently exhibits an overall bullish momentum. In this context, there is a potential scenario for price to make a bullish continuation towards the 1st resistance.
The 1st resistance level at 1.2872 is identified as a pullback resistance that aligns with the 161.80% Fibonacci extension level. Higher up, the 2nd resistance level at 1.2992 is noted as a swing-high resistance, suggesting a potential barrier for further upside movement.
To the downside, the 1st support level at 1.2781 is identified as a pullback support. Further below, the 2nd support level at 1.2612 is marked as an overlap support, further reinforcing its importance as a potential key support level.
GBP/JPY:
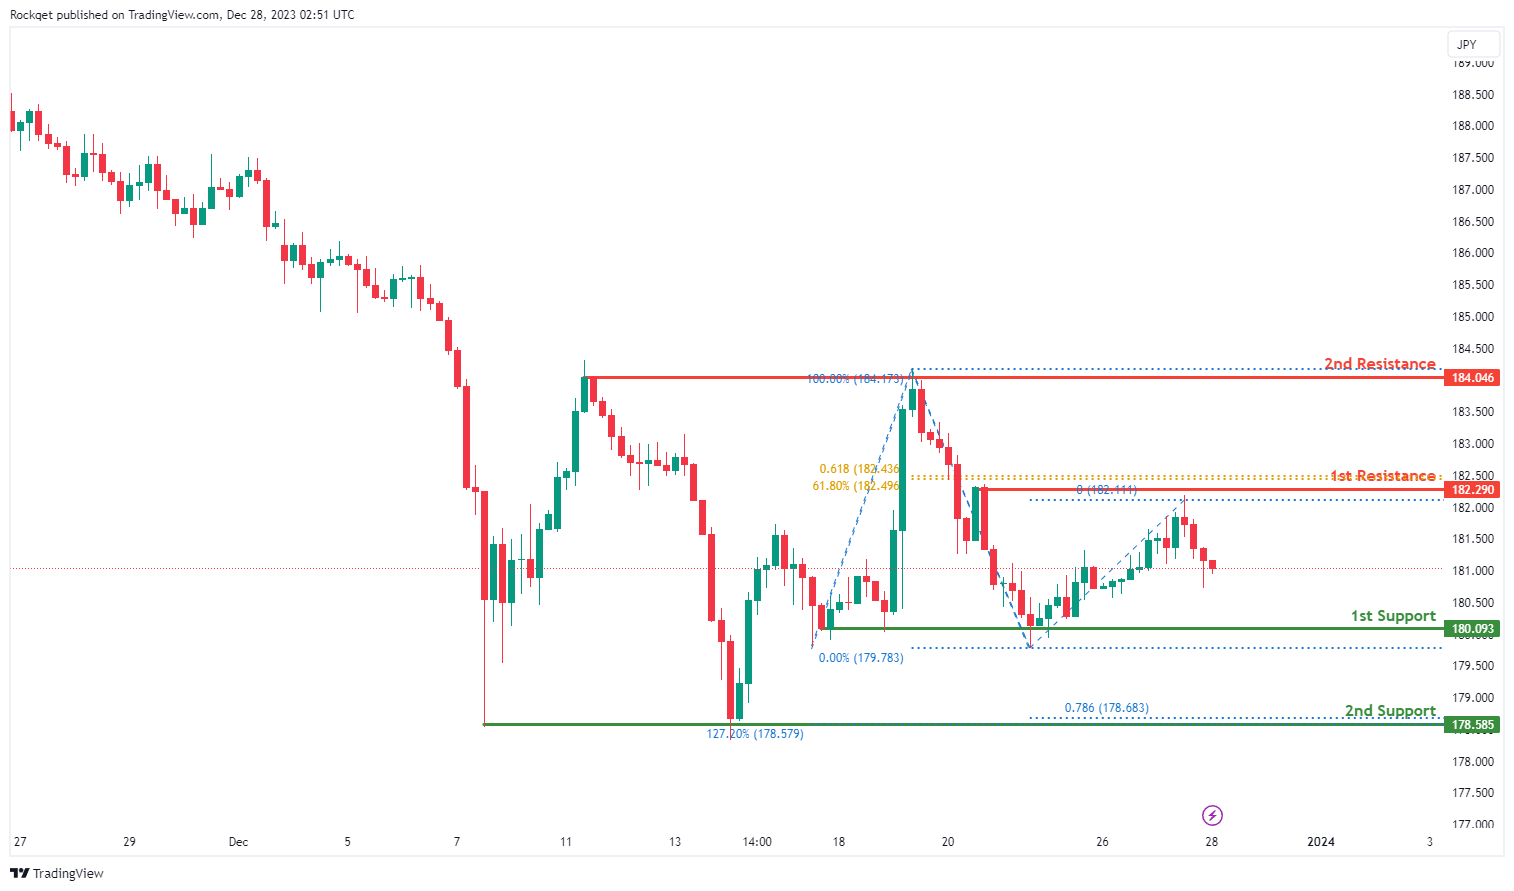
The GBP/JPY chart currently demonstrates a bearish overall momentum, indicating a potential scenario for a bearish continuation towards the 1st support.
The 1st support at 180.09 is deemed significant as it represents a multi-swing low support, suggesting a historical area where buying interest has been notable.
Additionally, the 2nd support at 178.59 is identified as a multi-swing low support and is associated with the 127.20% Fibonacci Extension and the 78.60% Fibonacci Projection, adding layers of potential support for the currency pair.
On the resistance side, the 1st resistance at 182.29 is marked as a pullback resistance and is associated with the 61.80% Fibonacci Projection, presenting a level where selling interest could intensify.
Furthermore, the 2nd resistance at 184.05 is noted as a multi-swing high resistance, indicating a historical area where selling interest has been prevalent.
USD/CHF:
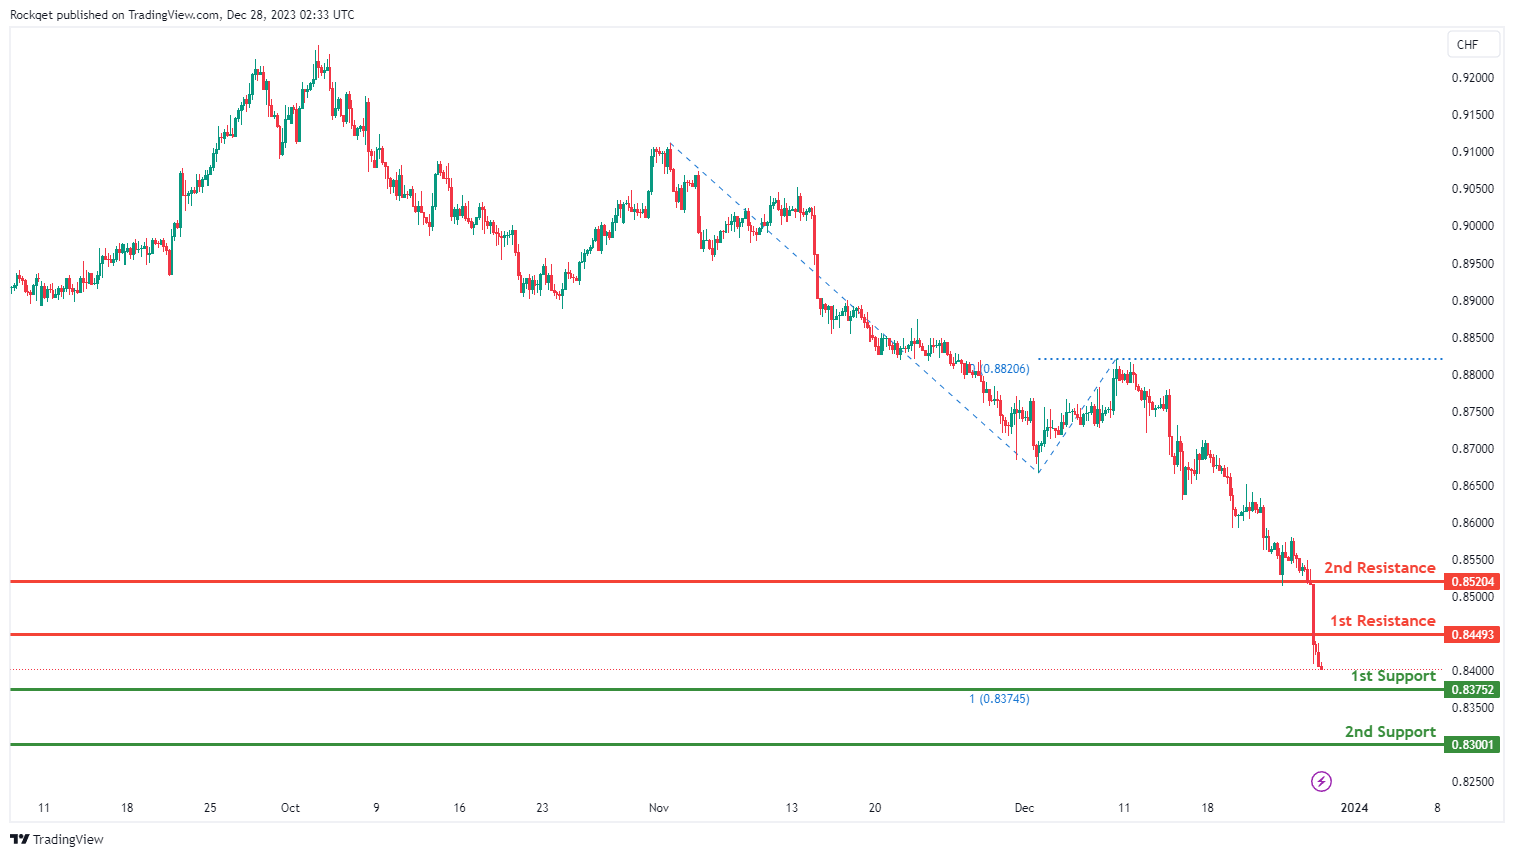
The USD/CHF chart currently exhibits an overall bearish momentum. In this context, there is a potential scenario for price to make a bearish continuation towards the 1st support.
The 1st support level at 0.8375 is identified as a multi-swing-low support that aligns with the 100.00% Fibonacci projection level. Further below, the 2nd support level at 0.8300 is noted as a swing-low support, further reinforcing its importance as a key support level.
To the upside, the 1st resistance level at 0.8449 is identified as a pullback resistance. Higher up, the 2nd resistance level at 0.8520 is also also marked as a pullback resistance, suggesting a potential barrier for further upside movement.
USD/JPY:
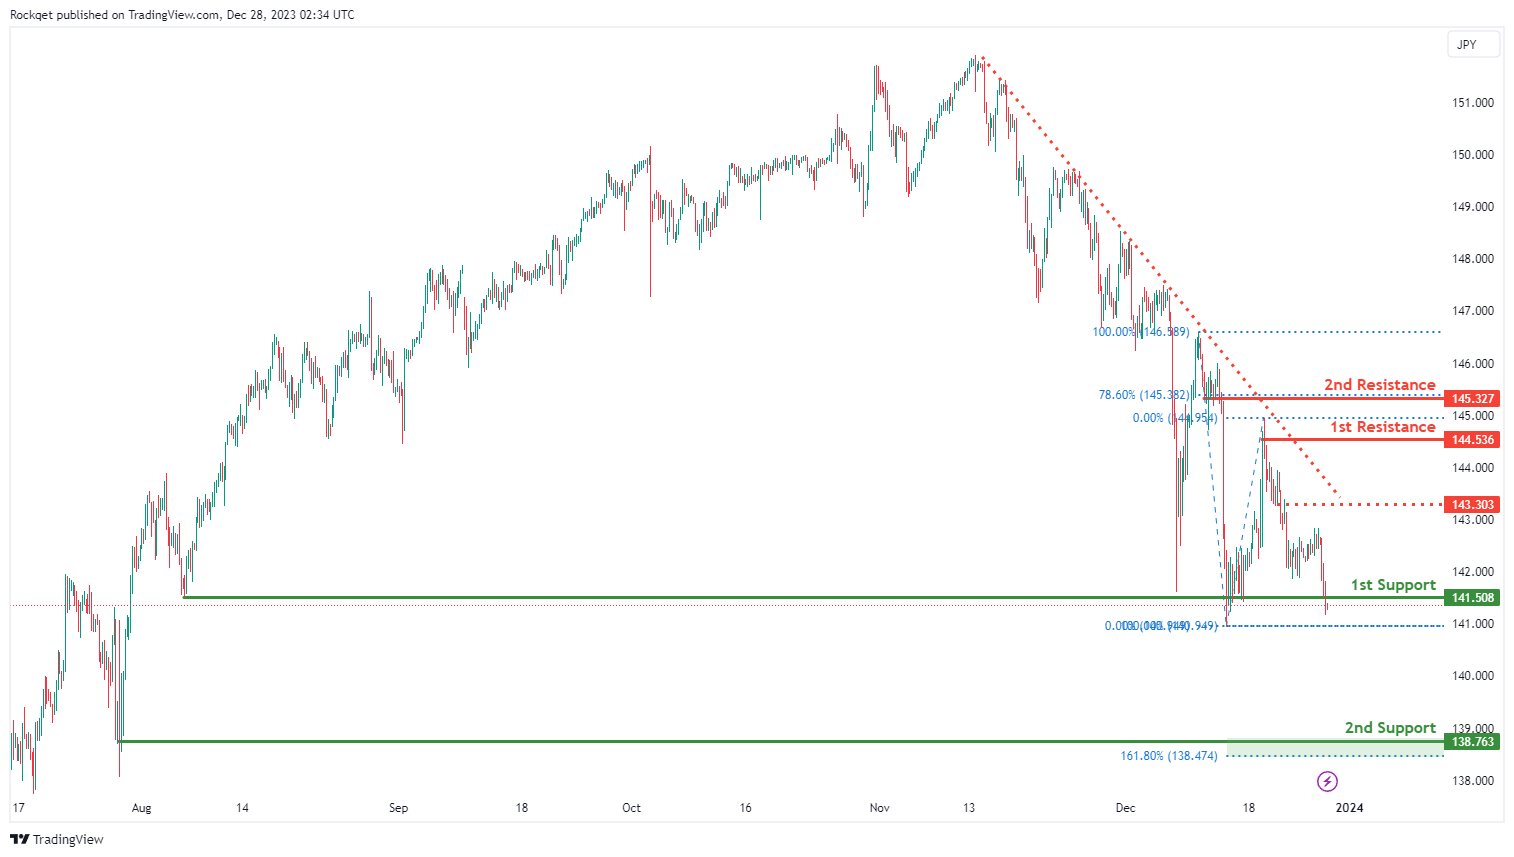
The USD/JPY chart currently exhibits an overall bearish momentum. In this context, there is a potential for price to break under the 1st support and drop towards the 2nd support.
The 1st support level at 141.50 is identified as a multi-swing-low support. Further below, the 2nd support level at 138.76 is noted as a swing-low support that aligns close to the 161.80% Fibonacci extension level, further reinforcing its importance as a key support level.
To the upside, the intermediate resistance level at 143.30 is identified as a pullback resistance while the 1st resistance level at 144.53 is noted as a swing-high resistance. Higher up, the 2nd resistance level at 145.32 is marked as a pullback resistance that aligns with the 78.60% Fibonacci retracement level, suggesting a potential barrier for further upside movement.
USD/CAD:
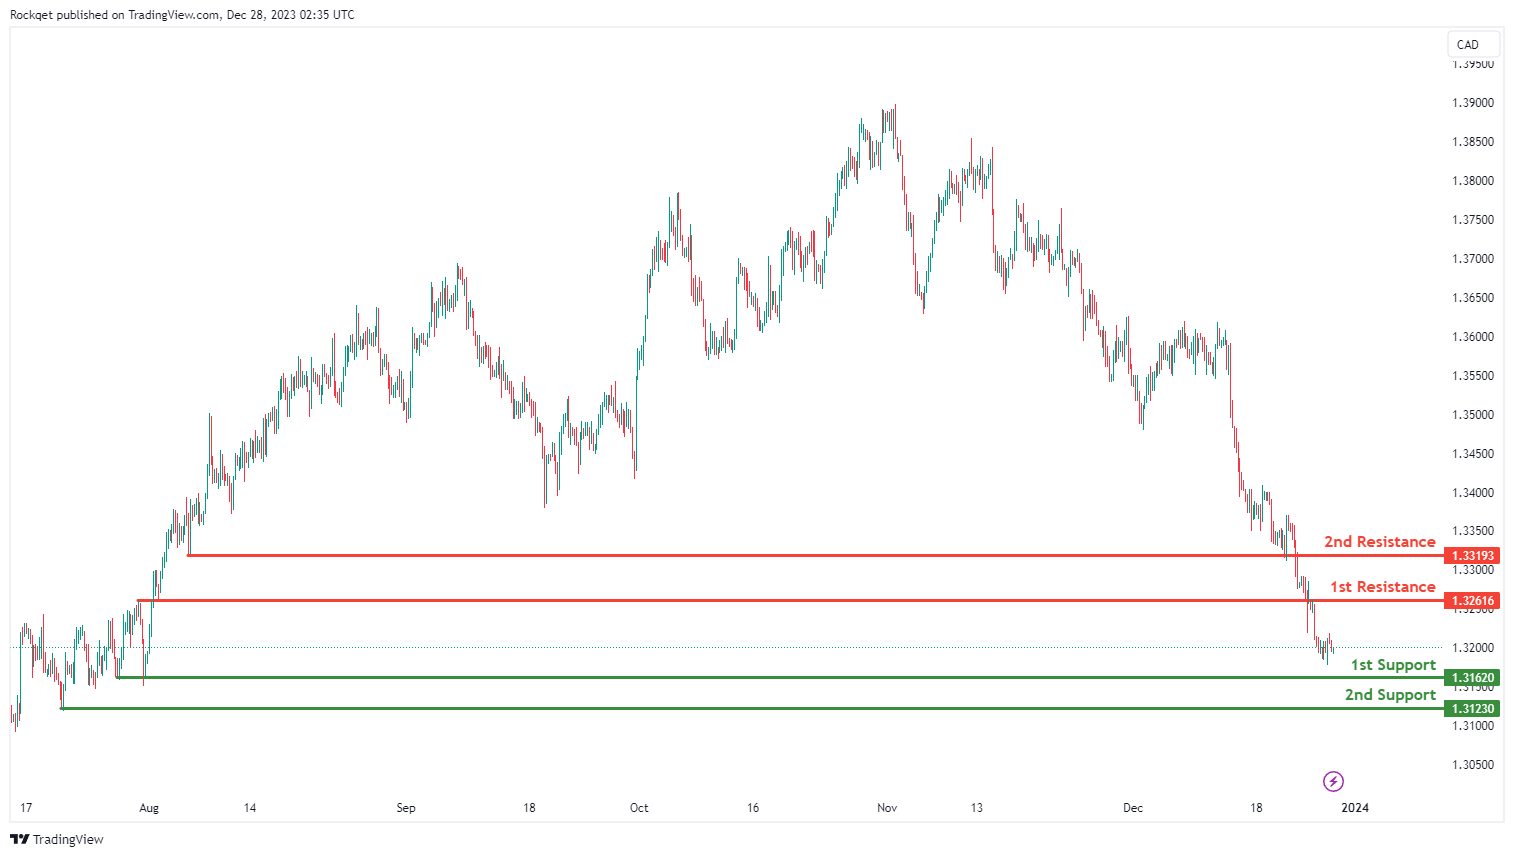
The USD/CAD chart currently exhibits an overall bearish momentum. In this context, there is a potential scenario for price to make a bearish continuation towards the 1st support.
The 1st support level at 1.3162 is identified as a multi-swing-low support. Further below, the 2nd support level at 1.3123 is noted as a swing-low support, further reinforcing its importance as a key support level.
To the upside, the 1st resistance level at 1.3261 is identified as an overlap resistance. Higher up, the 2nd resistance level at 1.3319 is marked as a pullback resistance, suggesting a potential barrier for further upside movement.
AUD/USD:
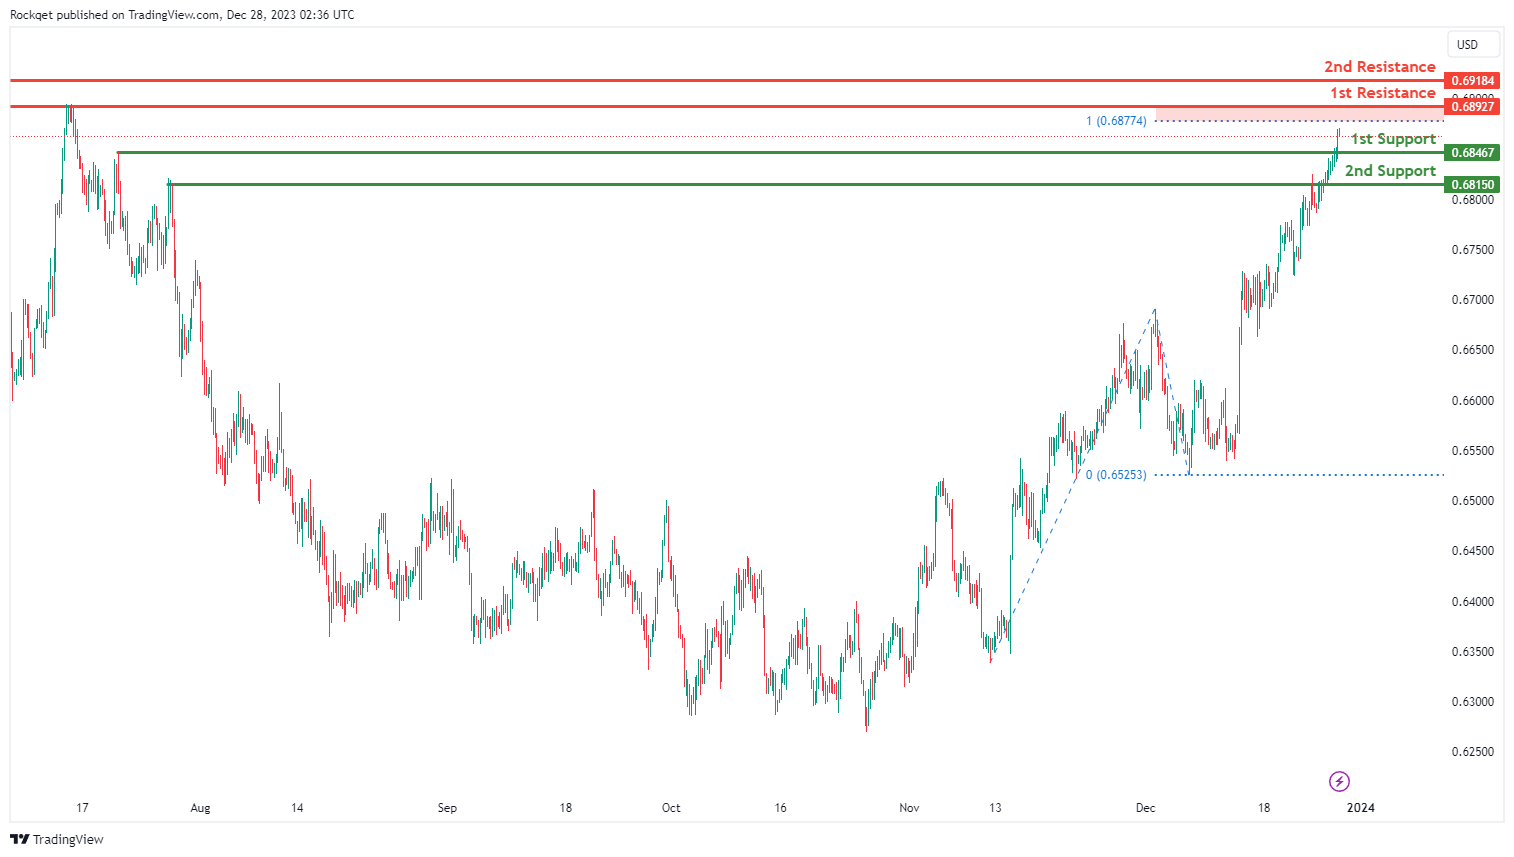
The AUD/USD chart currently exhibits an overall bullish momentum. In this context, there is a potential scenario for price to make a bullish continuation towards the 1st resistance.
The 1st resistance level at 0.6892 is identified as a multi-swing-high resistance that aligns close to the 100.00% Fibonacci projection level. Higher up, the 2nd resistance level at 0.6918 is noted as a swing-high resistance, indicating its potential significance as a barrier for further upward movement.
To the downside, the 1st support level at 0.6846 is identified as a pullback support. Further below, the 2nd support level at 0.6815 is marked as an overlap support, further reinforcing its importance as a key support level.
NZD/USD
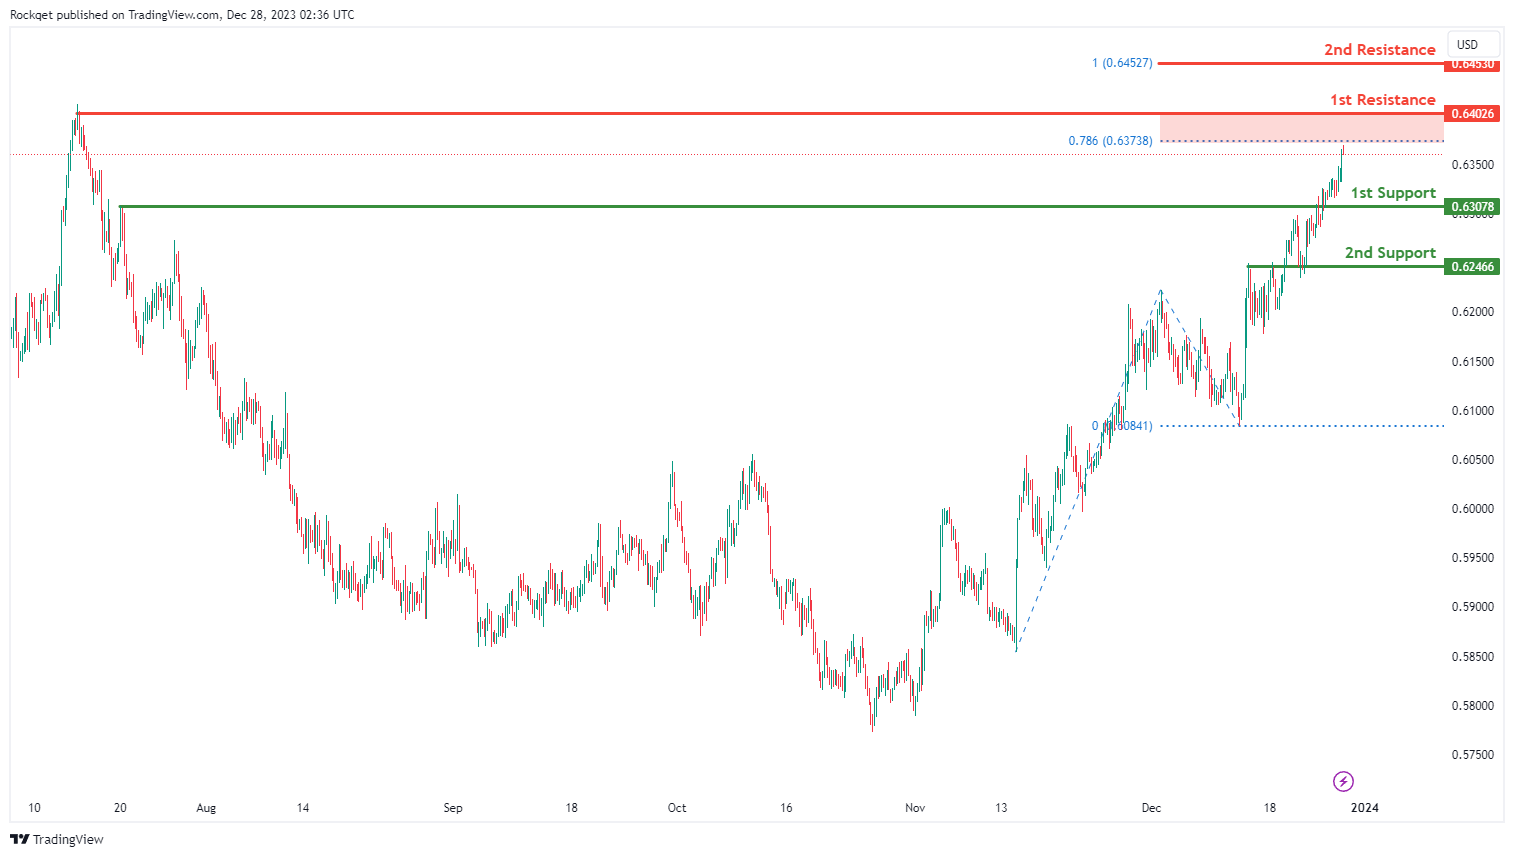
The NZD/USD chart currently exhibits an overall bullish momentum. In this context, there is a potential scenario for price to make a bullish continuation towards the 1st resistance.
The 1st resistance level at 0.6402 is identified as a swing-high resistance. Higher up, the 2nd resistance level at 0.6453 is marked as a resistance that aligns with the 100.00% Fibonacci projection level, indicating its potential significance as a barrier for further upward movement.
To the downside, the 1st support level at 0.6307 is identified as an overlap support. Further below, the 2nd support level at 0.6246 is also noted as an overlap support, further reinforcing its importance as a key support level.
DJ30:
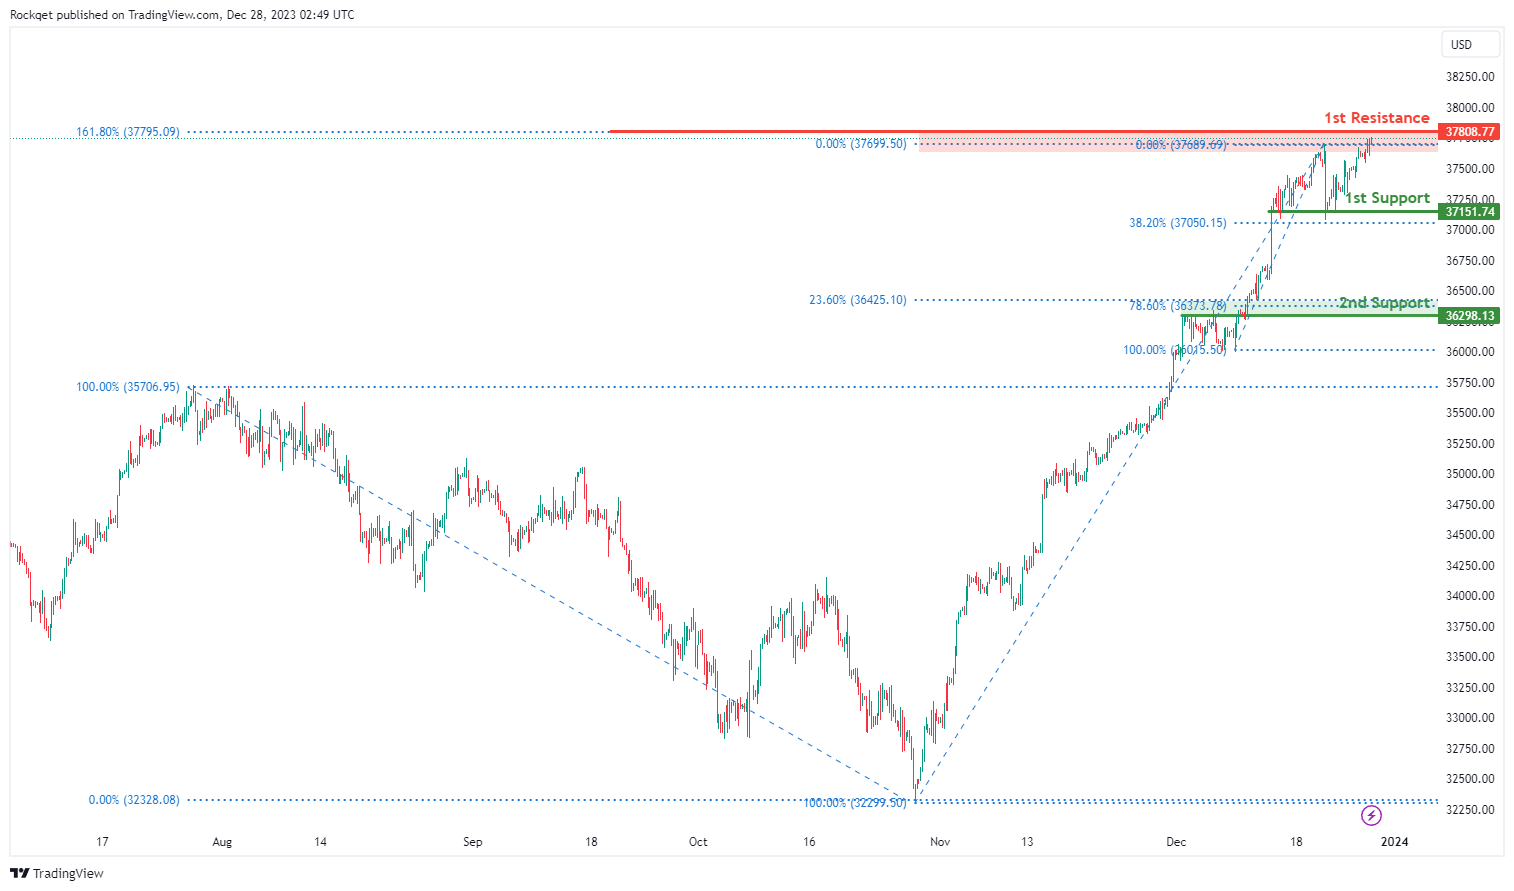
The DJ30 chart currently exhibits a bullish overall momentum, suggesting a potential scenario for a bullish continuation towards the 1st resistance.
The 1st support at 37151.74 is considered significant as it represents an overlap support and is associated with the 38.20% Fibonacci Retracement, indicating a historical area where buying interest has been present.
Additionally, the 2nd support at 36298.13 is identified as another overlap support and is associated with the 23.60% Fibonacci Retracement and the 78.60% Fibonacci Retracement, providing multiple layers of potential support for the index.
On the resistance side, the 1st resistance at 37808.77 is deemed significant as it is linked to the 161.80% Fibonacci Extension, indicating a level where selling interest could intensify.
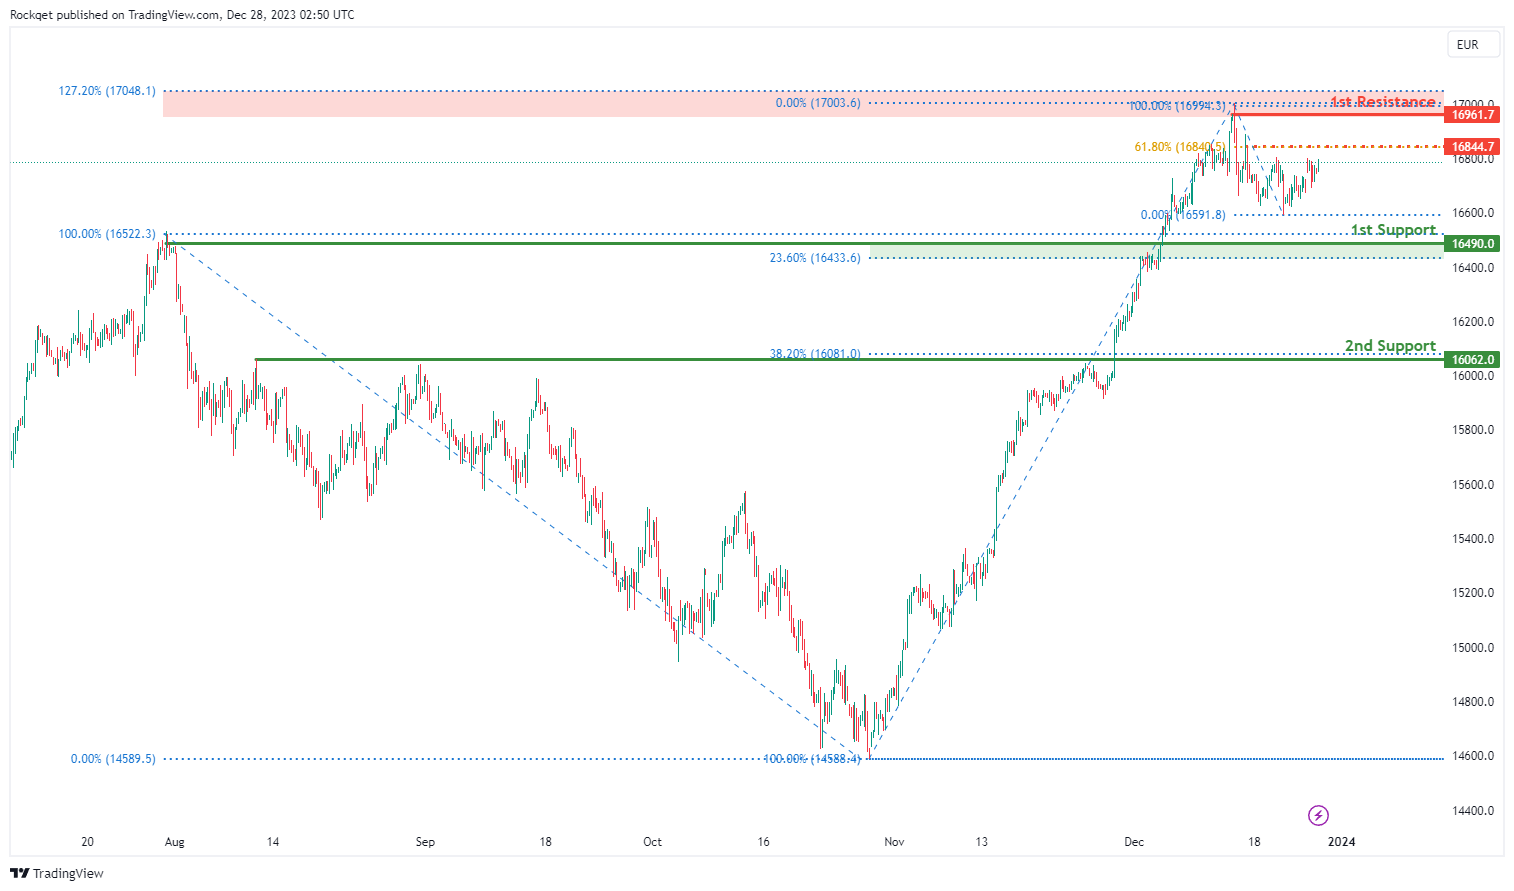
GER40:
The GER40 chart currently exhibits a bullish overall momentum, contributing to the potential for a bullish continuation towards the 1st resistance.
The 1st support at 16490.00 is considered significant as it represents an overlap support and is associated with the 23.60% Fibonacci Retracement, indicating a historical area where buying interest has been present.
Furthermore, the 2nd support at 16062.00 is identified as another significant level, characterized as a pullback support and associated with the 38.20% Fibonacci Retracement, providing additional layers of potential support for the index.
On the resistance side, the 1st resistance at 16961.70 is considered significant as it is linked to a swing high resistance and the 127.20% Fibonacci Extension, indicating a level where selling interest could intensify.
Additionally, the intermediate resistance at 16844.70 is associated with a pullback resistance and the 61.80% Fibonacci Retracement, adding an extra layer of potential resistance for the index.
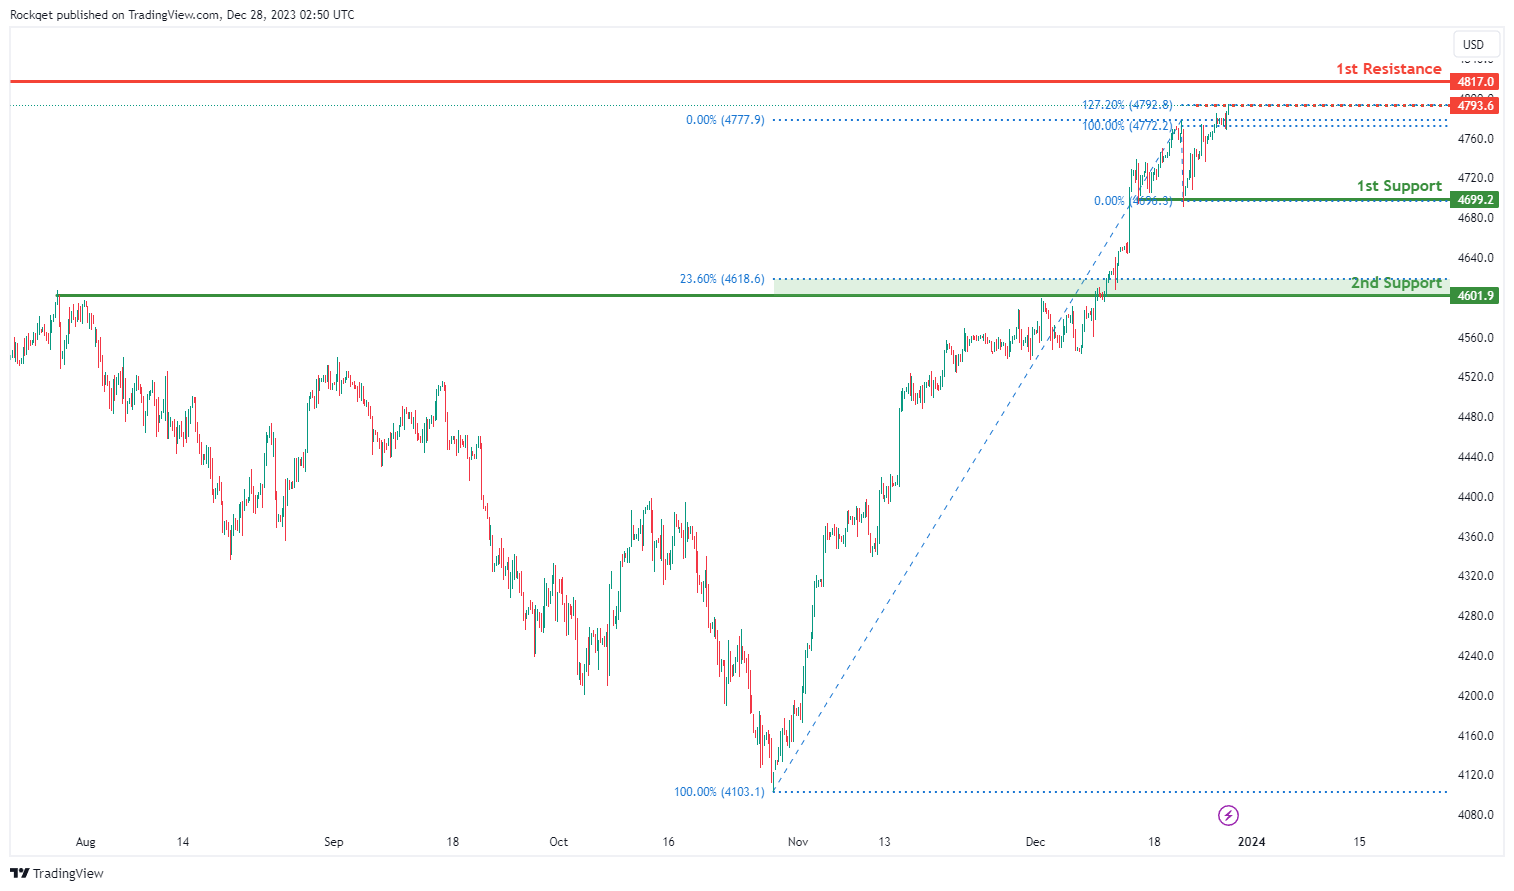
US500:
The US500 chart currently maintains a bullish overall momentum, driven by several factors. For potential upward movement, the chart could make a bullish continuation towards the 1st resistance.
The 1st support is a multi-swing low at 4699.2, signifying a historical area where buying interest has been prevalent.
Additionally, the 2nd support at 4601.9 is deemed significant as it represents an overlap support and is associated with the 23.60% Fibonacci Retracement, providing added support.
The intermediate resistance at 4793.6 is considered noteworthy, linked to the 127.20% Fibonacci Extension, indicating a level where selling interest may intensify.
Furthermore, the 2nd resistance at 4817.0 is associated with a swing high resistance, adding another layer of potential resistance for the index.
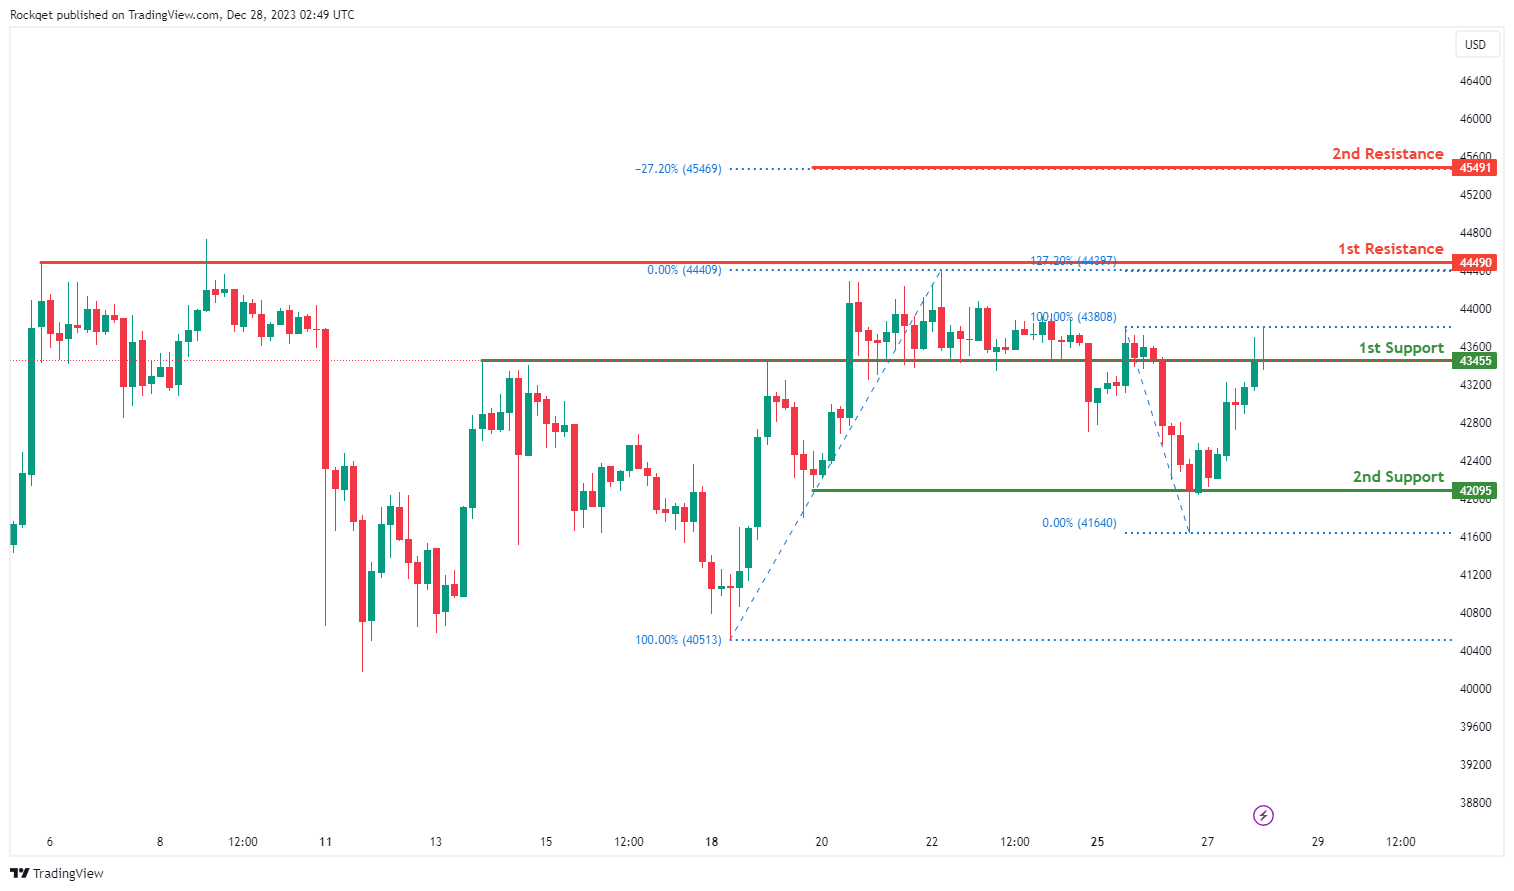
BTC/USD:
The BTC/USD chart exhibits a bullish overall momentum, and there’s potential for a bullish bounce off the 1st support, signaling a move towards the 1st resistance.
The 1st support at 43455 is considered significant as it represents an overlap support, indicating a historical area where buying interest has been present.
Additionally, the 2nd support at 42095 is identified as a pullback support, providing an additional layer of potential support for the cryptocurrency.
On the resistance side, the 1st resistance at 44490 is linked to a swing high resistance, representing a level where selling interest could intensify.
Furthermore, the 2nd resistance at 45491 is associated with a -27% Fibonacci Expansion, adding another layer of potential resistance for BTC/USD.
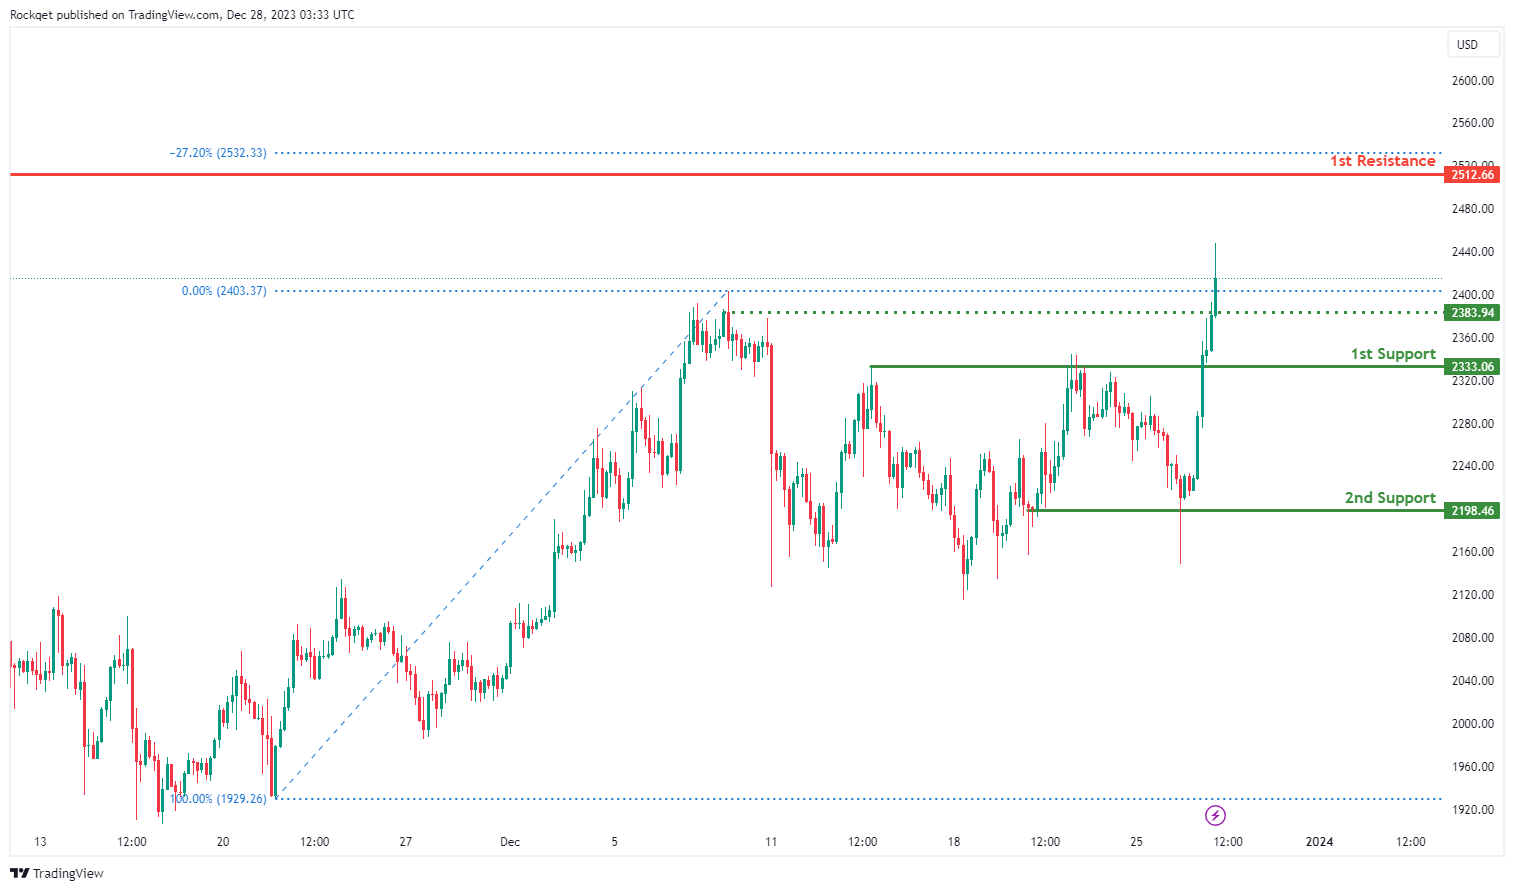
ETH/USD:
The ETH/USD chart demonstrates a bullish overall momentum, suggesting a potential for a bullish continuation towards the 1st resistance.
The 1st support at 2333.06 is considered significant as it represents a pullback support, indicating a historical area where buying interest has been present.
Additionally, the 2nd support at 2198.46 is identified as another pullback support, providing an additional layer of potential support for the cryptocurrency.
On the resistance side, the 1st resistance at 2512.66 is linked to a swing high resistance, representing a level where selling interest could intensify.
Furthermore, the intermediate support at 2383.94 is associated with an overlap support, adding another layer of potential support for ETH/USD.
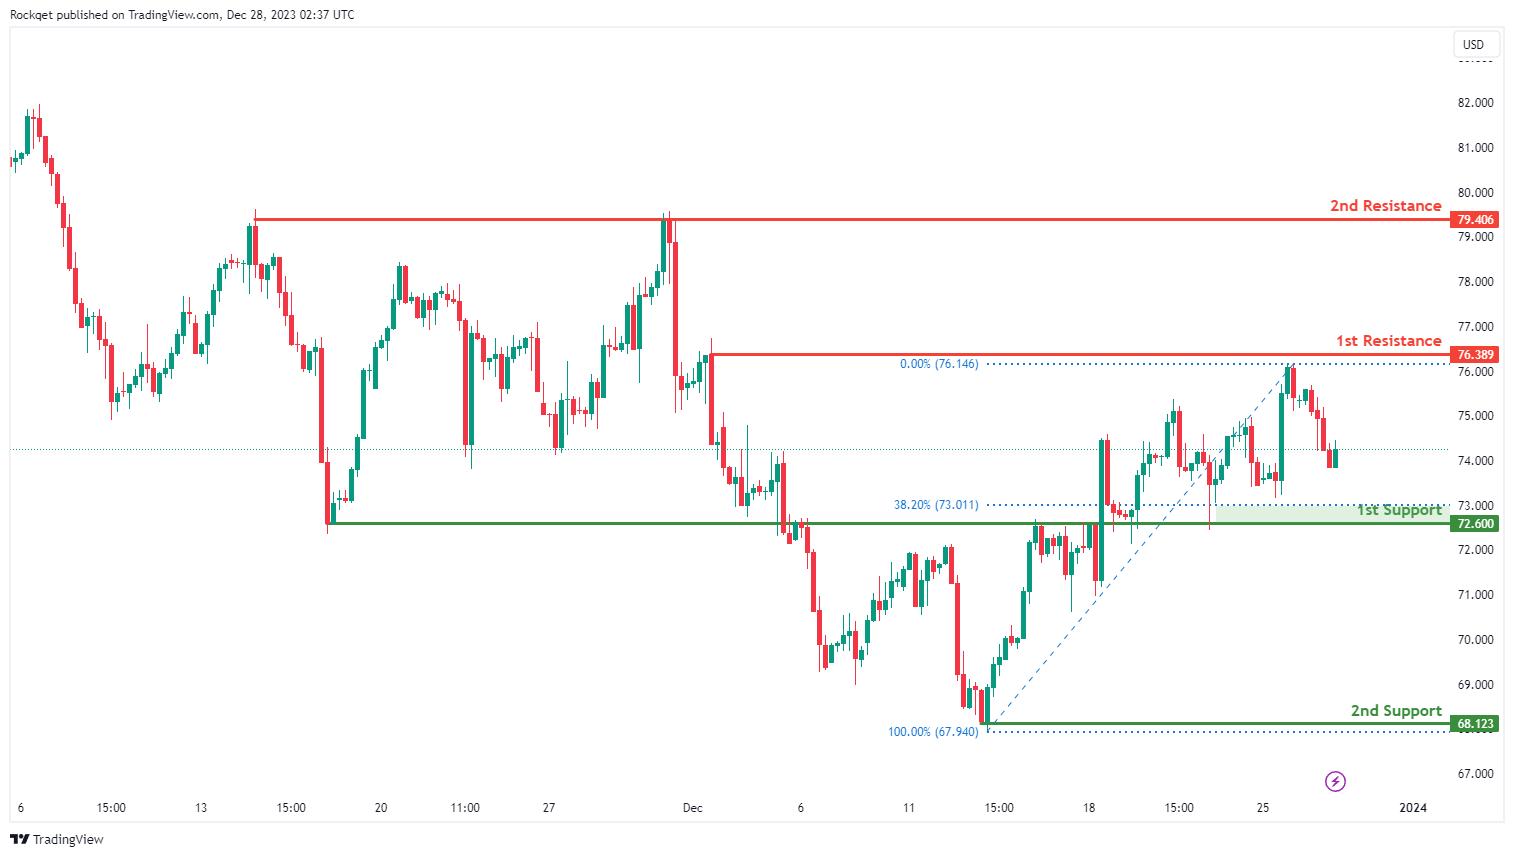
WTI/USD:
The WTI chart currently exhibits an overall bullish momentum, suggesting a prevailing uptrend. However, there is a potential scenario for price to fall towards the 1st support before resuming the uptrend.
The 1st support level at 72.60 is identified as an overlap support that aligns close to the 38.20% Fibonacci retracement level. Further below, the 2nd support level at 68.12 is marked as a swing-low support, reinforcing its importance as a key support level.
To the upside, the 1st resistance level at 76.38 is identified as a pullback resistance. Higher up, the 2nd resistance level at 79.40 is noted as a multi-swing-high resistance, further indicating its potential significance as a barrier for further upward movement.
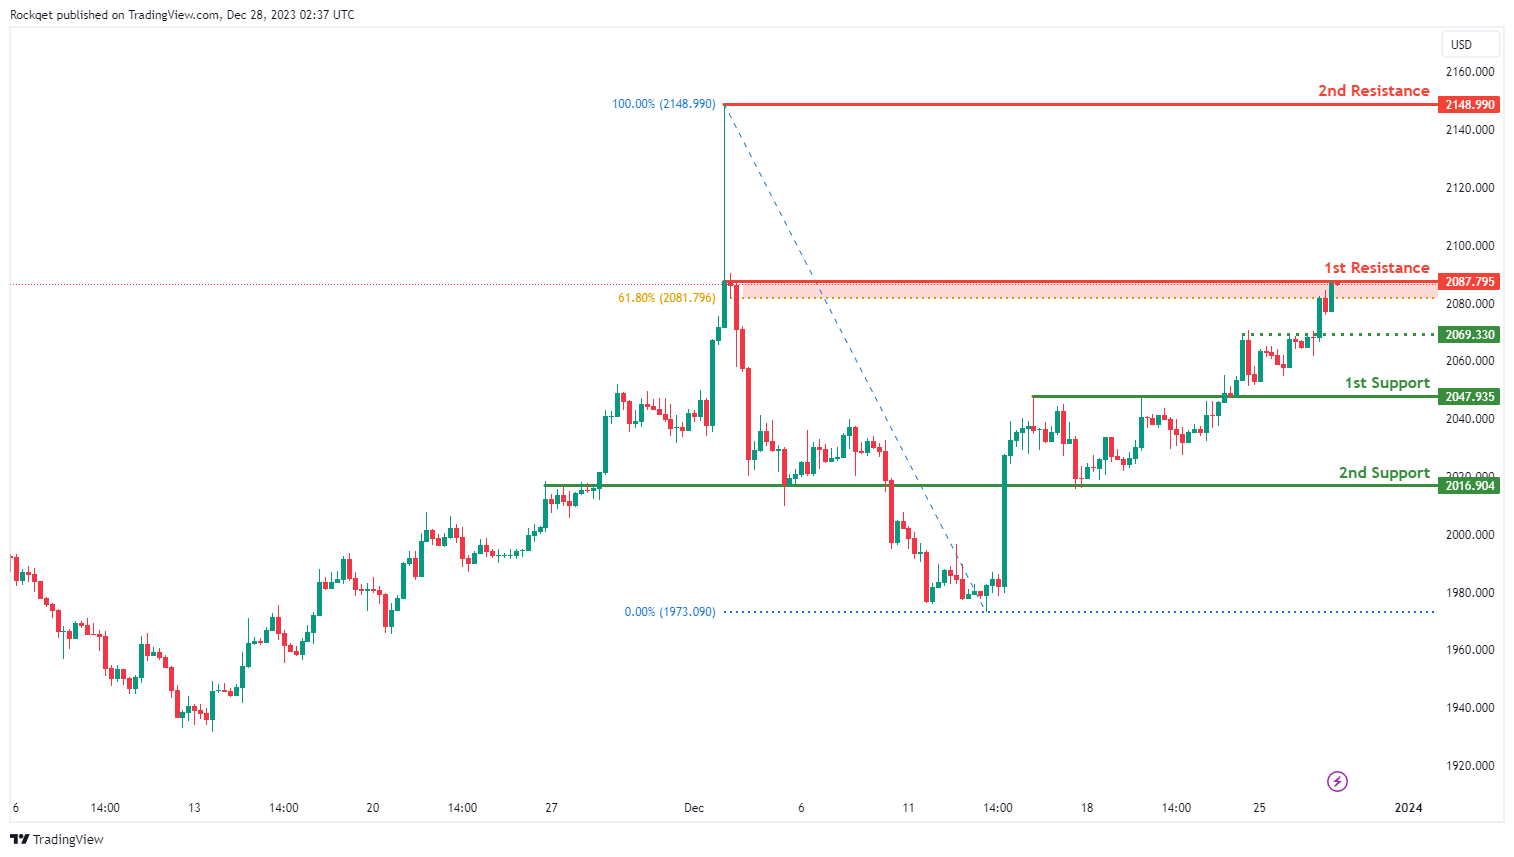
XAU/USD (GOLD):
The XAU/USD chart currently demonstrates a bullish momentum, indicating a potential for price to break above the 1st resistance and make a bullish continuation towards the 2nd resistance.
The 1st resistance level at 2,087.79 is identified as a pullback resistance that aligns close to the 61.80% Fibonacci retracement level. Higher up, the 2nd resistance level at 2,148.99 is marked as a swing-high resistance, further indicating its potential significance as a barrier for further upward movement.
To the downside, the intermediate support level at 2,069.33 is identified as an overlap support while the 1st support level at 2,047.93 is also marked as an overlap support. Further below, the 2nd support level at 2,016.90 is also noted as an overlap support, reinforcing its importance as a key support level.
The accuracy, completeness and timeliness of the information contained on this site cannot be guaranteed. IC Markets does not warranty, guarantee or make any representations, or assume any liability regarding financial results based on the use of the information in the site.
News, views, opinions, recommendations and other information obtained from sources outside of www.icmarkets.com, used in this site are believed to be reliable, but we cannot guarantee their accuracy or completeness. All such information is subject to change at any time without notice. IC Markets assumes no responsibility for the content of any linked site.
The fact that such links may exist does not indicate approval or endorsement of any material contained on any linked site. IC Markets is not liable for any harm caused by the transmission, through accessing the services or information on this site, of a computer virus, or other computer code or programming device that might be used to access, delete, damage, disable, disrupt or otherwise impede in any manner, the operation of the site or of any user’s software, hardware, data or property.


