
Key risk events today:
ECB Monetary Policy Meeting Accounts; US Core Durable Goods Orders m/m; US Durable Goods Orders m/m; US Final GDP q/q; US Unemployment Claims.
(Previous analysis as well as outside sources – italics).
EUR/USD:
It was an overall strong day for the dollar Wednesday, holding gains north of the 97.00 handle into the European close.
EUR/USD, heading into US hours, however, overthrew the 1.13 handle in strong fashion on the H4 timeframe.
For traders who read recent technical briefings you may recall the following pieces (italics):
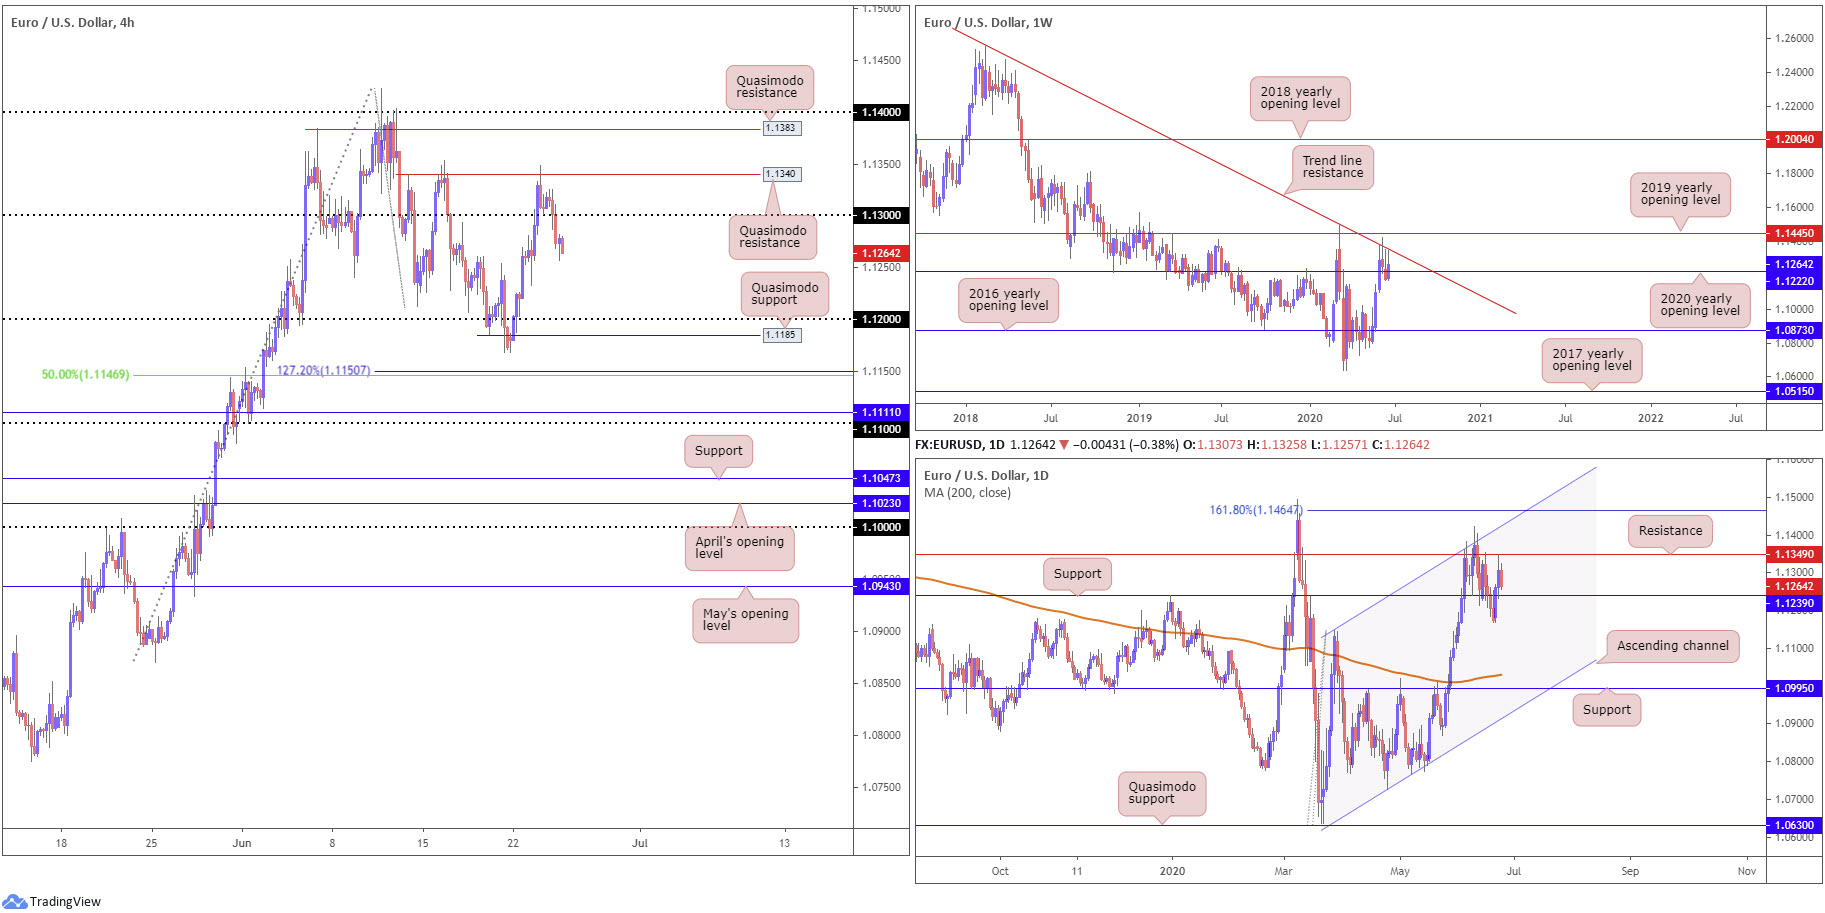
A fakeout above 1.13 is something to keep in mind. Surpassing 1.13 and tagging H4 Quasimodo resistance at 1.1340 would not only trip stops above the round number, it would entice fresh sellers off 1.1340.
Not only has H4 Quasimodo resistance made an entrance at 1.1340, daily resistance at 1.1349 did as well. Therefore, a H4 close below 1.13 is still likely on the radar today for sellers.
As evident from the H4 chart, the fakeout scenario played out as anticipated, with H4 price closing under 1.13. The unit now appears poised to continue exploring lower levels until reaching 1.12, closely followed by H4 Quasimodo support at 1.1185.
Price action, based on the weekly timeframe, shows buyers and sellers battling for position ahead of long-standing trend line resistance, taken from the high 1.2555. A downturn from here will likely revisit the 2020 yearly opening level at 1.1222 as support, while continued bidding may cross swords with the 2019 yearly opening level at 1.1445. Meanwhile, yesterday had daily price dip south of resistance at 1.1349 and is, as of current price, strategically positioned north of support coming in at 1.1239.
Areas of consideration:
Well done to those who managed to take advantage of the fakeout above 1.13.
Continued selling is likely on the cards, with H4 calling for 1.12. Yet, before reaching this point, traders must contend with daily support at 1.1239.
In the event we do eventually seize 1.12, watch for a fakeout scenario through the aforementioned round number to materialise into H4 Quasimodo support at 1.1185. A H4 close back above 1.12 would likely be a welcomed sight for buyers.
GBP/USD:
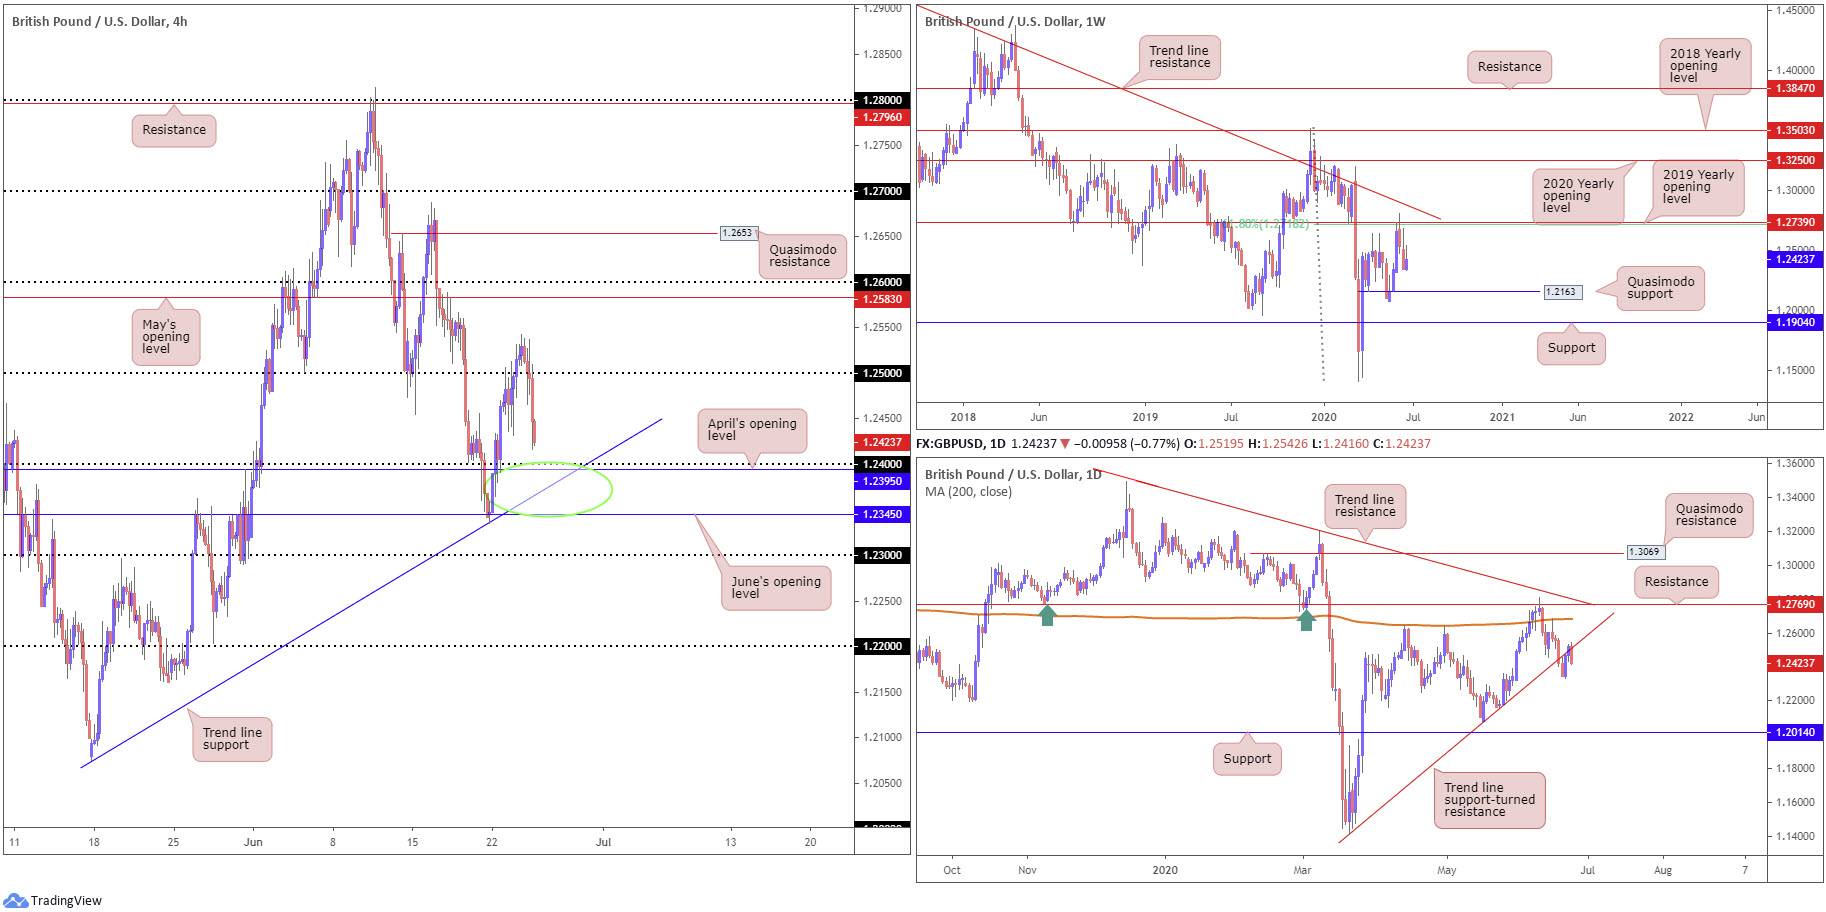
Sterling witnessed a sharp change in mood Wednesday, unable to maintain a presence above 1.25 on the H4 timeframe. Undermined on the back of a resurgent dollar, GBP/USD established firm position sub 1.25 and, going forward, suggests 1.24 and April’s opening level at 1.2395 may make a show. Traders will also recognise nearby trend line support, extended from the low 1.2075, and June’s opening level at 1.2345.
Price action on the daily timeframe recently shook hands with trend line support-turned resistance, taken from the low 1.1409, strategically positioned above the round number 1.25 on the H4 timeframe. Navigating deeper waters under the aforementioned trend line resistance indicates an approach to weekly Quasimodo support at 1.2163. To the upside on the weekly timeframe, traders will also be watching resistance in the form of a 61.8% Fibonacci retracement ratio at 1.2718 and 2019 yearly opening level at 1.2739.
Areas of consideration:
Reasonably considerable support resides between June’s opening level at 1.2345 and the 1.24 handle on the H4 timeframe (green circle). Despite this, higher-timeframe flow appears to be looking beyond this zone.
Although bullish scenarios may form between 1.2345/1.24, prudent traders will also accept the possibility of bearish themes emerging sub 1.2345, in line with higher-timeframe direction.
AUD/USD:
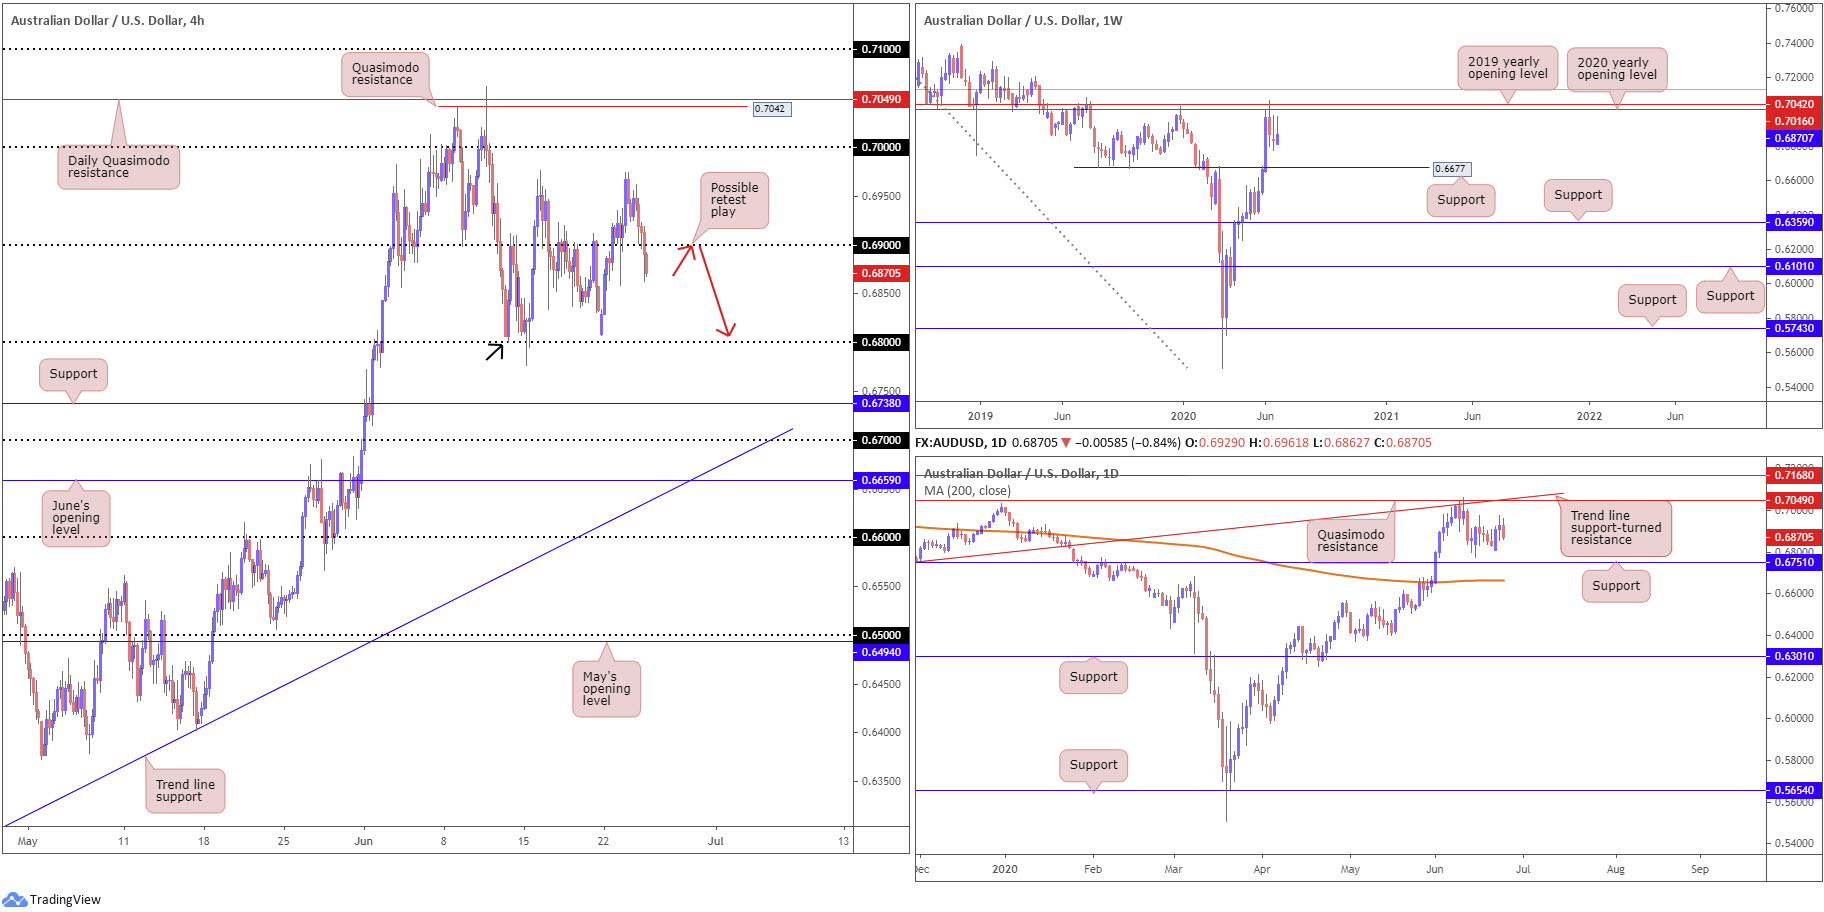
Pressured on the back of risk-off flows combined with dollar strength, AUD/USD reclaimed 0.69 to the downside as we moved into US hours Wednesday.
With Wednesday leaving behind 0.69, the road south on the H4 timeframe appears clear until reaching the 0.68 juncture. Technically speaking, this figure also throws across a Quasimodo support (black arrow denotes the left shoulder).
Resistance, forged in the shape of a 2020 yearly opening level and a 2019 yearly opening level, at 0.7016 and 0.7042, respectively, continues to offer a dominant presence on the weekly timeframe. It might also interest traders to note that just above the said resistances we have a 61.8% Fibonacci retracement ratio stationed at 0.7128 (green). In terms of support, crosshairs are perhaps fixed on 0.6677.
From the daily timeframe, Quasimodo resistance at 0.7049 is in sight, merging closely with trend line support-turned resistance, taken from the low 0.6670. Attention on this timeframe also remains at support coming in from 0.6751. Interestingly, lurking beneath here we also have the 200-day SMA (orange – 0.6664), sited close by the weekly support at 0.6677.
Areas of consideration:
According to technical research, sellers have the upper hand heading into Thursday’s session. A retest at the underside of 0.69 (red arrows), one that holds by way of a H1/H4 bearish candlestick pattern, would, therefore, likely appeal to sellers, targeting the 0.68 neighbourhood as an initial take-profit zone.
Aggressive traders, on the other hand, will already likely be short the break of 0.69, also targeting 0.68 as an initial base.
USD/JPY:
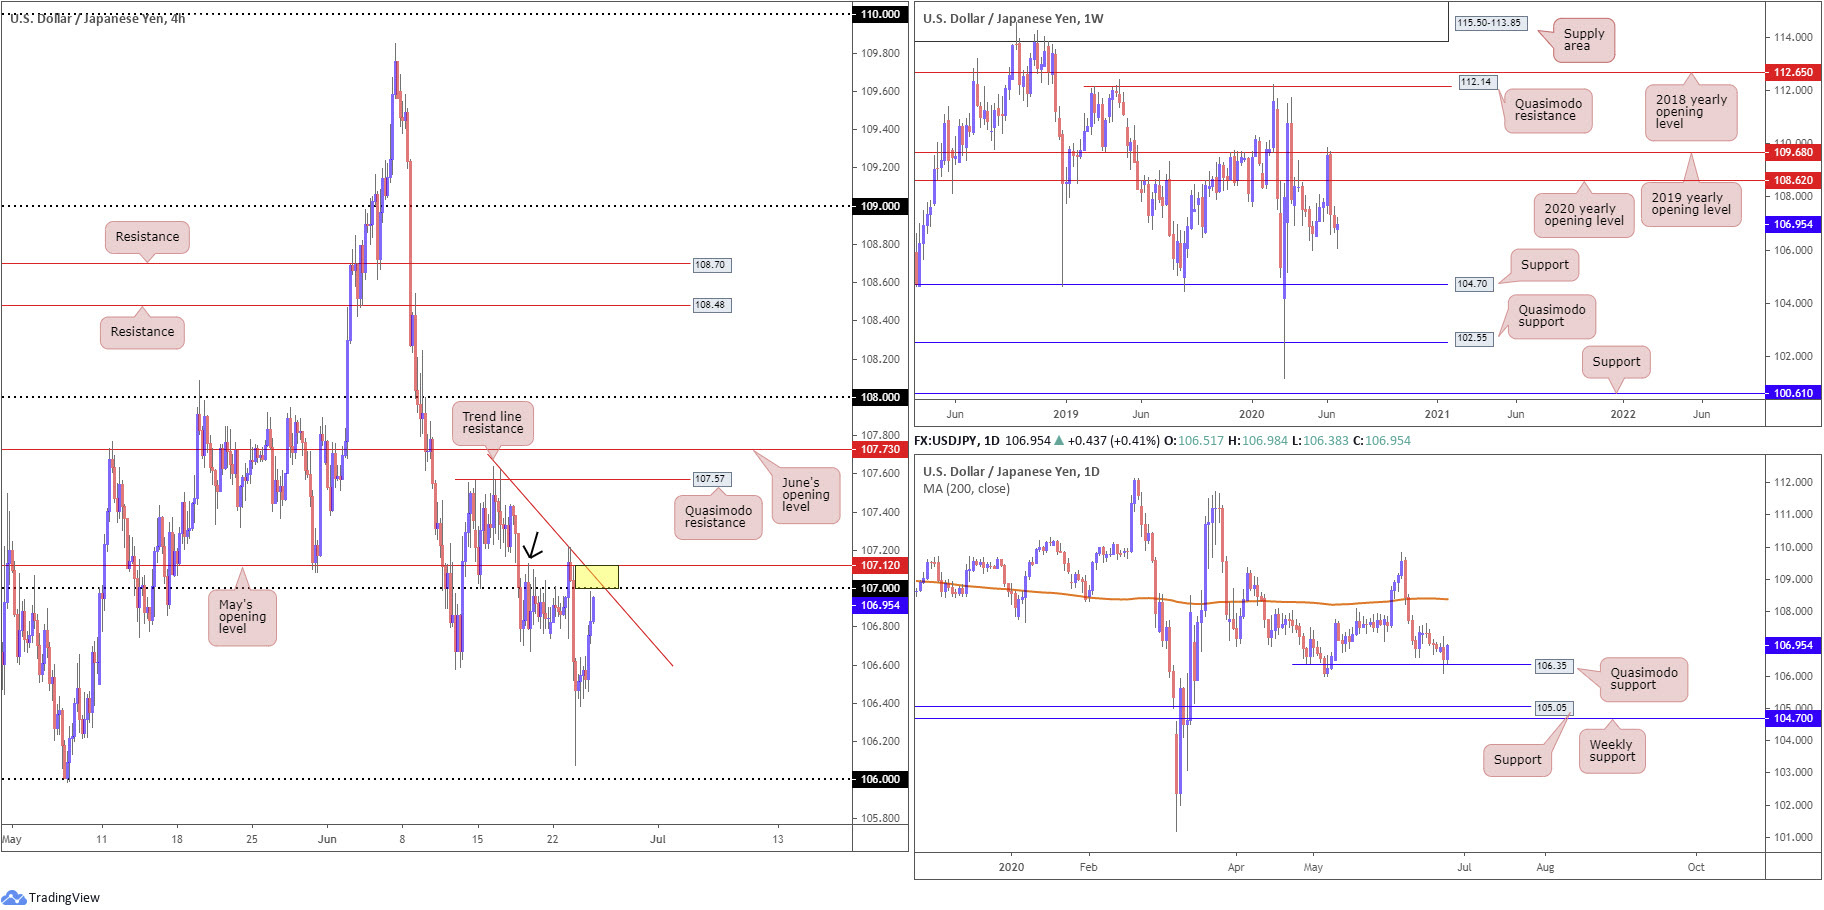
Daily Quasimodo support at 106.35 recently elbowed its way into the spotlight, bolstering Wednesday’s modest bid, along with the US dollar index adding some much-needed fuel, which held 97.00 into the close.
Focus on the H4 timeframe has shifted towards the 107 handle, a level merging closely with trend line resistance, taken from 107.62, and May’s opening level at 107.12. Price action traders will also acknowledge May’s opening level puts across a Quasimodo resistance as well (black arrow denotes left shoulder).
From the weekly timeframe, after rejecting the 2019 yearly opening level at 109.68 and voyaging through the 2020 yearly opening level at 108.62, current action appears to be finding a foothold ahead of the 105.98 6th May low (represents the low to the daily Quasimodo formation).
Areas of consideration:
The 107 handle on the H4 timeframe is likely of interest this morning, owing to its close connection with H4 trend line resistance and May’s opening level at 107.12 (yellow).
Conservative traders may seek additional confirmation before engaging from 107/107.12. Not only could a fakeout/whipsaw occur, the threat of further buying off daily Quasimodo support at 106.35 is certainly something to take into account.
USD/CAD:
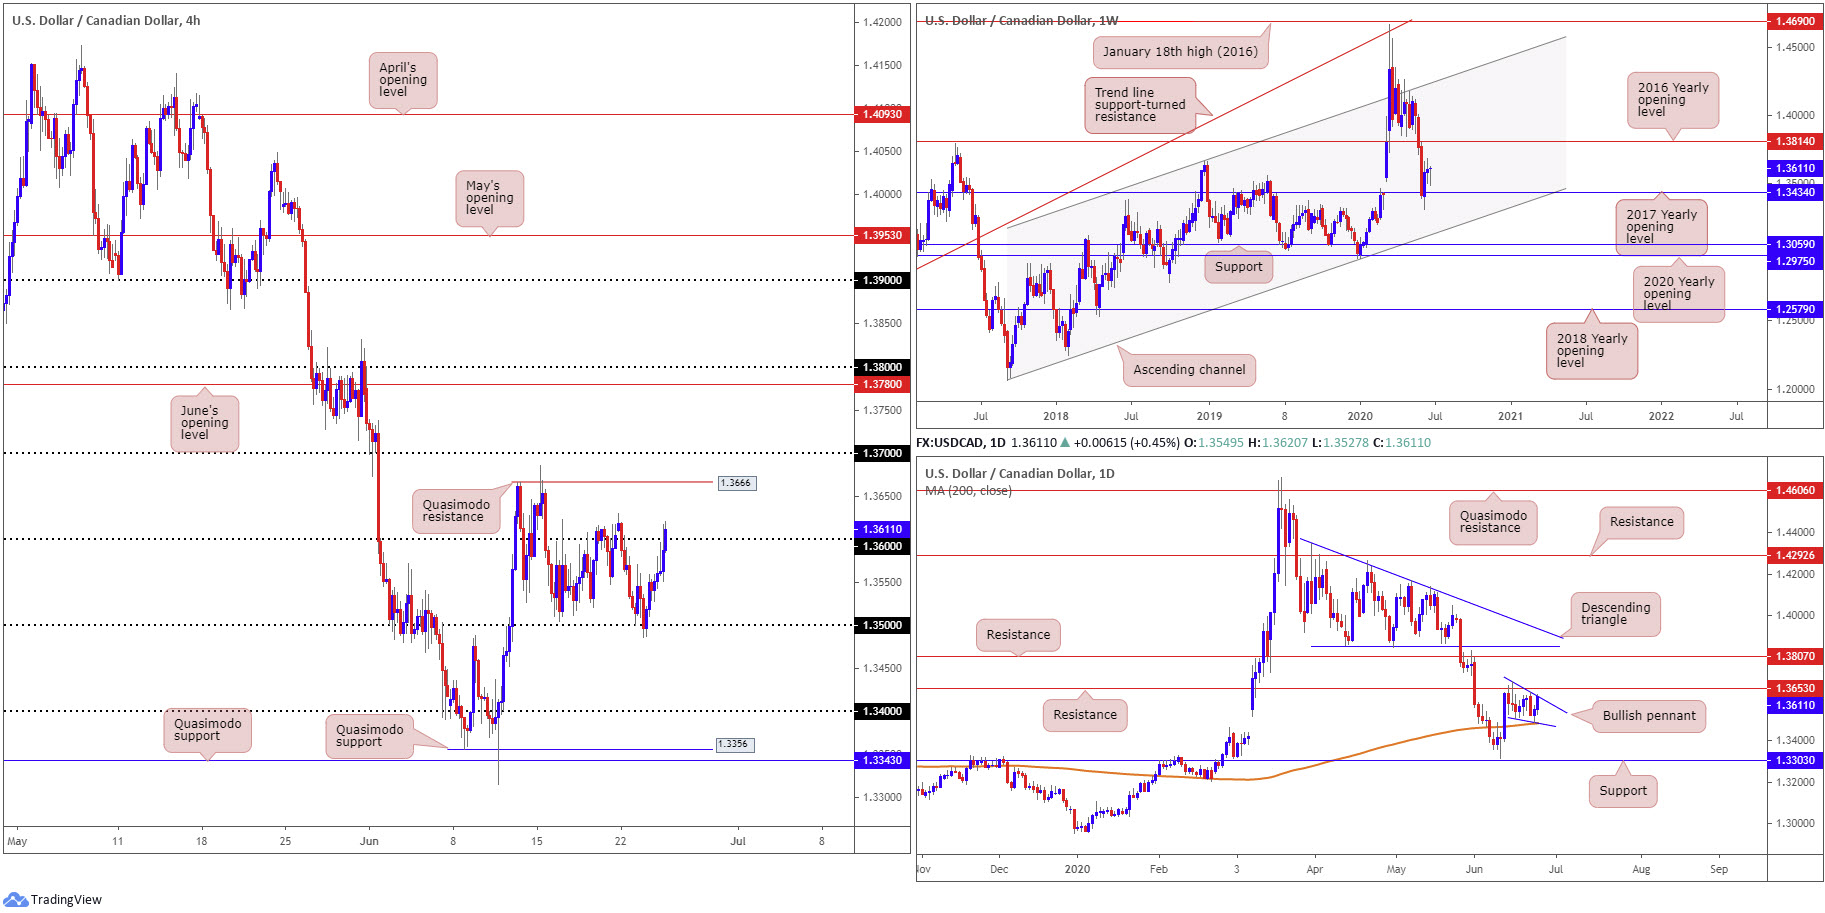
A stronger-than-expected dollar revival, as well as oil prices tanking sub $38.00/bbl, led USD/CAD to higher ground on Wednesday. In recent hours, price tested the mettle of 1.36, a level serving as relatively healthy resistance since mid-June.
H4 price finding acceptance above 1.36 shines the spotlight on Quasimodo resistance at 1.3666, with a break unmasking the 1.37 handle. An additional hurdle to consider, however, is daily resistance plotted at 1.3653.
Another constructive development on the daily timeframe is also the formation of a falling wedge (1.3686/1.3504). Although these patterns are best formed within clear uptrends, it’s still worth keeping an eye on this for an upside breakout.
The story on the weekly timeframe shows price action remains above the 2017 yearly opening level at 1.3434, echoing the possibility of an approach to the 2016 yearly opening level at 1.3814.
Areas of consideration:
Given current analysis, this appears to be a buyers’ market right now.
A H4 close above 1.36 may appeal to intraday buyers, favouring a run to daily resistance at 1.3653, followed by Quasimodo resistance at 1.3666.
Longer term, should we penetrate 1.37 to the upside, this could lay the foundation for an extension to the 1.38 handle, which comes together with daily resistance at 1.3807 and weekly resistance at 1.3814.
USD/CHF:
For those who read Wednesday’s technical briefing you may recall the following (italics):
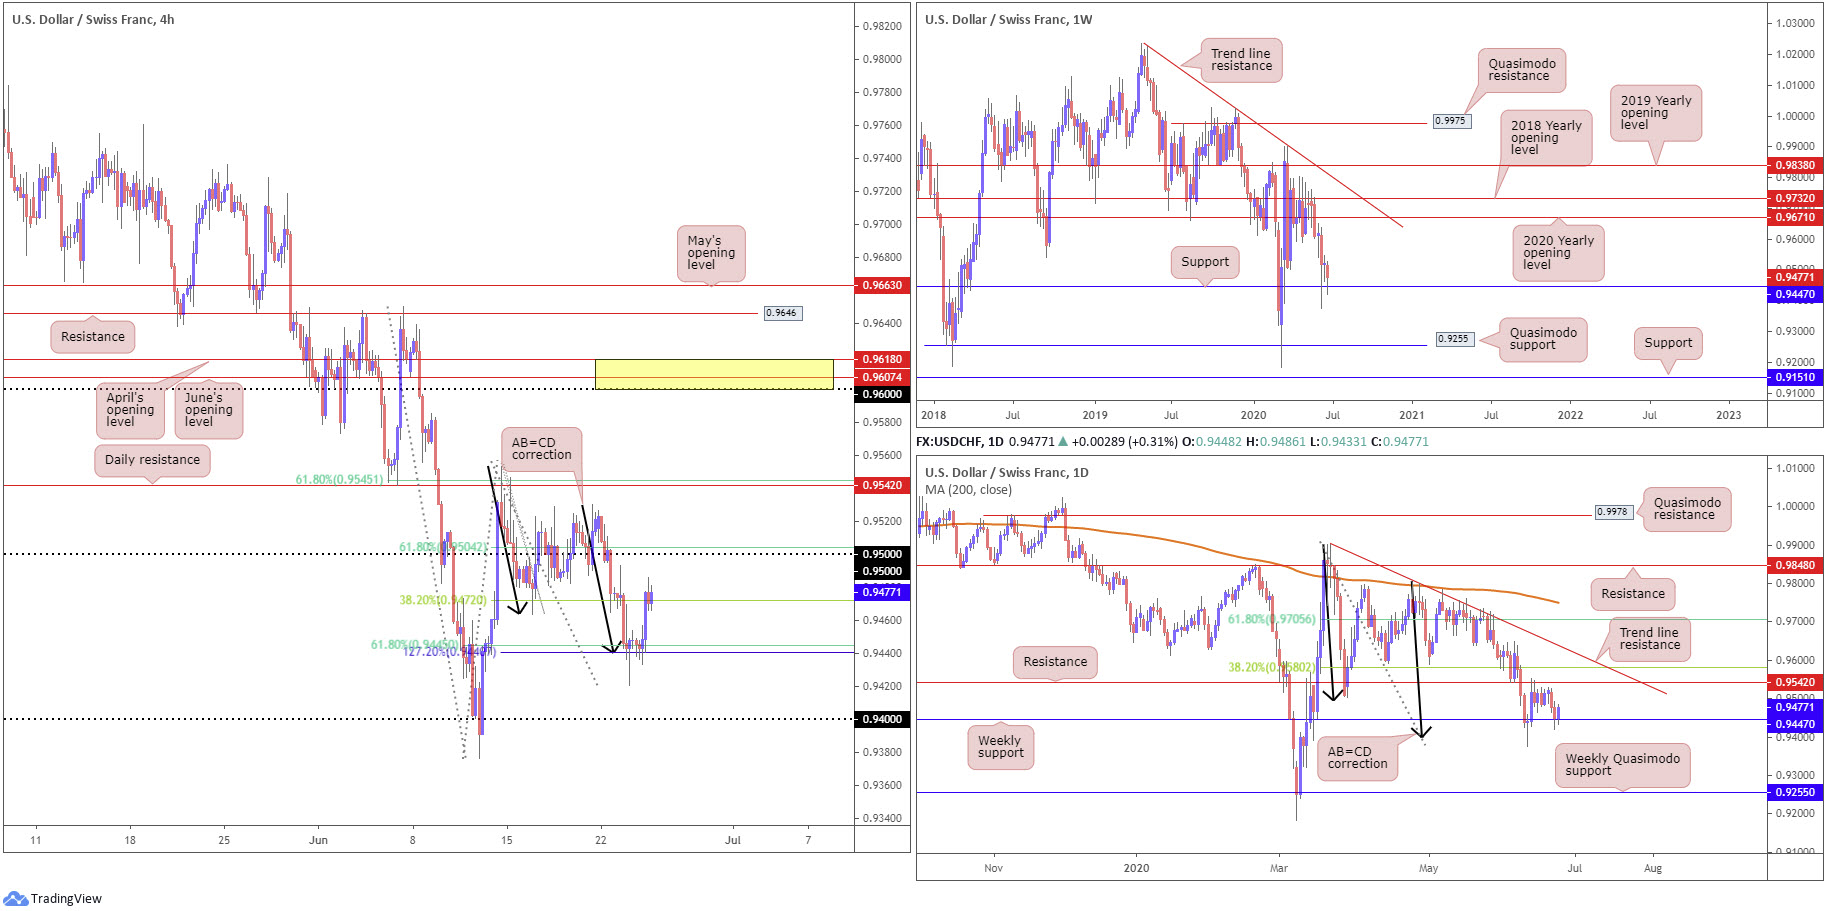
After brushing aside orders at 0.95 on the H4 Monday, the candles greeted 0.9440 Tuesday, comprised of an AB=CD correction (black arrows) at 0.9440, a 127.2% Fibonacci extension point also at 0.9440 and a 61.8% Fibonacci retracement ratio at 0.9445. Joining closely with our H4 AB=CD construction is weekly support coming in at 0.9447.
In view of weekly support bolstering the H4 AB=CD pattern around 0.9440, this area could be enough to spark a USD revival today. As for upside targets north of the zone, AB=CD traders will watch the 38.2% and 61.8% Fibonacci retracement ratios of legs A-D at 0.9472 and 0.9504, respectively (common targets out of AB=CD patterns).
As evident from the H4 timeframe this morning, the H4 AB=CD and weekly support combination proved strong Wednesday, sending H4 candles to the 38.2% Fibonacci retracement ratio at 0.9472.
Areas of consideration:
Traders long 0.9440 have likely reduced risk to breakeven at 0.9472, with eyes likely on the 0.95 handle/61.8% Fibonacci retracement ratio at 0.9504 as the next upside objective, followed by daily resistance at 0.9542.
Those who believe 0.95 will hit may consider drilling down to the lower timeframes today to seek buying opportunities off local structure. However, do ensure you keep risk/reward in mind.
The accuracy, completeness and timeliness of the information contained on this site cannot be guaranteed. IC Markets does not warranty, guarantee or make any representations, or assume any liability regarding financial results based on the use of the information in the site.
News, views, opinions, recommendations and other information obtained from sources outside of www.icmarkets.com.au, used in this site are believed to be reliable, but we cannot guarantee their accuracy or completeness. All such information is subject to change at any time without notice. IC Markets assumes no responsibility for the content of any linked site.
The fact that such links may exist does not indicate approval or endorsement of any material contained on any linked site. IC Markets is not liable for any harm caused by the transmission, through accessing the services or information on this site, of a computer virus, or other computer code or programming device that might be used to access, delete, damage, disable, disrupt or otherwise impede in any manner, the operation of the site or of any user’s software, hardware, data or property.


