
Key risk events today:
RBA Gov Lowe Speaks; Spanish Unemployment Rate; German Ifo Business Climate; Euro Main Refinancing Rate and Monetary Policy Statement; ECB Press Conference; US Core Durable Goods Orders m/m; US Durable Goods Orders m/m.
EUR/USD:
Flash manufacturing PMIs out of Europe disappointed Wednesday, encouraging marginal losses. All in all, though, the market concluded the day range bound as losses were swiftly pared. Today, however, we have the all-important European Central Bank (ECB) interest rate decision to contend with. The ECB is expected to keep rates on hold but traders will likely look to see if the central bank alters its guidance and that is where the movement will likely develop from.
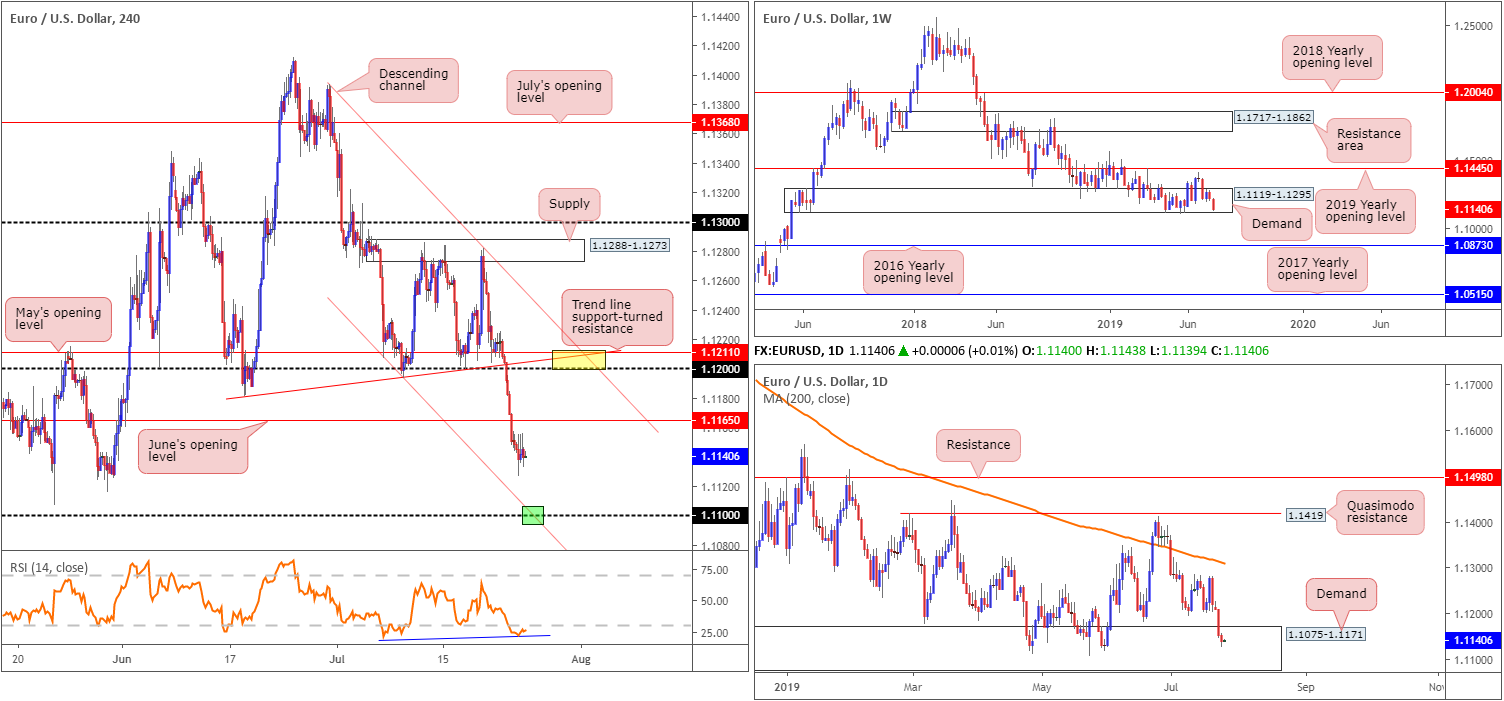
Technically, traders’ crosshairs are possibly fixed on June’s opening level at 1.1165 as the next port of resistance on the H4 timeframe, while to the downside we have the 1.11 handle that aligns with channel support (green) taken from the low 1.1232. In addition to 1.1165, traders may also want to acknowledge the zone marked in yellow between May’s opening level at 1.1211 and the 1.12 handle, which also intersects with a trend line support-turned resistance (extended from the low 1.1181) and a channel resistance (taken from the high 1.1392).
On a wider perspective, long-standing weekly demand at 1.1119-1.1295 recently come under increasing pressure, with a break of its lower edge potentially in store. The next support can be seen around the 2016 yearly opening level at 1.0873. A closer reading of price action on the daily timeframe reveals the unit is treading water within the walls of demand at 1.1075-1.1171, which is glued to the underside of the current weekly demand area.
Areas of consideration:
Considering yesterday’s lacklustre performance, much of Wednesday’s outlook remains valid:
The zone marked in yellow between May’s opening level at 1.1211 and the 1.12 handle, which also intersects with a trend line support-turned resistance (extended from the low 1.1181) and a channel resistance (taken from the high 1.1392) is of interest for potential selling opportunities on the H4 timeframe. However, before reaching the said zone, June’s opening level at 1.1165 may serve as resistance and force price action towards the 1.11 neighbourhood. For that reason, should the H4 candles chalk up a notable bearish candlestick configuration at 1.1165 today, a short from here is also a consideration (entry/risk can be determined according to the candlestick’s structure).
In terms of long opportunities, the research team particularly favours the point (green) at which 1.11 converges with channel support (etched from the low 1.1207) on the H4. Here, longer-term flow trades marginally beneath weekly demand, though is still within the parapets of daily demand. Conservative traders may opt to wait and see if a bullish candlestick formation develops before pulling the trigger.
GBP/USD:
Sterling, a clear G10 outperformer Wednesday, advanced from European session lows and aggressively shook hands with the 1.25 mid-way through London. The rally received additional impetus in the wake of a modest dollar pullback from weekly resistance at 97.72 (US dollar index). Despite this, in response to a cabinet reshuffle taking place following Boris Johnson officially becoming UK PM, upside momentum diminished and concluded the day sub 1.25.
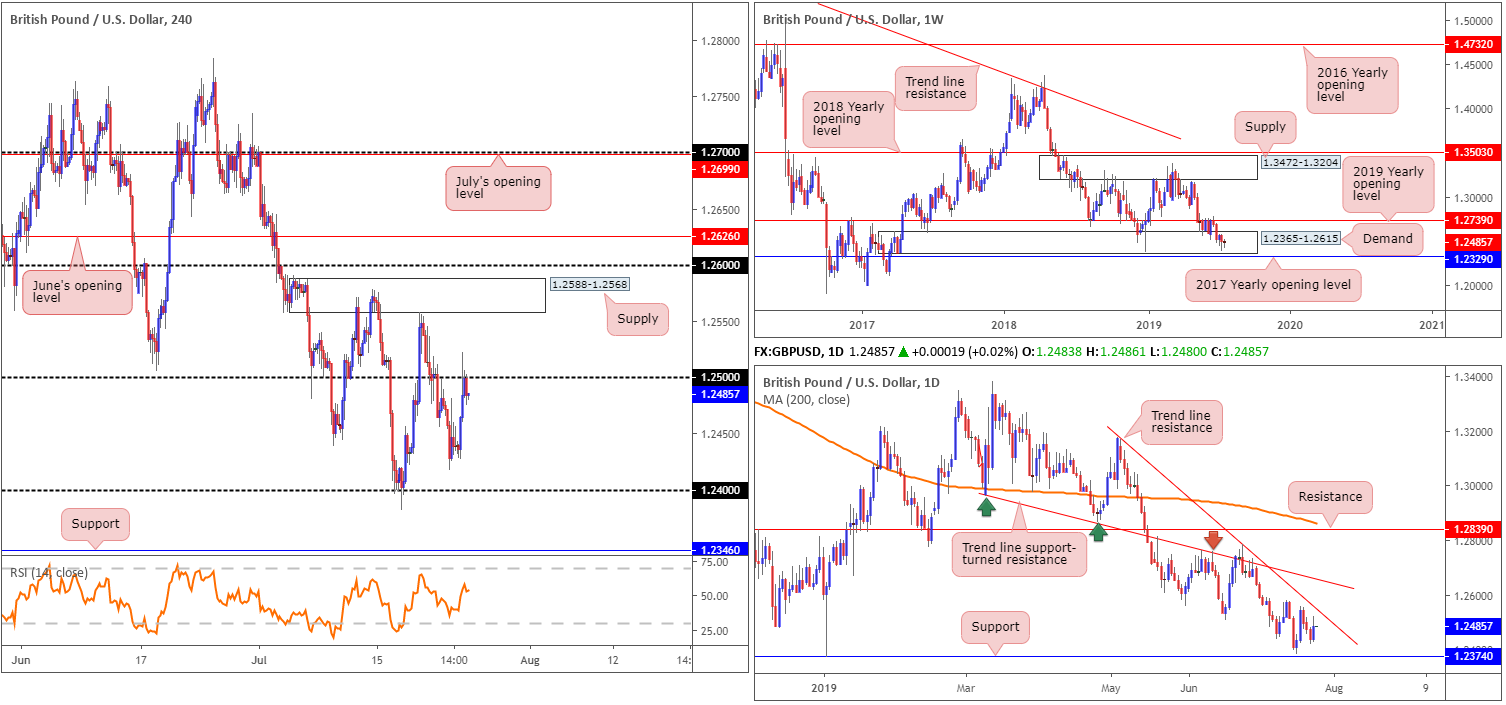
While price action knocks on 1.25’s door for a potential sell this morning, it might be worth noting the H4 supply plotted overhead at 1.2588-1.2568. This area has not only proven itself a worthy contender in terms of resistance throughout the month, it also coincides with a daily trend line resistance (extended from the high 1.3176).
The story on the weekly timeframe shows long-standing demand at 1.2365-1.2615 remains in the fold, though is struggling to chalk up anything meaningful to the upside. Traders, therefore, may want to note the 2017 yearly opening level at 1.2329 as the next possible support.
Areas of consideration:
According to the technical studies presented here, additional downside is likely on the cards. However, selling from 1.25 is considered chancy given the more appealing area of H4 supply lurks a few points north around 1.2588-1.2568, which boasts higher-timeframe confluence.
Therefore, the said supply area is the central focus for shorts going forward. Traders are urged to wait for additional H4 candlestick confirmation before pulling the trigger (entry and risk levels can be determined according to this structure), as the possibility of a fakeout materialising to 1.26 is certainly there.
AUD/USD:
The Australian dollar declined vs. the US dollar for a fourth consecutive session Wednesday, following softer CBA PMI surveys and a dovish outlook from Westpac.
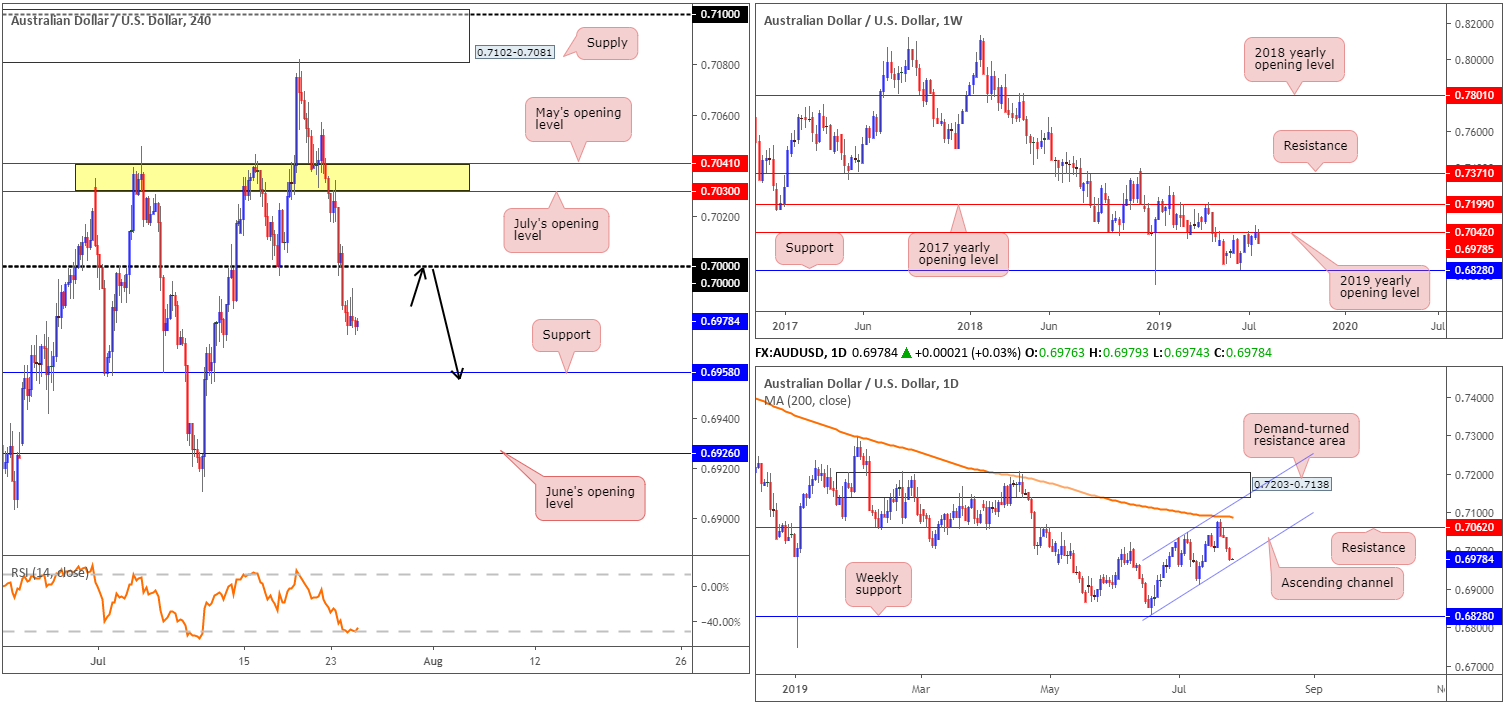
Technically speaking, the H4 candles traded within a choppy band in recent movement, though did produce a number of notable selling wicks. Overhead, the key figure 0.70 remains in sight as possible resistance, while support falls in around the 0.6958 neighbourhood.
As underlined in Wednesday’s briefing, higher-timeframe flow has weekly activity crossing paths with the 2019 yearly opening level (resistance) at 0.7042. Having seen this base serve well as support on several occasions in the past and hold price action lower early July, active selling from here is not a surprise. The next downside support target can be seen at 0.6828.
From the daily timeframe, we can see the unit approaching potential support in the form of a channel formation etched from the low 0.6831. Note this ascending support aligns reasonably closely with the H4 support level mentioned above at 0.6958.
Areas of consideration:
Having the weekly timeframe propose further downside, and H4 price also displaying room to manoeuvre lower, a retest at 0.70 as resistance, preferably in the form of a bearish candlestick pattern as this helps position entry and risk levels, could be seen today, targeting H4 support at 0.6958. Ideally, a test of the aforementioned daily channel support is unwelcomed before 0.70 re-enters the fight as this may force the unit beyond 0.70 to daily resistance at 0.7062.
USD/JPY:
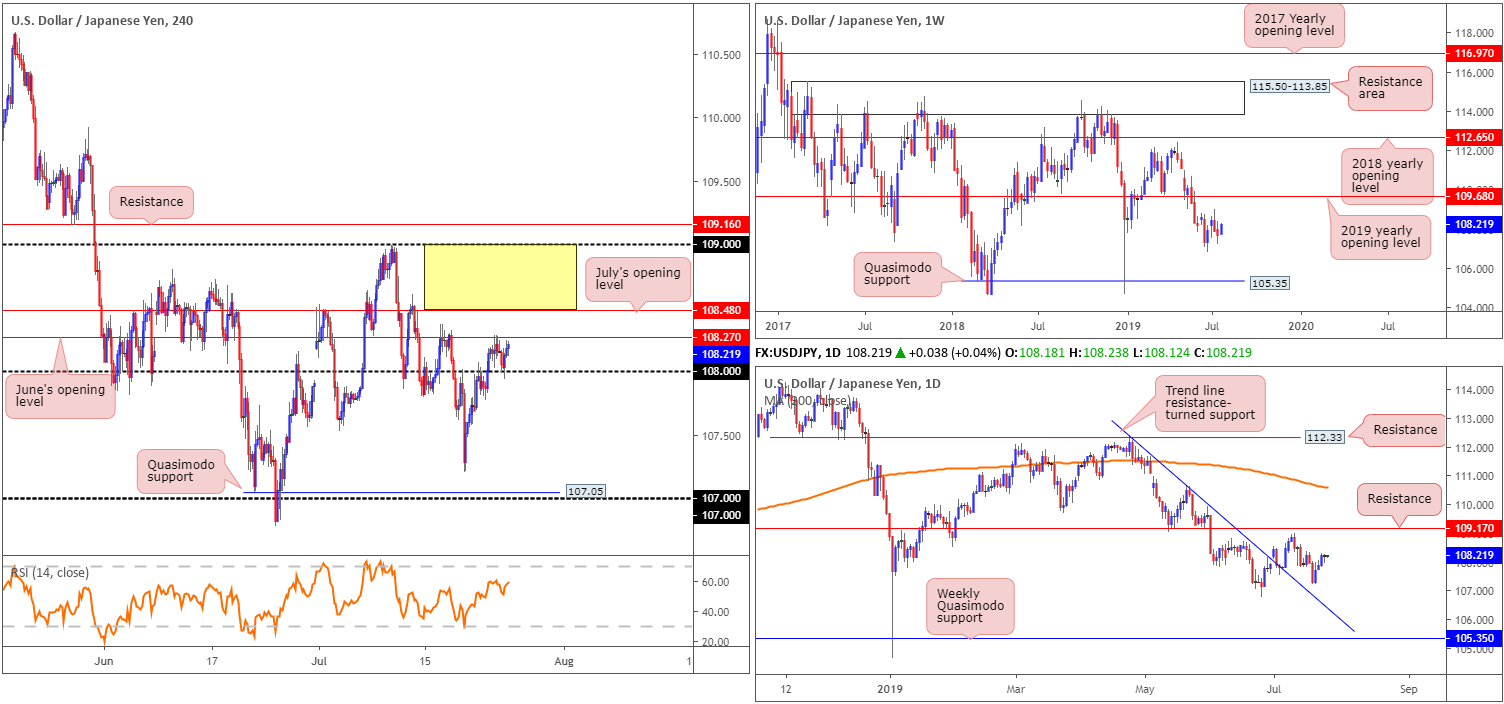
The USDJPY mildly reversed three days’ worth of gains Wednesday, briefly slipping beneath the 108.00 handle in the process. On the whole, though, the pair wrapped up the session unchanged, confined within a tight range on the H4 timeframe between 108 and June’s opening level at 108.27. Overhead, another layer of resistance resides close by at July’s opening level drawn from 108.48, while beyond here (the yellow area), we appear to have some room to manoeuvre towards the 109 handle, closely shadowed by resistance at 109.16.
Unchanged from Wednesday’s outlook, daily action reveals its next upside target sets around 109.17, a point higher than H4 resistance highlighted above. To the downside, the 106.78 June 25 low may offer support, closely followed by trend line resistance-turned support (extended from the high 112.40) and then the weekly Quasimodo support at 105.35.
Areas of consideration:
Taken from Wednesday’s analysis, given the lacklustre performance of late:
Higher-timeframe structure on the USD/JPY displays room to explore higher ground. On account of this, long opportunities exist above 108.48 on the H4, targeting 109/109.16. A retest of 108.48 as support is likely welcomed confirmation (entry and risk can be determined according to the rejecting candlestick’s structure).
Upon connecting with 109, traders are urged to close any long positions and consider selling. The round number, coupled with H4 resistance at 109.16 and daily resistance at 109.17, provides traders a strong ceiling in which to short. Traders concerned by the possibility of a fakeout materialising through 109 have the option of waiting and seeing if a H4 bearish candlestick develops before initiating a position. This way, seller intent is visible and entry and risk levels are structured.
USD/CAD:
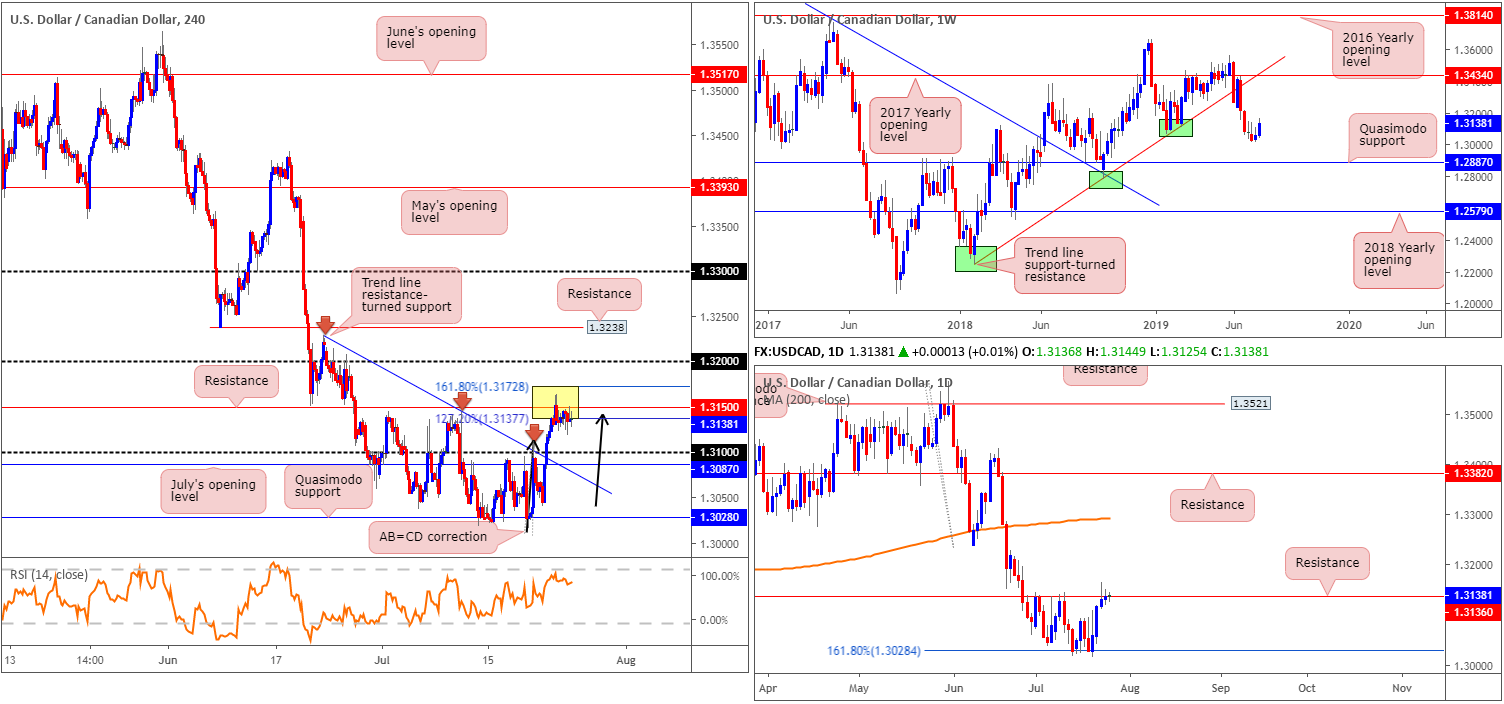
Since Tuesday, the USD/CAD entered a tight phase of consolidation within an interesting area of H4 resistance between the 161.8% and 127.2% Fibonacci ext. points at 1.3172/1.3137 (yellow). Despite a drop in oil prices, dialled back Fed expectations keeps upside limited here.
For those who read previous reports you may recall the research team highlighted 1.3172/1.3137 as a potential sell zone. Formed by way of a H4 AB=CD approach, a H4 resistance at 1.3150, daily resistance at 1.3136 and the H4 RSI nearing its overbought value, this area managed to hold price action firm into the close.
Areas of consideration:
Previous reports also went on to say:
The research team favours a reaction from the H4 AB=CD reversal zone at 1.3172/1.3137, given its local and higher-timeframe confluence. Entry at the H4 resistance plotted within at 1.3150 is likely eyed, with a protective stop-loss order plotted a couple of points above 1.3172. Considering the first take-profit target, the 1.31 handle is likely to be problematic for sellers, as is July’s opening level at 1.3087 and the intersecting trend line resistance-turned support (1.3229).
For those short from 1.3150, well done. You remain in the green as we enter Thursday’s session, with the expectation of a descent towards 1.31.
USD/CHF:
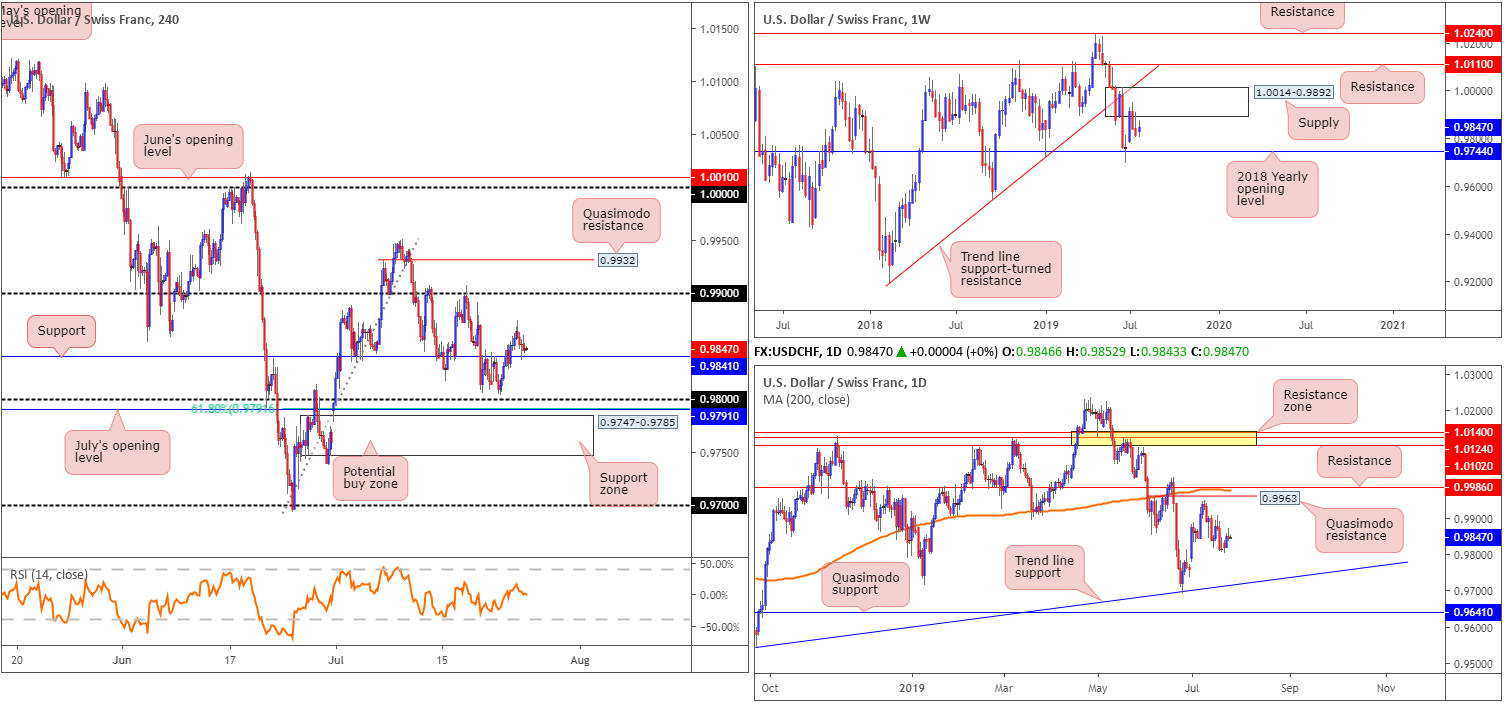
For traders who read Wednesday’s briefing you may recall the piece highlighting a potential retest at H4 support coming in from 0.9841, preferably in the shape of a bullish candlestick configuration as this aids entry and risk placement. As is evident from the H4 timeframe this morning, price did indeed retest 0.9841 and produce a half-hearted hammer candlestick formation.
Despite this, price action is struggling to produce much in terms of an upside presence, leaving targets at the lower edge of weekly supply at 0.9892, followed by the 0.99 handle, unlikely to enter the fold.
In terms of higher-timeframe action, limited change is visible:
From the weekly timeframe, the US dollar surrendered another portion of recent gains off the 2018 yearly opening level at 0.9744 last week, following a rotation lower out of supply at 1.0014-0.9892 by way of a strong bearish selling wick. While this could lead to a revisit of 0.9744, traders may also find use in noting the trend line support-turned resistance (extended from the low 0.9187), closely followed by resistance at 1.0110, should we turn higher this week.
Daily timeframe:
Closer examination of price action on the daily timeframe shows the unit pressing south after failing to test Quasimodo resistance at 0.9963 early July, followed closely by resistance at 0.9986 and the 200-day SMA (orange). To the downside, limited support is in view until reaching trend line support taken from the low 0.9542.
Areas of consideration:
In the event things turn sour and we crack lower, 0.98 will then be in focus for potential longs. Given nearby confluence resting at July’s opening level at 0.9791 and a 61.8% Fibonacci ratio as well as a support area at 0.9747-0.9785, stop-loss placement is best positioned beneath the said support area.
Dow Jones Industrial Average:
Despite mixed earnings and economic data, the S&P 500 and Nasdaq stock indexes closed at record highs Wednesday, though the Dow concluded lower after disappointing earnings from Boeing and Caterpillar. The Dow Jones Industrial Average declined 0.29%; the S&P 500 advanced 0.47% and the tech-heavy Nasdaq 100 rallied 0.70%.
Technically speaking on the Dow’s charts, however, the candlesticks remain trading within striking distance of record highs at 27388. Wednesday’s report aired the following regarding the higher timeframes:
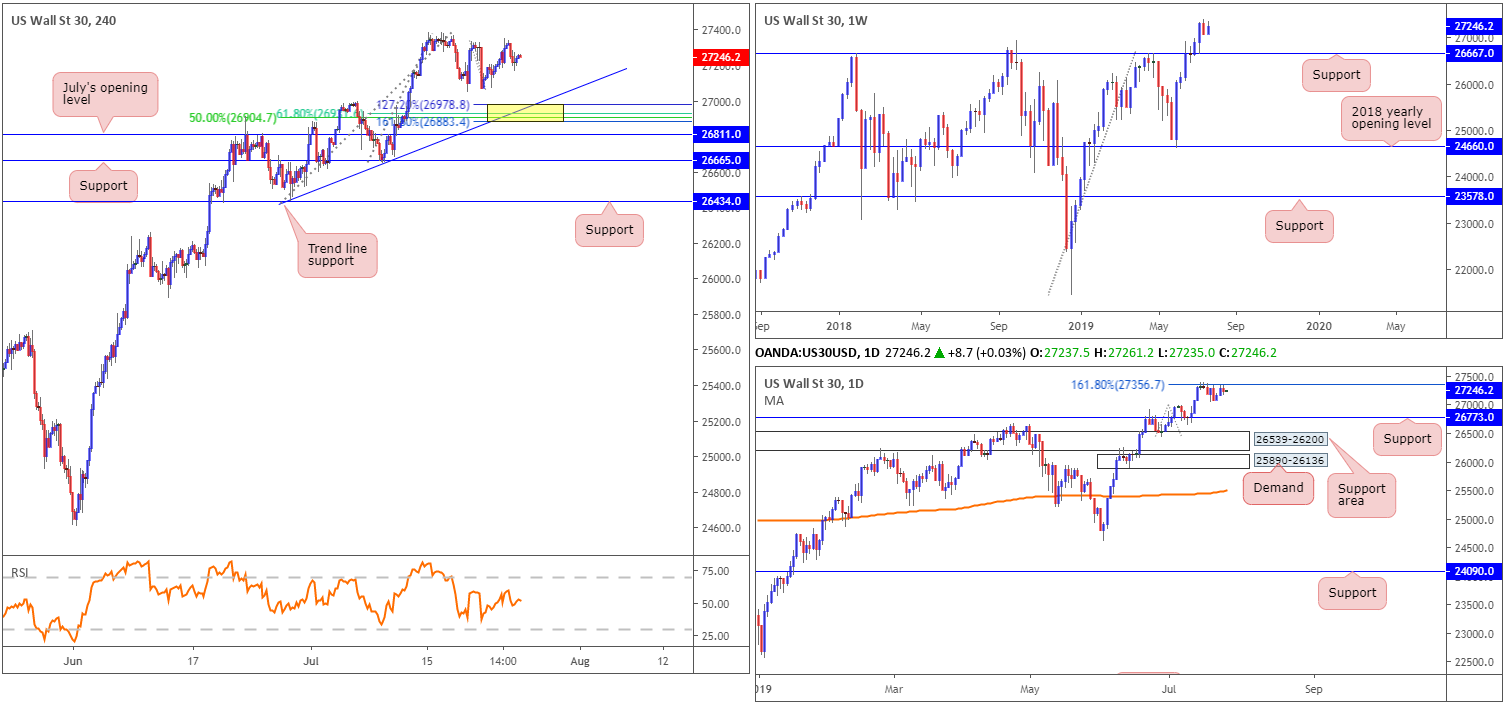
While weekly price displays room to extend gains to 28070 (not visible on the screen), a 127.2% Fibonacci ext. point taken from the low 21425, daily movement is defending the underside of 27356: the 161.8% Fibonacci ext. point. Continued selling from here has a downside support target set at 26773, located just north of weekly support at 26667.
In terms of H4 flow, also voiced within Wednesday’s briefing, the yellow area marked between the 161.8% and 127.2% Fibonacci ext. points at 26883/26978 is still an option for longs in the event price action dips lower. Note this area merges with a trend line support (taken from the low 26436), a 61.8% Fibonacci retracement at 26930 and a 50.0% support value at 26904.
Areas of consideration:
In view of the ranging motion visible at the moment, the research team’s outlook remains unchanged as we head into Thursday’s sessions:
Should the index shake hands with H4 trend line support and merging Fibonacci levels (see above), a long could be considered, with a stop-loss order fixed beneath 26883. The first take-profit target from this point will depend on the approach, but overall the research team have 27356 on the daily timeframe in sight.
If the unit continues pushing for record highs and engulfs daily resistance at 27356, a long on the retest of this barrier is also an option, targeting the weekly resistance level underlined above at 28070.
XAU/USD (GOLD):
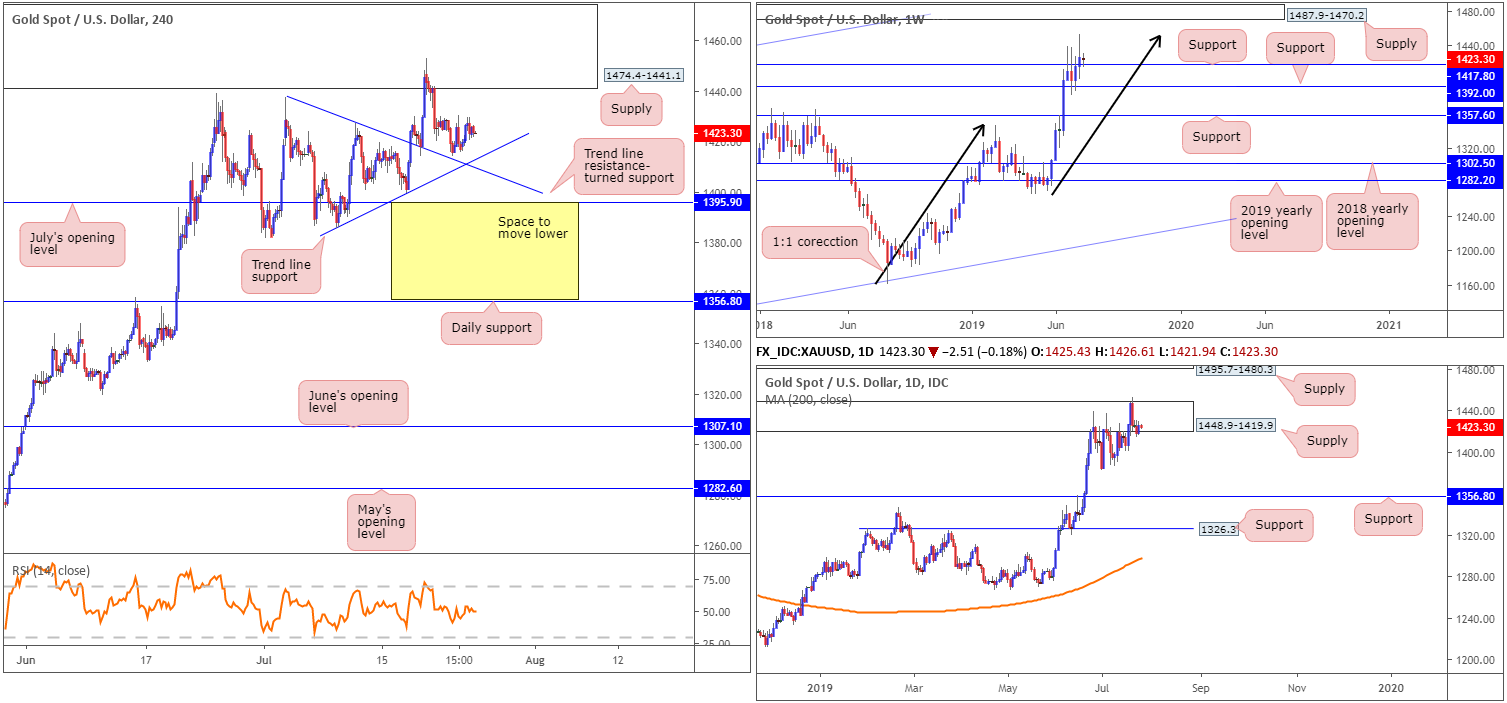
Over the past couple of days movement has been somewhat limited in the gold market. In dollar terms, price ranged no more than $13 and remains capped between a rather humongous H4 supply area at 1474.4-1441.1 and a trend line support extended from the low 1385.5. Beyond here, H4 structure offers another layer of trend line support (prior resistance) taken from the high 1437.7 and July’s opening level at 1395.0.
Weekly structure, as highlighted in Monday’s weekly briefing, crossed paths with a 1:1 correction (black arrows) around 1453.2 shaped from the 1160.3 August 13 low last week. As is evident from the chart, selling has been reasonably strong from 1453.2, though has so far been unable to reclaim 1417.8 – the next downside support on the weekly timeframe.
The technical landscape on the daily timeframe, also aired within Monday’s weekly report, observed a break of the top edge of a supply zone at 1448.9-1419.9 late last week. While this move was likely enough to trip a portion of the stop-loss orders above here, it’s unlikely to have cleared the path north to supply at 1495.7-1480.3. As for downside targets on this scale, the research team notes to be aware of the 1381.9 July 1 low, followed by support at 1356.8.
Areas of consideration:
Although weekly price is selling off from its 1:1 correction point at 1453.2, weekly support is also in motion at 1417.8. This weekly support – coupled with the nearby H4 trend line support mentioned above (1385.5) – is an area buyers may be looking to get involved in. Conservative traders, threatened by recent selling, however, might opt to wait and see if a H4 bullish candlestick configuration develops before pulling the trigger. This helps recognise buyer intent and provides traders with entry and risk levels to work with. In terms of upside targets, the current H4 supply is a logical starting point.
The accuracy, completeness and timeliness of the information contained on this site cannot be guaranteed. IC Markets does not warranty, guarantee or make any representations, or assume any liability regarding financial results based on the use of the information in the site.
News, views, opinions, recommendations and other information obtained from sources outside of www.icmarkets.com.au, used in this site are believed to be reliable, but we cannot guarantee their accuracy or completeness. All such information is subject to change at any time without notice. IC Markets assumes no responsibility for the content of any linked site.
The fact that such links may exist does not indicate approval or endorsement of any material contained on any linked site. IC Markets is not liable for any harm caused by the transmission, through accessing the services or information on this site, of a computer virus, or other computer code or programming device that might be used to access, delete, damage, disable, disrupt or otherwise impede in any manner, the operation of the site or of any user’s software, hardware, data or property.


