
EUR/USD:
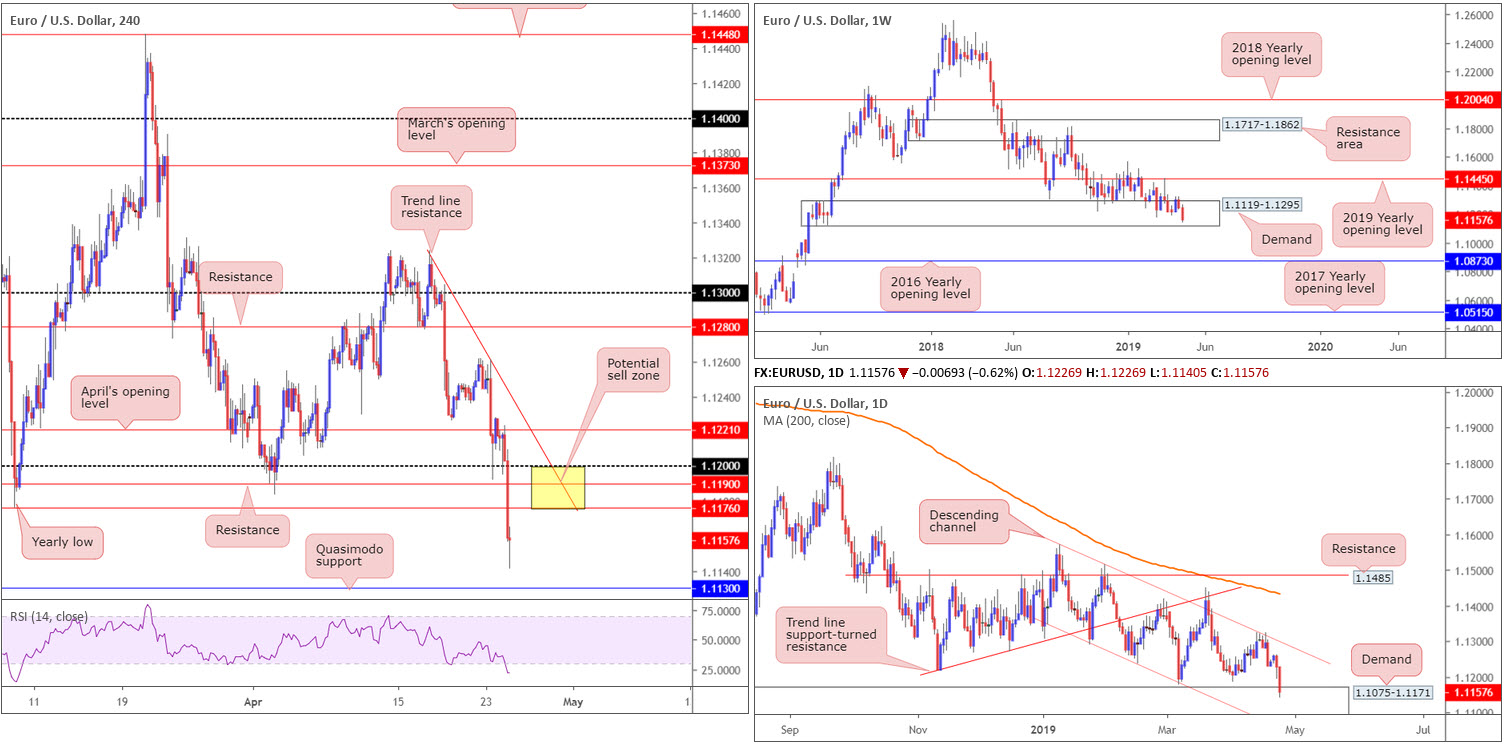
Starved of support, the single currency fell sharply vs. its US counterpart Wednesday, down 0.77% as of writing. Capital continued to bolster the US dollar, forcing the dollar index, or ‘DXY’, above weekly resistance at 97.72 to fresh 2019 highs of 98.19. The euro was also affected by the move in German bonds and weaker-than-expected German IFO survey data. The 10-year fell to negative territory, consequently widening the gap against the US 10-year note.
Recording its second consecutive daily loss, EUR/USD’s weekly buyers appear to be losing grip of a reasonably long-standing weekly demand area at 1.1119-1.1295. A break of the area to the downside has the 2016 yearly opening level at 1.0873 to target. Daily activity, on the other hand, shook hands with demand priced in at 1.1075-1.1171 (glued to the underside of the current weekly demand area).
A closer reading of price action on the H4 timeframe witnessed a number of supports taken out as a result of yesterday’s selloff, most prominent being the 2019 low at 1.1176. Quasimodo support plotted at 1.1130 is next on tap, whereas to the upside, resistance rests around the 2019 low and nearby resistance at 1.1190 as well as the 1.12 handle.
Areas of consideration:
Although the majority of the market appear to be sellers at the moment, technical structure on both the weekly and daily timeframes emphasise demand. Trend analysis, however, shows the market has been trending south since early 2018 (see weekly chart).
With the above information on board, traders are likely looking for shorts within the yellow zone marked on the H4 timeframe at 1.12/1.1176 (comprised of the 1.12 handle, resistance at 1.1190 and the yearly low at 1.1176), targeting H4 Quasimodo support at 1.1130 as the initial support. Note 1.12/1.1176 also intersects closely with a H4 trend line resistance (taken from the high 1.1323).
Today’s data points: Spanish Unemployment Rate; US Core Durable Goods Orders m/m; US Durable Goods Orders m/m; US Unemployment Claims.
GBP/USD:
As UK lawmakers return from their Easter breaks, the government’s cross-party talks with opposition Labour party appeared to be deteriorating, with reports suggesting talks were close to collapsing.
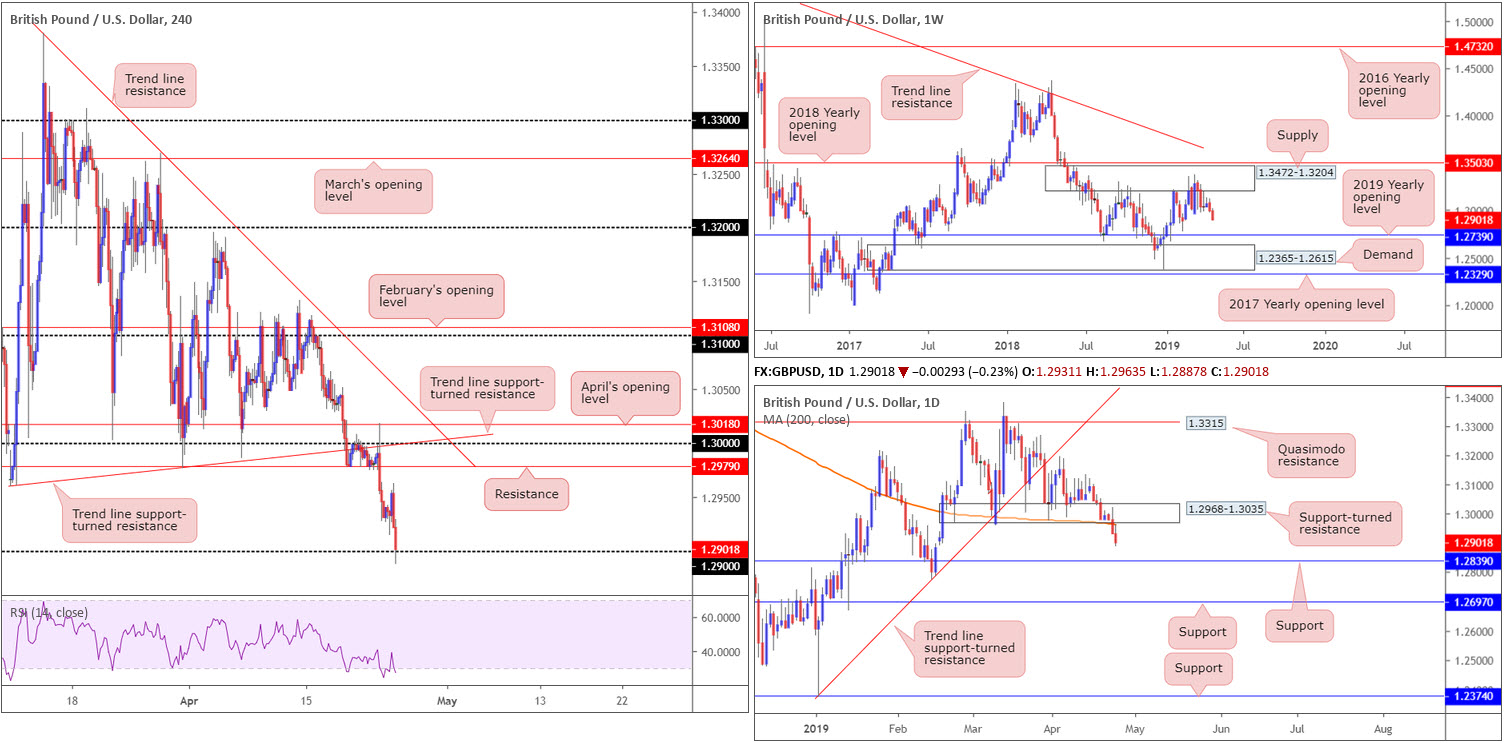
Technically, sterling nudged its way to lower ground Wednesday as the US dollar reigned supreme, refreshing 2019 highs at 98.19. In recent hours, the H4 candles shook hands with its 1.29 handle and, so far, appears to be holding ground. The RSI indicator is also seen testing oversold waters.
Further selling could be on the cards according to the weekly timeframe. Higher-timeframe flows has weekly movement threatening lower prices, after spending nearly two months consolidating around the underside of supply at 1.3472-1.3204, situated a few points south of the 2018 yearly opening level at 1.3503. With the next obvious downside target not realised on this timeframe until the 2019 yearly opening level at 1.2739, followed by demand coming in at 1.2365-1.2615, sellers still have plenty of room to manoeuvre if they press lower.
In conjunction with weekly flow, daily price recently crossed beneath its 200-day SMA (orange) and also overthrew a block of support coming in at 1.2968-1.3035 (now acting resistance). This has potentially set the stage for a run towards support at 1.2839. Note this daily support is also considered the next downside target on the H4 timeframe beyond 1.29.
Areas of consideration:
Things are not looking too promising for the buyers at this point. A long from 1.29 on the H4 timeframe, given the surrounding picture, is precarious and probably best avoided, according to our technical studies.
As for selling, a H4 close below 1.29 that’s followed up with a retest in the shape of a H4 bearish candlestick pattern would be ideal (entry and risk parameters can be determined according to this pattern), targeting 1.2839.
Today’s data points: US Core Durable Goods Orders m/m; US Durable Goods Orders m/m; US Unemployment Claims.
AUD/USD:
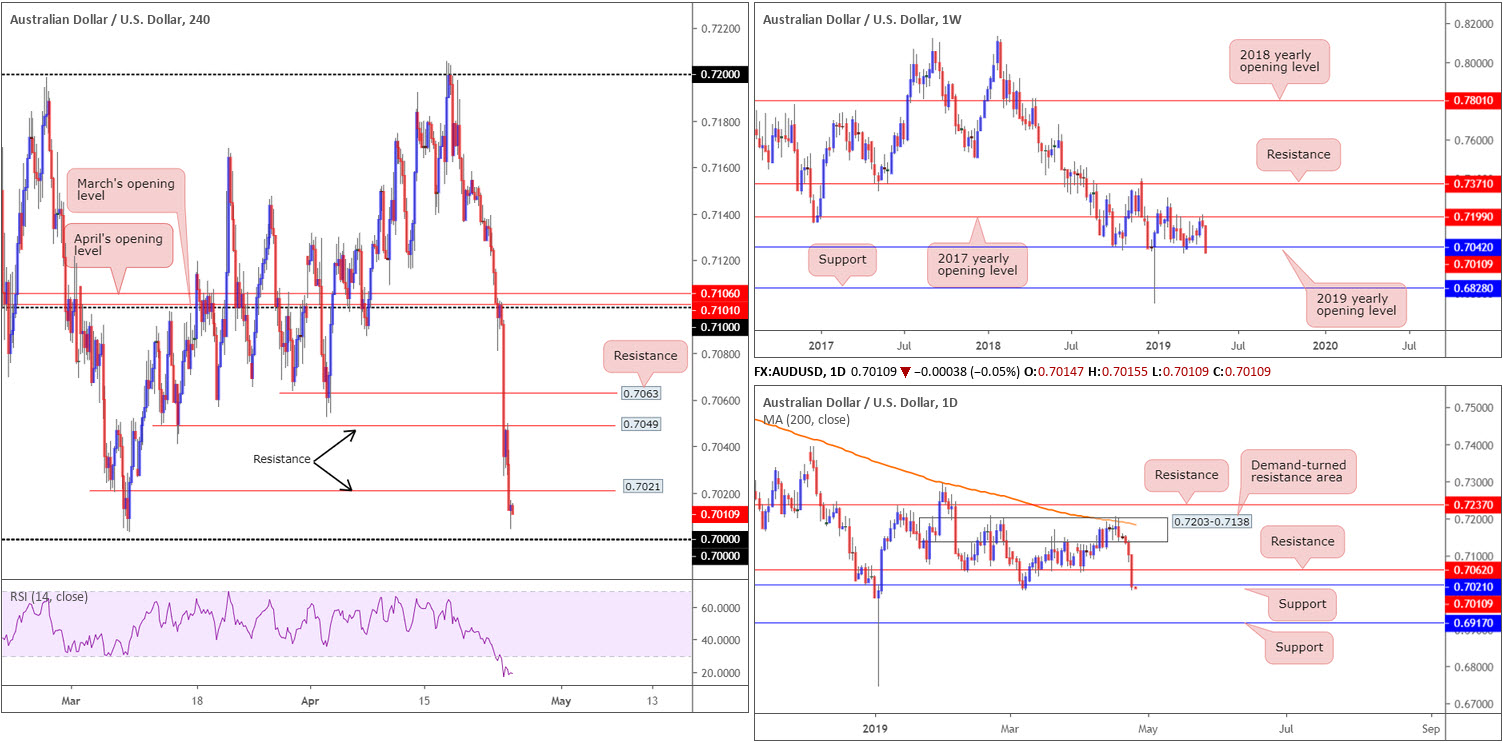
After retesting the underside of 0.71 on the H4 timeframe, early Asia witnessed price action fall sharply Wednesday. According to the Australian Bureau of Statistics, CPI q/q remained flat at 0.0%, below the 0.5% advance in the final quarter of 2018. The trimmed mean measures of inflation were also disappointing, up by just 0.3% q/q and by 1.6% y/y. This, alongside the dollar dipping its toe above 98.00 on the US dollar index, collectively weighed on the Australian dollar, down 1.24% on the day.
Thanks to recent selling, the 2019 yearly opening level on the weekly timeframe at 0.7042 is suffering. A close below this level may call for further downside in the direction of support at 0.6828. By the same token, daily movement recently crossed below support priced in at 0.7021, potentially unlocking the door towards support drawn from 0.6917.
H4 action, as is evident from the chart, settled for the day a few points north of key figure 0.70. While this level is likely garnering attention from both sides of the market, overhead resistance is plotted nearby at 0.7021 on the H4 timeframe. Beyond 0.70, the research team sees little in terms of support until the aforementioned daily support, followed closely by 0.69.
Areas of consideration:
0.70 is clearly a level worth keeping an eyeball on today, either as support to fade or as a breakout play for lower levels. With higher-timeframe support echoing a fragile tone right now, the latter appears more of a reasonable approach. Ultimately a breakout seller has two options. Either sell the breakout candle or wait and see if a correction/retest is seen. The latter is the more conservative route. A H4 close below 0.70 that’s followed up with a retest in the shape of a H4 bearish candlestick pattern would be ideal (entry and risk parameters can be determined according to this pattern), targeting 0.6917 as the initial take-profit zone.
Today’s data points: US Core Durable Goods Orders m/m; US Durable Goods Orders m/m; US Unemployment Claims.
USD/JPY:
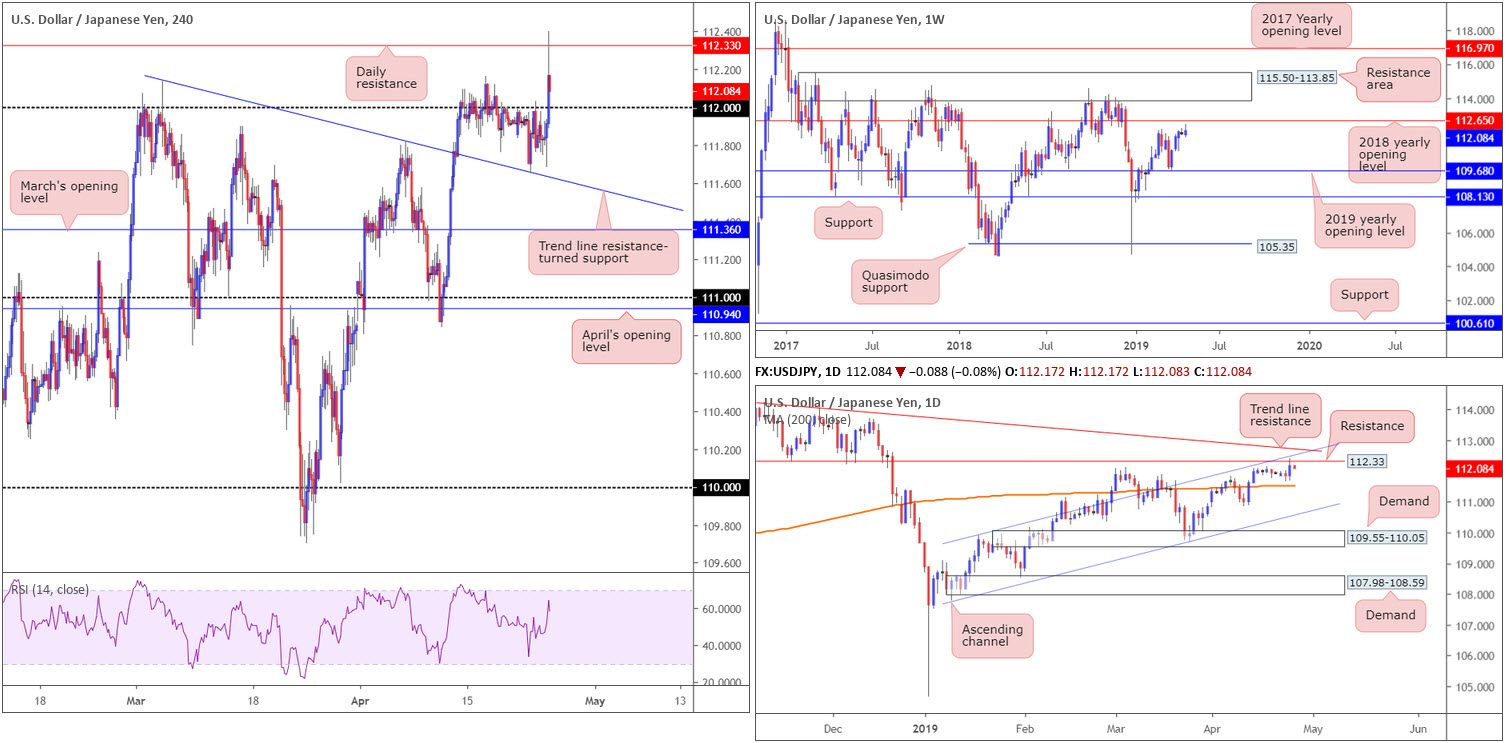
Broad-based USD bidding propelled the USD/JPY market northbound Wednesday, reclaiming 112+ status on the H4 timeframe and crossing swords with a daily resistance level at 112.33. For those who read Wednesday’s briefing you may recall the piece highlighted 112.33 as a potential sell zone. Note this barrier happens to fuse with a daily channel resistance (drawn from the high 109.88), and a nearby daily trend line resistance (etched from the high 114.54).
From Wednesday’s briefing:
Daily resistance at 112.33 appears a prime location for shorts in this market, with stop-loss orders plotted beyond the daily trend line resistance highlighted above.
Areas of consideration:
Well done to any of our readers who managed to sell the daily level. The next downside target falls in around the 112 handle. Beyond 112, the H4 trend line resistance-turned support (etched from the high 112.13) is next in line, followed by the 200-day SMA (orange) on the daily timeframe (111.50ish).
For folks who missed the short from 112.33, a H4 close below 112 that’s followed up with a retest in the shape of a H4 bearish candlestick pattern could be an option (entry and risk parameters can be determined according to this pattern).
Today’s data points: US Core Durable Goods Orders m/m; US Durable Goods Orders m/m; US Unemployment Claims; BoJ Outlook Report; BoJ Monetary Policy Statement; BOJ Policy Rate; BoJ Press Conference.
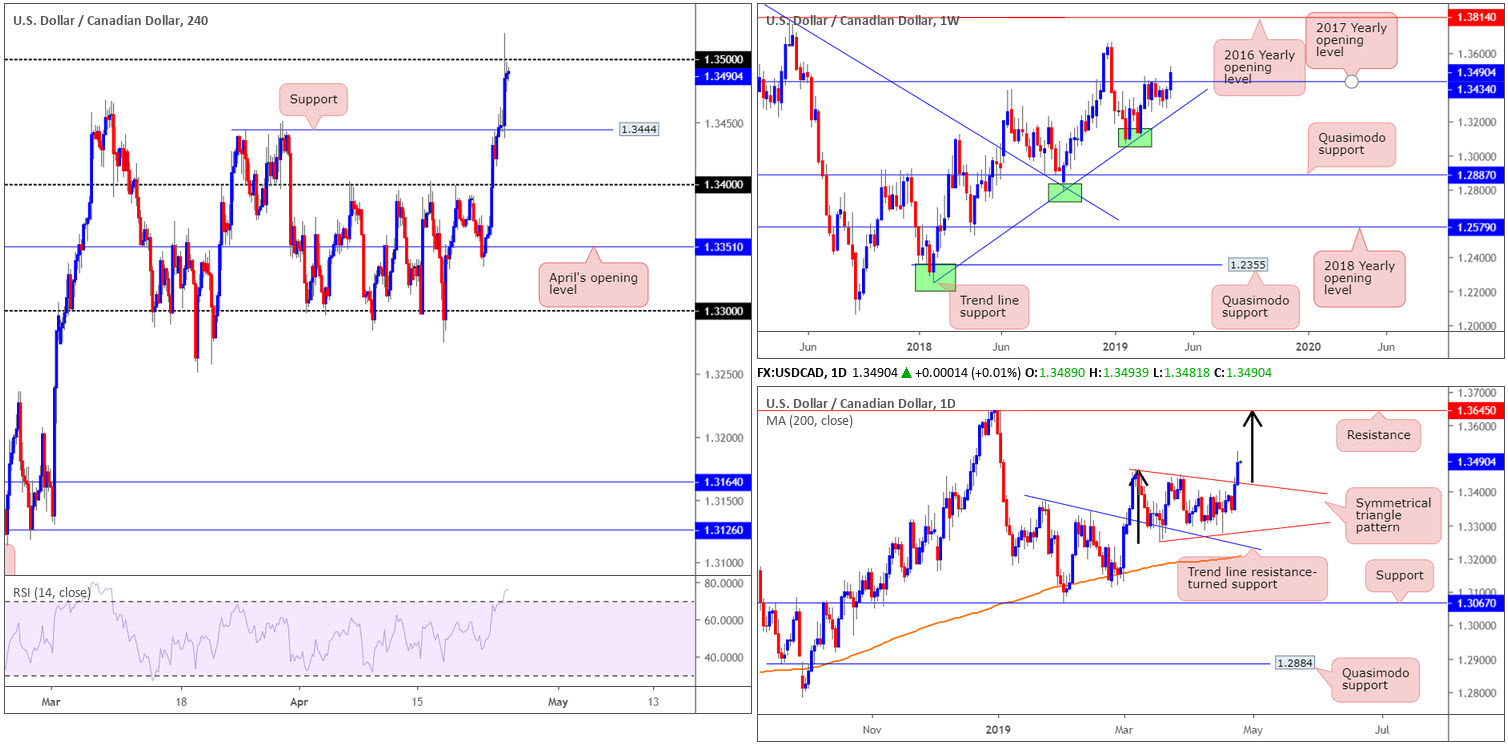
USD/CAD:
Wednesday saw the Bank of Canada hold rates steady at 1.75%, as expected. The central bank dropped its ‘hiking bias’ from its policy statement, while also cutting near-term growth forecasts. Alongside a reigning dollar crossing swords with fresh 2019 highs (US dollar index), the USD/CAD rallied half a percent and concluded the day challenging 1.35 on the H4 timeframe.
According to our technical studies, the likelihood of 1.35 holding as resistance is doubtful. Weekly price is establishing a position beyond its 2017 yearly opening level at 1.3434, perhaps clearing the pathway north towards the 2018 yearly high of 1.3664. In addition to this, daily flow broke out of a symmetrical triangle formation. Traders are likely looking for this pattern to hit a take-profit target around resistance at 1.3645 (the T.P was calculated by adding the base distance to the breakout level [black arrows]).
Areas of consideration:
On account of the technical picture, a long above 1.35 is an idea worth exploring today. A H4 close above this number that’s followed up with a retest as support (preferably by way of a H4 bullish candlestick pattern – entry and risk can be determined according to this structure) would likely be enough evidence to draw in buyers towards at least H4 resistance at 1.3570 (not seen on the screen).
Today’s data points: US Core Durable Goods Orders m/m; US Durable Goods Orders m/m; US Unemployment Claims.
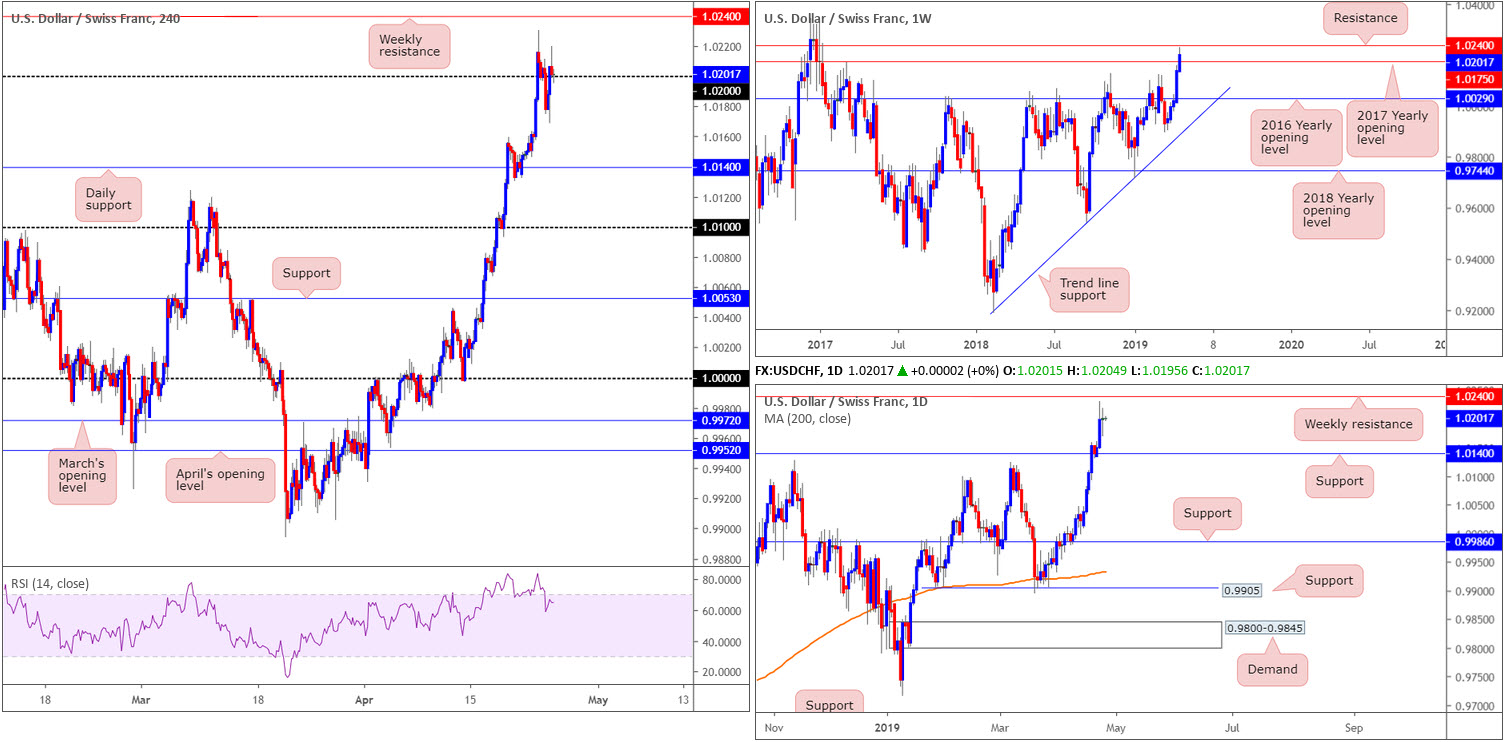
USD/CHF:
Outlook unchanged due to lacklustre movement.
A sharp fall in the US bond yields kept a lid on the recent USD upsurge, which saw the greenback conquer fresh 2019 highs of 98.19 (US dollar index). Ultimately the USD/CHF pair ended Wednesday unchanged (note the clear-cut indecision candle on the daily timeframe), closing just north of the 1.02 handle on the H4 timeframe.
In light of the pair’s somewhat lacklustre performance yesterday, the research team still feels buying 1.02 could be an option, given the path north clear for a run towards weekly resistance plotted at 1.0240.
Areas of consideration:
Keeping it ‘short and sweet’ this morning, a long from 1.02 remains of interest today for longs. On account of psychological numbers being prone to fakeouts (also known as stop runs), though, traders are urged to wait and see if H4 price chalks up a bullish candlestick signal, either on the H1 or H4 – think Hammer/Pin-bar formation or Engulfing pattern. This not only identifies buyer intent, it also offers clear entry/risk parameters to work with.
Today’s data points: US Core Durable Goods Orders m/m; US Durable Goods Orders m/m; US Unemployment Claims.
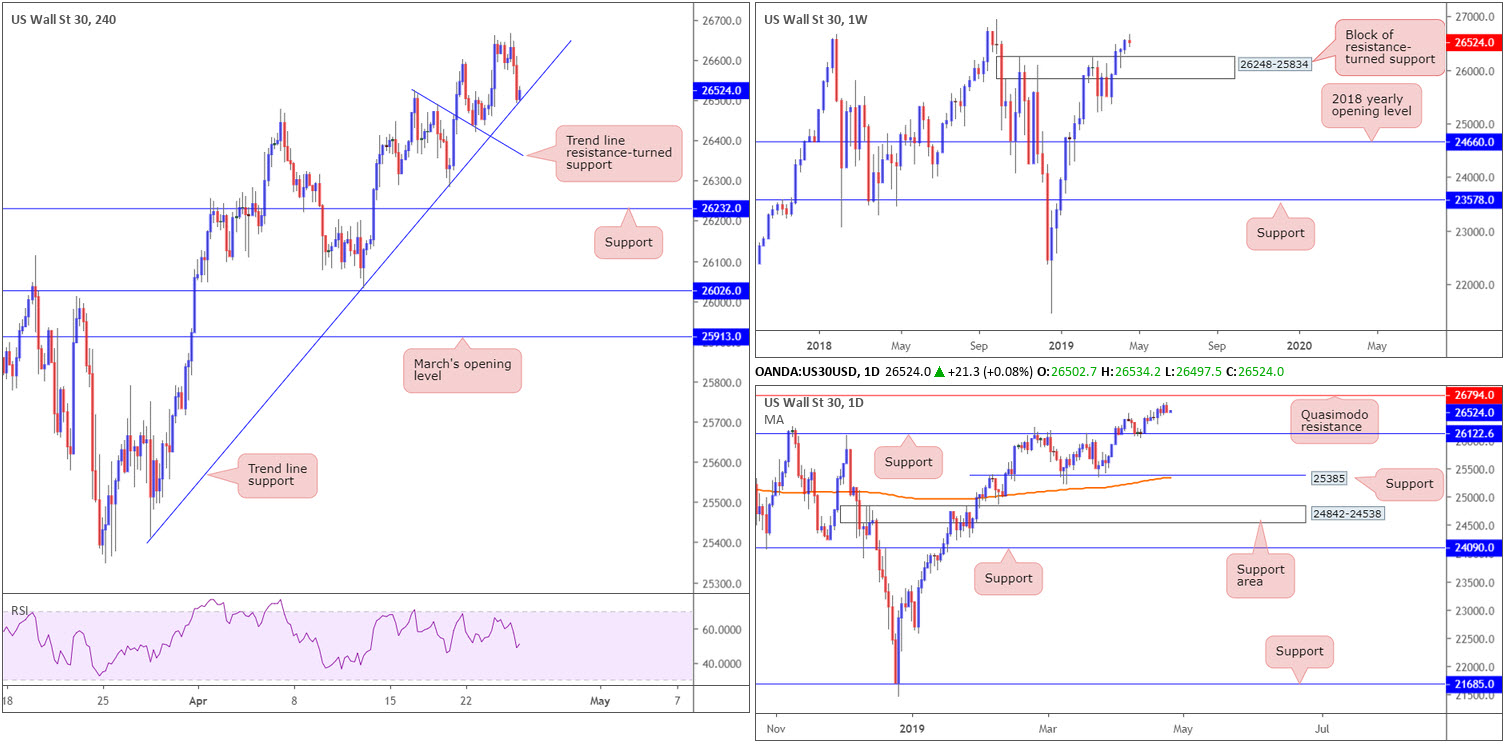
Dow Jones Industrial Average:
US stocks inched lower amid concerns about the health of the world economy, a day after strong earnings propelled the S&P 500 to a record. Wednesday saw the Dow Jones Industrial Average shed 0.22%, while the S&P 500 also lost 0.22%, along with the tech-heavy Nasdaq Composite chalking up losses of 0.34%.
From a technical perspective, the DJIA settled for the day at a notable H4 trend line support (taken from the low 25410). This is likely of interest to many technicians today, owing to where the index is positioned on the higher timeframes. Weekly structure is seen advancing above 26248-25834 (a block of resistance-turned support), and has the 2018 high at 26939 in sight. Meanwhile, daily flow is poised to test a nearby Quasimodo resistance at 26974. Note the index remains firmly positioned above its 200-day SMA (orange).
Areas of consideration:
With the underlying trend emphasising strength, and both weekly and daily charts displaying room to extend higher, a long from the current H4 trend line support could be an option today. Conservative traders may opt to wait and see if H4 price chalks up a bullish candlestick signal before pulling the trigger (entry/risk levels can be based off this pattern), in order to help avoid a fakeout.
Today’s data points: US Core Durable Goods Orders m/m; US Durable Goods Orders m/m; US Unemployment Claims.
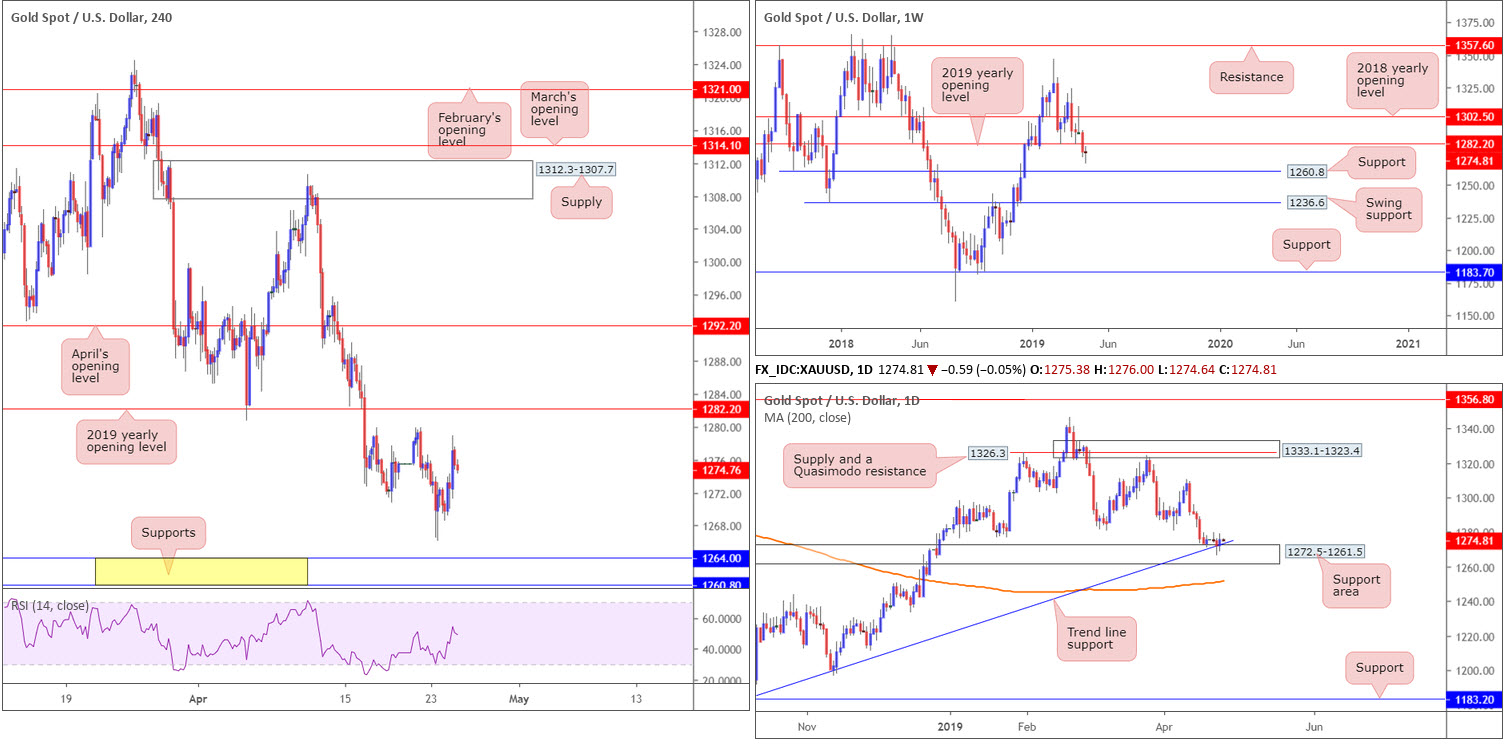
XAU/USD (GOLD):
Despite the US dollar pencilling in an impressive advance Wednesday, spot gold advanced 0.24% on the day. Concerns about the health of the world economy, along with US Treasury yields sinking nearly 2.00%, ignited demand for the safe-haven metal.
Structure on the H4 timeframe has the candles dancing in no-man’s-land at the moment between the 2019 yearly opening level at 1282.2 (also positioned on the weekly timeframe) and support at 1264.0, closely shadowed by a Quasimodo resistance-turned support at 1260.8.
1264.0 is also housed within a daily support area coming in at 1272.5-1261.5, which happens to align with a trend line support (taken from the low 1160.3). Interestingly, higher-timeframe flows also show the weekly candles have room to press as far south as support plotted at 1260.8 (representing the H4 support highlighted above).
Areas of consideration:
On account of the above reading, the H4 support at 1264.0, owing to its connection with daily structure, remains an attractive platform for longs today. It is, however, recommended to wait for additional confirmation to take shape before pulling the trigger (entry and risk levels can be determined according to the confirmation technique applied). This is due to weekly price threatening lower prices.
In the event the unit continues to climb higher, however, and the market observes a H4 close take shape beyond 1282.2, a retest of this level (preferably in the shape of a H4 bullish candlestick pattern – entry and risk can be determined according to this pattern) as support could prompt further buying towards April’s opening level at 1292.2.
The accuracy, completeness and timeliness of the information contained on this site cannot be guaranteed. IC Markets does not warranty, guarantee or make any representations, or assume any liability with regard to financial results based on the use of the information in the site.
News, views, opinions, recommendations and other information obtained from sources outside of www.icmarkets.com.au, used in this site are believed to be reliable, but we cannot guarantee their accuracy or completeness. All such information is subject to change at any time without notice. IC Markets assumes no responsibility for the content of any linked site. The fact that such links may exist does not indicate approval or endorsement of any material contained on any linked site.
IC Markets is not liable for any harm caused by the transmission, through accessing the services or information on this site, of a computer virus, or other computer code or programming device that might be used to access, delete, damage, disable, disrupt or otherwise impede in any manner, the operation of the site or of any user’s software, hardware, data or property.


