
EUR/USD:
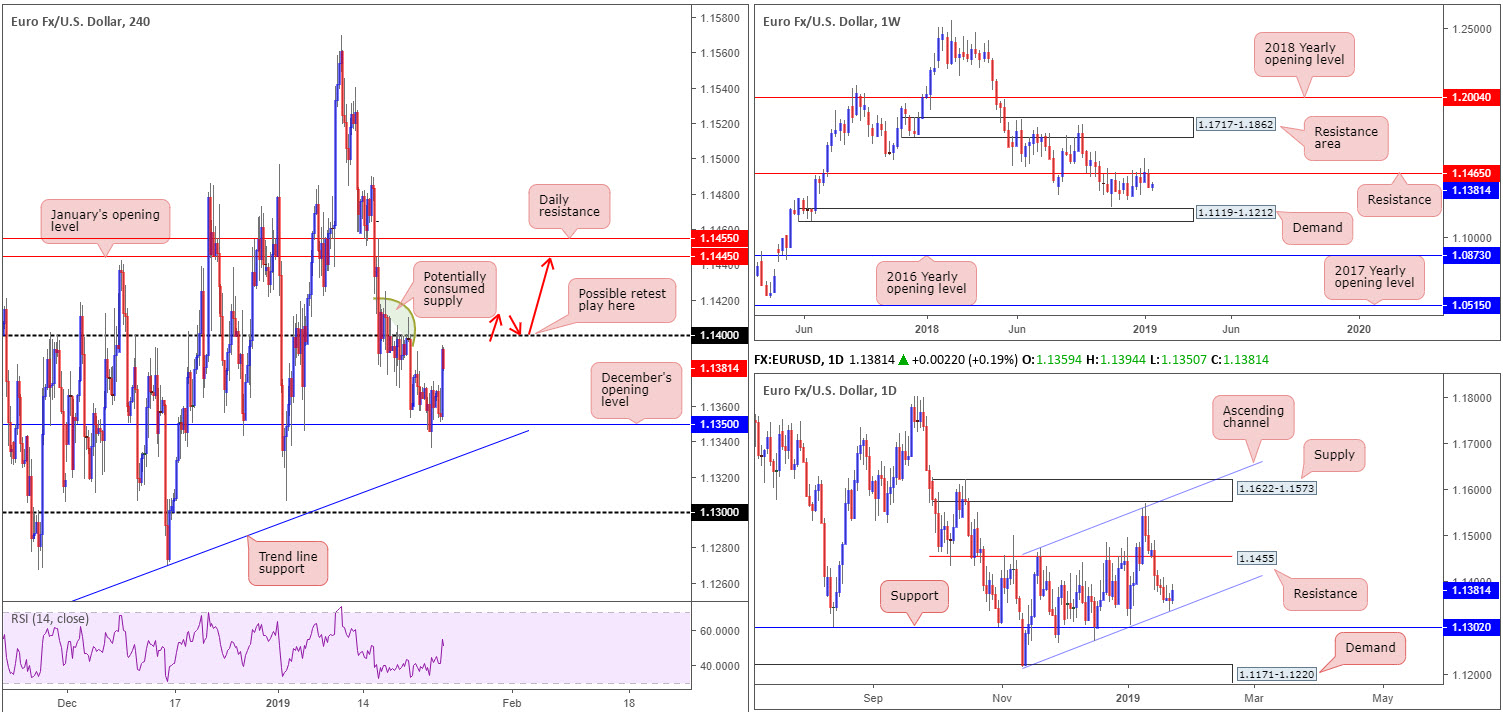
Despite spending a large portion of Wednesday’s session consolidating just north of December’s opening level at 1.1350 on the H4 timeframe, the single currency witnessed a resurgence of bidding going into US hours. Broad-based US dollar selling, triggered by a sharp drop in 10-year Treasury yields, appears to be the primary catalyst behind the recent upsurge.
Technically bolstered by a daily ascending channel support (etched from the low 1.1216), the H4 candles reached session highs just ahead of 1.14 before mildly paring gains. Although H4 price has found a temporary ceiling ahead of 1.14, further buying on the daily scale is visible towards resistance priced in at 1.1455. Weekly structure, on the other hand, continues to reflect a bearish stance south of resistance at 1.1465, possibly setting the stage for further selling towards weekly demand at 1.1119-1.1212.
Areas of consideration:
Although the weekly timeframe’s position suggests further downside could be on the cards this week, advancing and conquering 1.14 to the upside is still a strong possibility. With this being the case, traders may want to pencil in a potential intraday break/retest play above 1.14 today (red arrows), targeting January’s opening level at 1.1445/daily resistance mentioned above at 1.1455. It is unlikely price will attempt to drive much beyond these levels just yet, given ten pips beyond the daily level a weekly band of resistance highlighted above at 1.1465 exists.
For conservative traders interested in longs above 1.14, waiting for price to form a supporting bullish candlestick H4 pattern on the retest of the round number is an option. Not only does this help identify bullish intent, it also provides defined entry/stop levels to work with.
Today’s data points: French Flash Manufacturing PMI; French Flash Services PMI; German Flash Manufacturing PMI; German Flash Services PMI; EUR Flash Manufacturing PMI; EUR Flash Services PMI; ECB Press Conference and Main Refinancing Rate.
GBP/USD:
Promising gains were observed in sterling markets Wednesday, as traders remain optimistic of a potential extension to Article 50.
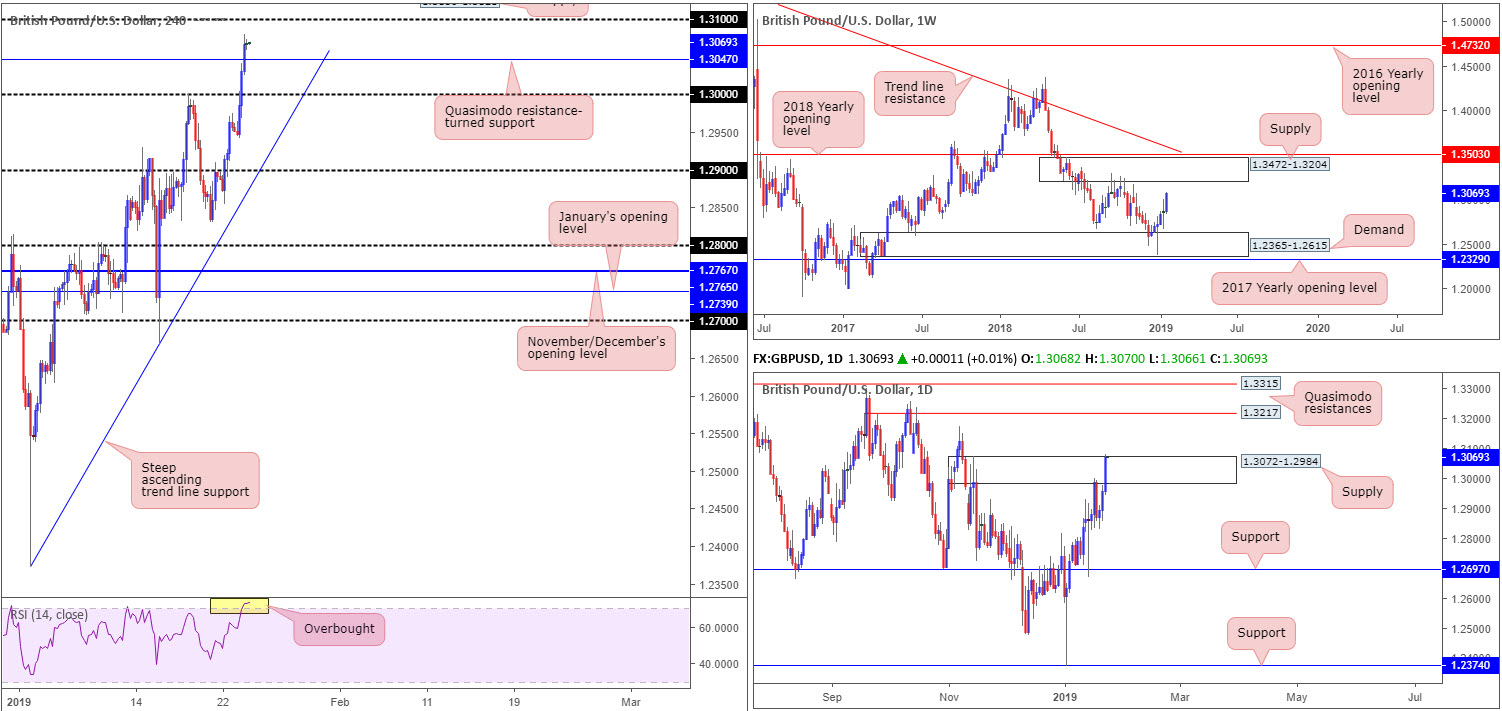
H4 action on the GBP/USD witnessed a brief flicker of activity around the underside of key figure 1.30 in early London yesterday, though buyers swiftly absorbed orders here and moved to higher ground. As US traders arrived at their desks, GBP was further bid against its US counterpart, elbowing through Quasimodo resistance at 1.3047 (now acting support) and reaching a session high of 1.3080 into the close. The next upside target on the H4 scale resides around 1.31, followed closely by supply at 1.3150-1.3121 (not seen on the screen). In addition to recent buying, the H4 RSI indicator is also seen displaying a reasonably strong overbought reading.
The story over on the bigger picture reveals daily movement pressured itself into the walls of supply at 1.3072-1.2984 and attacked the upper limit of this zone. Stop-loss orders above this area have likely come under siege, given the move above the supply edge tallied eight pips. This – coupled with weekly price exhibiting space to explore higher ground towards supply coming in at 1.3472-1.3204 – could lead to further buying materialising in this market.
Areas of consideration:
With all three timeframes offering nods to the upside, a retest of 1.3047 on the H4 timeframe (the Quasimodo resistance-turned support) could provide traders a platform to work with. Having seen minimal confluence supporting a bounce from 1.3047 on the H4 timeframe, aside from the bigger picture indicating buyers have the upper hand right now, traders are urged to consider waiting for additional confirmation before pulling the trigger. A bullish candlestick signal, for example, not only offers traders entry/stop parameters, it helps identify bullish interest around the selected support.
Upside targets from 1.3047 reside around 1.31, H4 supply at 1.3150-1.3121 and then the underside of weekly supply at 1.3204 (converges closely with a daily Quasimodo resistance at 1.3217).
Today’s data points: Limited.
AUD/USD:
Trading volume remained light amid Wednesday’s session, failing to benefit from the broad-based US dollar slide which brought the DXY to lows of 96.05.
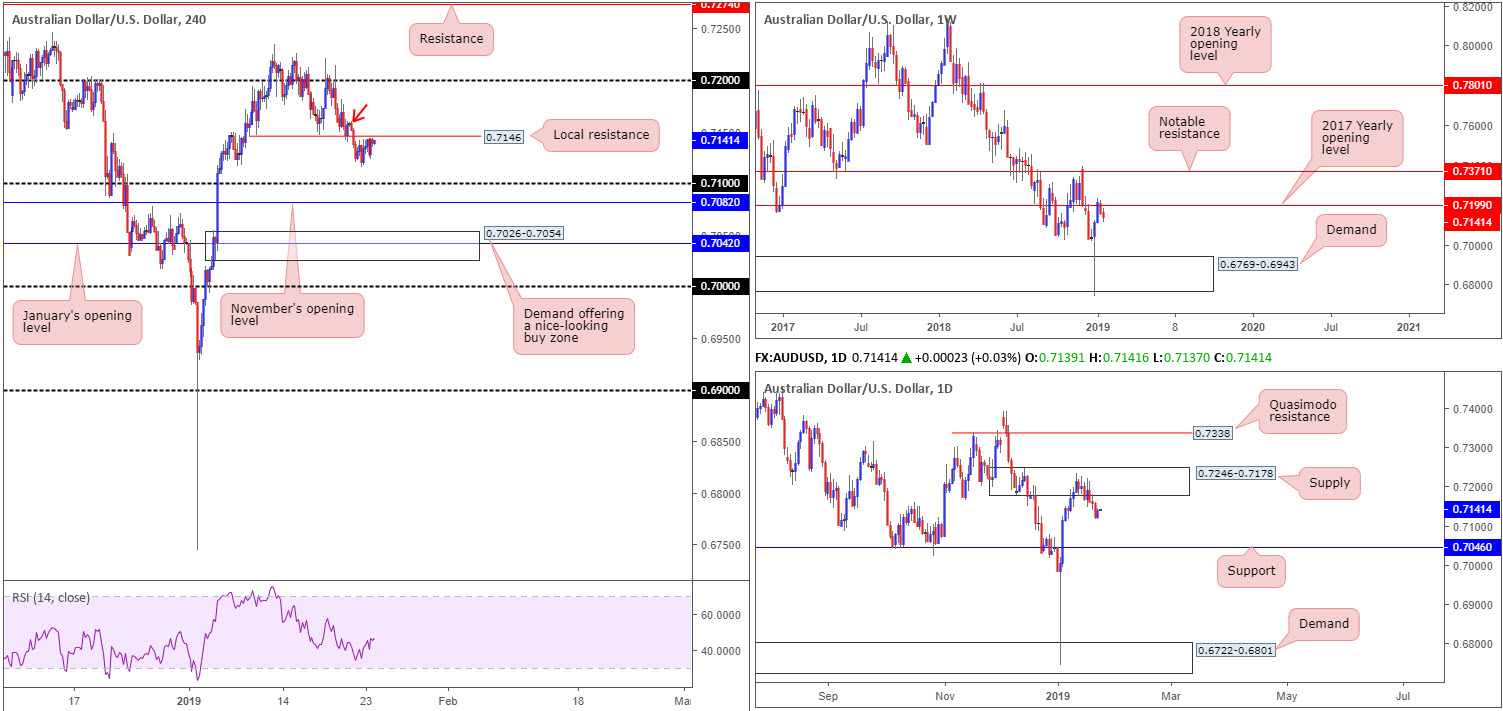
As is evident from the H4 timeframe, the candles are loitering just south of local resistance penciled in at 0.7146. To the downside from this angle, the 0.71 handle offers possible support, shadowed closely by November’s opening level at 0.7082 and then eventually January’s opening level at 0.7042. Above 0.7146, aside from minor supply lingering around 0.7152ish (red arrow), scope for a pop towards 0.72 is likely.
Structure on the higher timeframe remains unchanged. Weekly flow is seen pressing for lower ground from its 2017 yearly opening level at 0.7199. Further selling from here has demand plotted at 0.6769-0.6943 to target. Alongside weekly structure, daily flow is seen shielding supply posted at 0.7246-0.7178, with the next port of call from this area visible at support drawn from 0.7046.
Areas of consideration:
A test to the underside of the local H4 resistance mentioned above at 0.7146 could, knowing where we’re trading from on the higher timeframes at the moment, offer intraday sellers an opportunity to punch in a short, targeting 0.71 as the initial take-profit zone. Traders are, however, urged to consider risk/reward parameters. Anything less than a 1:1:5 ratio is likely chancy.
As highlighted in Tuesday’s briefing, the research team notes possible buying opportunities around January’s opening level mentioned above at 0.7042. This number, as you can probably see, merges nicely with support at 0.7046 on the daily timeframe, therefore providing a relatively stable platform to consider longs from should we reach this low. What’s also nice about this region is the merging H4 demand area seen at 0.7026-0.7054, offering traders limits to base an entry and stop.
Despite the strong confluence surrounding 0.7046ish, traders are recommended to still keep weekly positioning in mind: selling off from resistance with plenty of room to explore lower grounds.
Today’s data points: Australian Employment Figures.
USD/JPY:
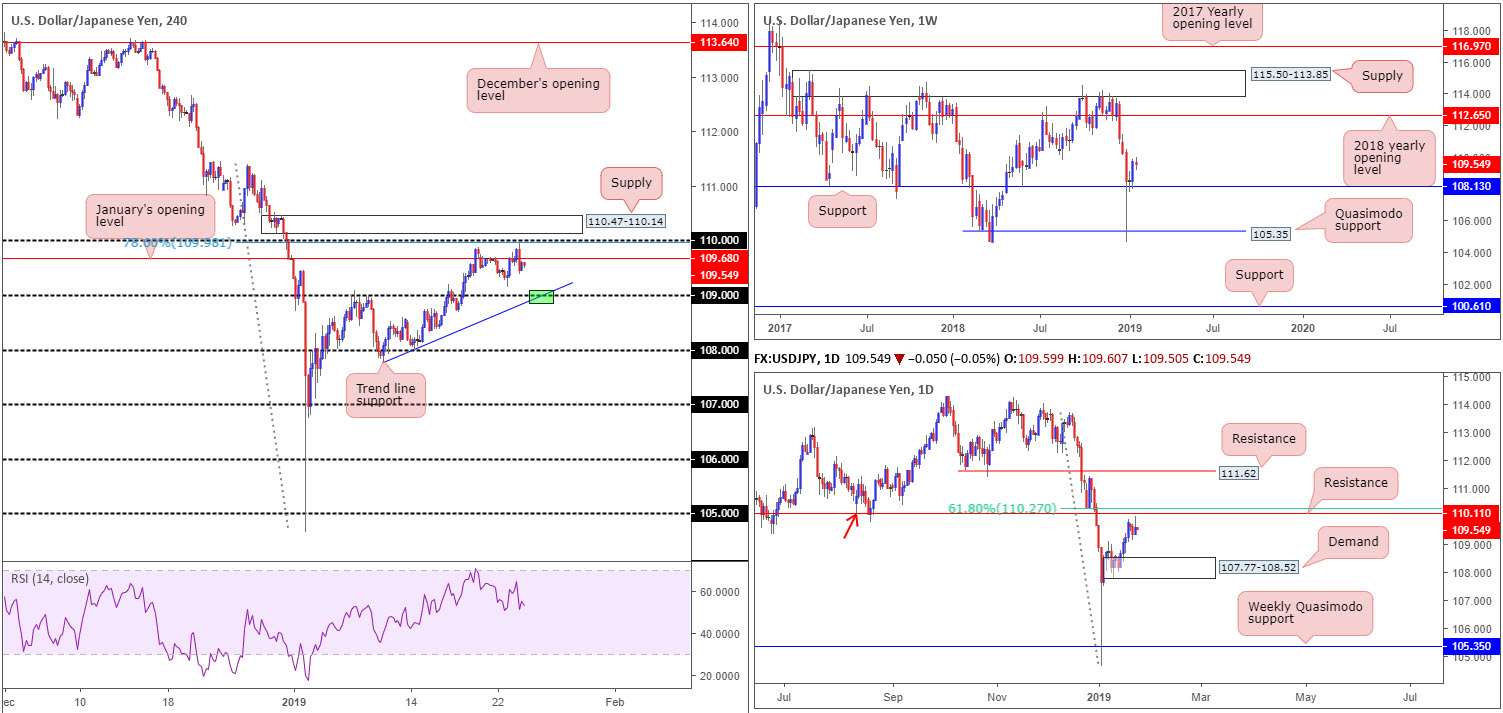
Wednesday’s session observed the USD/JPY knock on the underside of 110 (merges closely with a 78.6% H4 Fibonacci resistance value at 109.98) and recede lower. Directly above the psychological mark rests a H4 supply zone coming in at 110.47-110.14.
Note the selloff from 110 yesterday also witnessed the H4 candles reclaim January’s opening level at 109.68 to the downside, potentially exposing 109 as a viable support today, which happens to fuse nicely with a local trend line support (green – extended from the low 107.77).
On a wider perspective, the weekly timeframe visibly emphasises a bullish tone. Buyers recently found a floor off support priced in at 108.13, with potential, according to overhead structure, of further buying being seen as far north as the 2018 yearly opening level at 112.65. Contrary to weekly levels, daily price action is seen paring gains ahead of resistance coming in at 110.10 that’s trailed closely by a 61.8% Fibonacci resistance value at 110.27. 110.10 is essentially a Quasimodo support-turned resistance (red arrow).
Areas of consideration:
The 109 handle, in light of it aligning with trend line support, is worthy of attention for a bounce today, though the research team urges traders to consider waiting for additional candle confirmation (entry/stop levels can be defined according to the selected pattern) to form before pulling the trigger due to the threat of a fakeout (common viewing at round numbers).
Apart from the 109 handle, eyes still also remain on the H4 supply positioned at 110.47-110.14. A push above 110 will not only trip stop-loss orders from traders attempting to fade 110, which, when filled, will become buy orders to sell in to, breakout buyers will also likely attempt to join the movement. This offer of liquidity to sell to, coupled with daily resistance seen plotted at 110.10, is likely enough to draw in attention and bring price action lower.
Traders who feel the need to trade the noted H4 supply based on candle confirmation, waiting for a bearish formation to materialise will certainly add weight to a possible rotation lower. Traders who believe the H4 supply and daily resistance is enough evidence to draw sellers’ attention will likely enter short at 110.14 with stop-loss orders planted just north of 110.47. Once, or indeed if, the H4 candles reclaim 109.68 to the downside out of 110.47-110.14, traders can then think about reducing risk to breakeven and taking partial profits off the table.
Today’s data points: Limited.
USD/CAD:
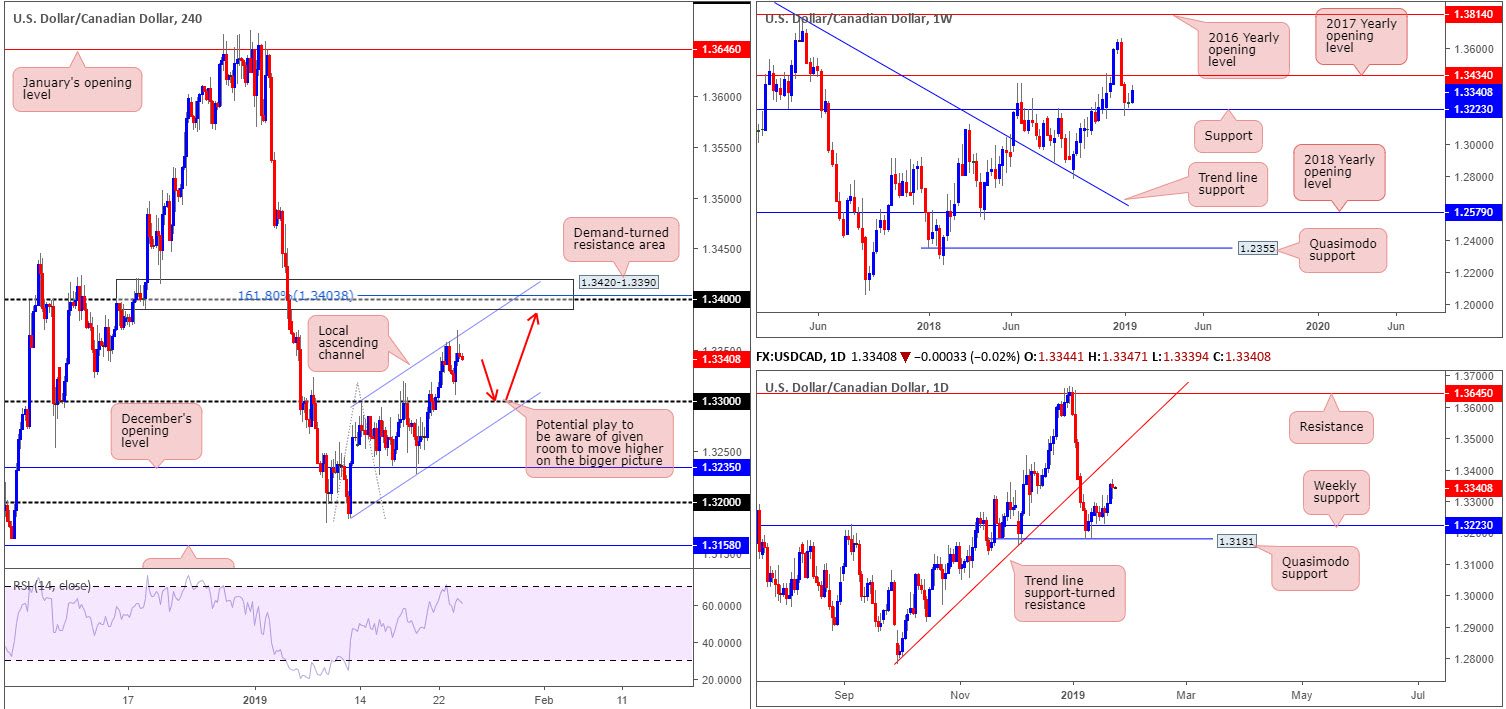
In response to Wednesday’s lackluster Canadian retail sales figures (fell to -0.9% from 0.3% in November and missed expectations of -0.6%), the US dollar gained traction against its Canadian counterpart just north of the 1.33 handle. The move erased the majority of daily losses, though the H4 candles failed to overthrow channel resistance (extended from the high 1.3297).
With the recent bout of buying in the rearview mirror, a H4 demand-turned resistance area is now on the radar at 1.3420-1.3390, which happens to clench within it a round number at 1.34 and a 161.8% H4 Fibonacci extension point at 1.3403.
Against the backdrop of H4 flow, the bigger picture remains unchanged in terms of structure. After weekly price rebounded off support at 1.3223, the current candle appears poised to cross swords with the 2017 yearly opening level at 1.3434. Closer analysis on the daily timeframe reveals the unit shook hands with a daily Quasimodo support at 1.3181 in recent trade. This level, as you can see, is situated just south of the current weekly support level. As long as the buyers continue to defend the said supports, the next port of call to the upside from here falls in around trend line support-turned resistance (extended from the low 1.2782), though it appears weekly resistance is likely to enter the fray beforehand.
Areas of consideration:
As both weekly and daily structure suggest buyers govern movement at the moment, a retest off 1.33 is likely still of interest to many traders.
The idea is for H4 sellers to enter the fold off its channel resistance (highlighted above) and tackle 1.33. Concerning upside targets from this number, traders will likely be looking at the H4 channel resistance as a potential trouble area, followed then by a H4 resistance zone mentioned above at 1.3420-1.3390.
As mentioned in previous reports, stop runs through round numbers are common viewing, therefore, waiting for additional bullish candlestick confirmation to form (entry/stop parameters can be defined according to this pattern) off 1.33 is highly recommended before pressing the buy button.
Today’s data points: Limited.
USD/CHF:
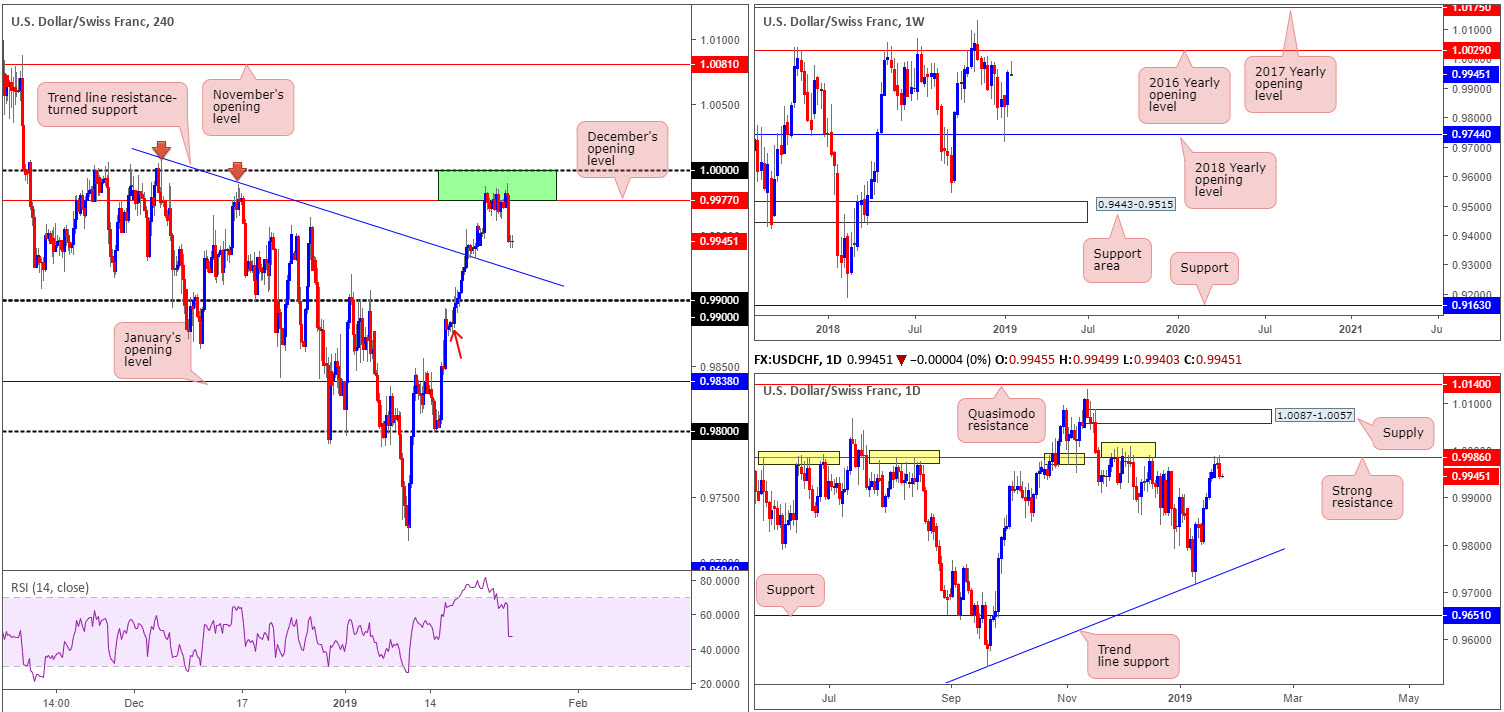
Although the research team was unable to spot a noteworthy H4 bearish candlestick formation out of the green H4 sell zone between the 1.0000 (parity) level and December’s opening level at 0.9977, the USD/CHF came under pressure within the area Wednesday as the unit moved into US hours. For traders who read Wednesday’s briefing you may recall the piece also stressed daily resistance at 0.9986 was seen housed within the noted H4 sell zone. Note yesterday’s selloff also formed a nice-looking daily bearish engulfing pattern off the aforementioned daily resistance.
According to H4 structure, further selling could be on the menu today as the candles appear poised to strike nearby trend line resistance-turned support (taken from the high 1.0008). Well done to any of our readers who managed to take advantage of the move.
It might also interest some traders to note weekly price is trading in the shape of a bearish pin-bar formation, though still displays range to extend gains towards the 2016 yearly opening level at 1.0029.
Areas of consideration:
While the research team expects further downside to be seen today, a bounce from the H4 trend line resistance-turned support/nearby 0.99 handle is a possibility. To trade long from these levels, though, knowing daily sellers are forcing the unit lower from resistance at 0.9986 is, as you can imagine, a touch precarious.
For folks believing the pair is also heading for lower levels, a close below 0.99 that’s followed up with a retest as resistance is certainly something to keep a watchful eye out for today (possibly tomorrow), targeting January’s opening level at 0.9838. There is a minor H4 demand present around 0.9883ish (red arrow), though given the daily picture we feel this will likely be consumed. For conservative traders wishing to add a little more confirmation to the mix, consider waiting for a bearish candlestick signal to form (preferably off the underside of 0.99 on the retest – entry/stop parameters can be defined according to this pattern) before pulling the trigger.
Today’s data points: Limited.
Dow Jones Industrial Average:
Having spent a major part of the day on the defensive amid mixed feelings concerning geopolitical tensions and global growth outlook, US equities were on the up into the close Wednesday (+0.52%).
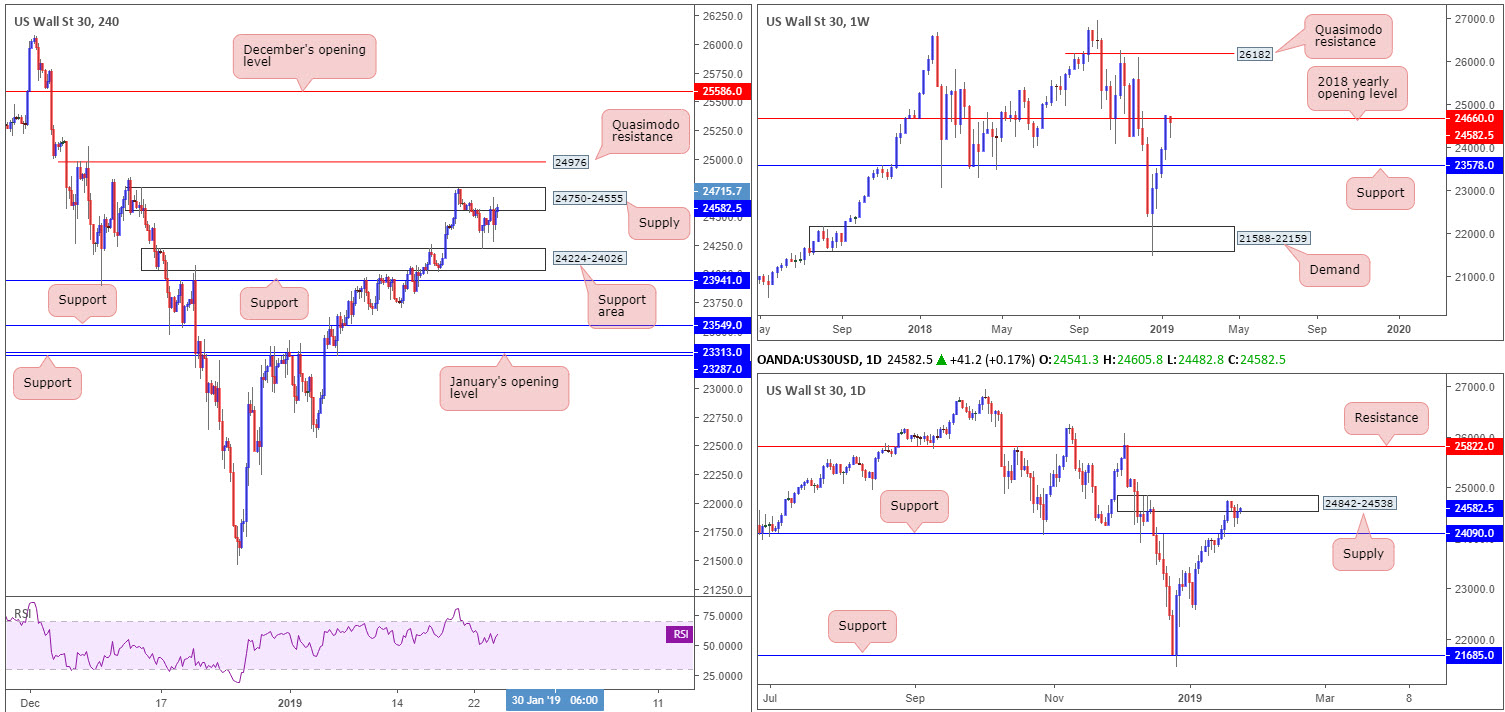
H4 structure is, as you can see, capped between supply at 24750-24555 and a support area coming in at 24224-24026. Outside of these borders, we have Quasimodo resistance priced in at 24976 and support at 23941. In terms of trend direction on the H4 scale, a fresh higher high is expected to take shape.
Expanding the view, the research team notes resistance on the weekly timeframe at 24660: the 2018 yearly opening level (sited within the walls of the current H4 supply). This weekly resistance is further validated on the daily timeframe in the shape of a supply zone seen at 24842-24538. The nearest support level on the higher timeframes is daily support found at 24090.
Areas of consideration:
According to higher-timeframe structure, shorting the index appears the way forward at the moment. Selling the current H4 supply, however, is not really considered a high-probability move, largely due to the area already having been tested a number of times already. Therefore, the Quasimodo resistance at 24976 is an area fresh sellers may be vested in.
Traders either have the option of entering short at 24976 and positioning stops above the Quasimodo head (25111), or waiting for a bearish candlestick formation to take shape before pulling the trigger (entry/stop parameters can be defined according to this pattern). Ultimately, the first downside take-profit target appears best set at the H4 support area mentioned above at 24224-24026, though traders should expect active buying to possibly enter the fight around 24750-24555, given this will be considered a support area after its taken out as supply.
Today’s data points: Limited.
XAU/USD (Gold):
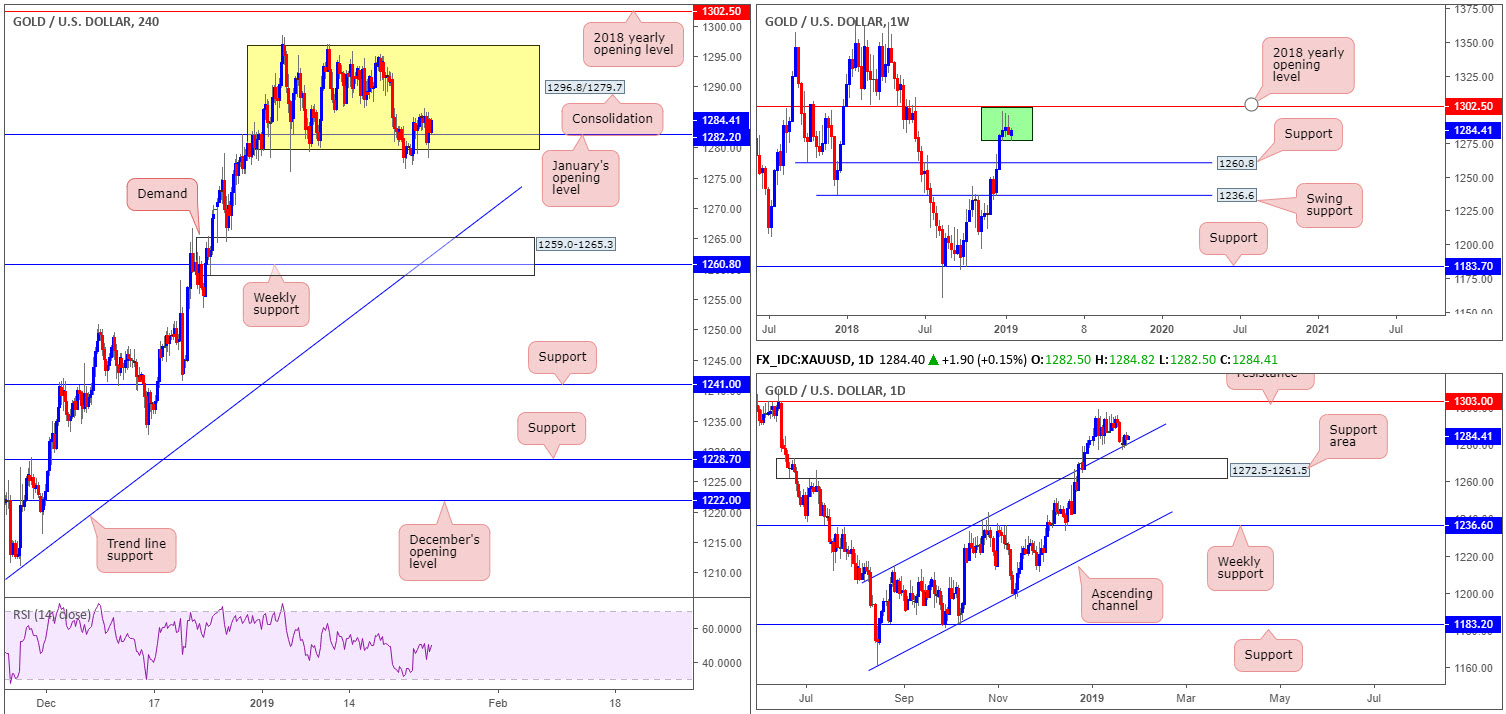
Bullion, as is evident from the H4 timeframe, struggled to find direction Wednesday as price consolidated around the lower edge of its range (yellow) between 1296.8/1279.7. Note January’s opening level priced in at 1282.2 is also seen inhabiting the lower limits of the said H4 range.
In light of yesterday’s lackluster performance, much of the following report will echo thoughts put forward in yesterday’s briefing.
From the weekly timeframe, we can see three consecutive bearish pin-bar formations (green) formed just south of the 2018 yearly opening level at 1302.5. Further selling, according to this timeframe, is possible as far south as support coming in at 1260.8. Lower down on the curve, however, we can see daily price crossing swords with channel resistance-turned support (taken from the high 1214.3), which is seen nearby a support area at 1272.5-1261.5. So far, as you can see, this barrier is holding firm.
The rebound off the daily channel support, technically speaking, is reinforcing the lower edge of the current H4 range. This could, as long as the buyers remain defensive above 1282.2ish, pressure this market higher to test the upper edge of the noted range.
Areas of consideration:
Assuming H4 price remains defensive above January’s opening level at 1282.2, the unit may eventually fill its range. By entering long here, do take into account you are potentially trading against weekly flow, though alongside possible buying on the daily timeframe. Therefore, it may be an idea to consider entering only on the back of additional candle confirmation.
An area we also continue to show love for (though may not enter the fight this week) is the H4 demand zone at 1259.0-1265.3 in view of its connecting confluence: fuses nicely with weekly support at 1260.8 and a H4 trend line support (extended from the low 1196.0). Note this H4 demand is also sited within the lower limits of the daily support area mentioned above at 1272.5-1261.5.
Traders either have the option of entering long on a limit order around 1265.3ish and positioning stop-loss orders below the demand, or wait for additional candlestick confirmation to form and enter long based on this structure. The latter is considered the more conservative route.
The use of the site is agreement that the site is for informational and educational purposes only and does not constitute advice in any form in the furtherance of any trade or trading decisions.
The accuracy, completeness and timeliness of the information contained on this site cannot be guaranteed. IC Markets does not warranty, guarantee or make any representations, or assume any liability with regard to financial results based on the use of the information in the site.
News, views, opinions, recommendations and other information obtained from sources outside of www.icmarkets.com.au, used in this site are believed to be reliable, but we cannot guarantee their accuracy or completeness. All such information is subject to change at any time without notice. IC Markets assumes no responsibility for the content of any linked site. The fact that such links may exist does not indicate approval or endorsement of any material contained on any linked site.
IC Markets is not liable for any harm caused by the transmission, through accessing the services or information on this site, of a computer virus, or other computer code or programming device that might be used to access, delete, damage, disable, disrupt or otherwise impede in any manner, the operation of the site or of any user’s software, hardware, data or property.


