
Key risk events today:
MPC Member Haskel Speaks; US Unemployment Claims; US CB Leading Index m/m.
(Previous analysis as well as outside sources – italics).
EUR/USD:
Increased demand for Europe’s shared currency took hold Wednesday as the US dollar index tumbled through its 95.00 handle. ECB’s Lagarde expressed satisfaction concerning the recent EU fund agreement, as EUR/USD recorded its fourth consecutive daily gain.
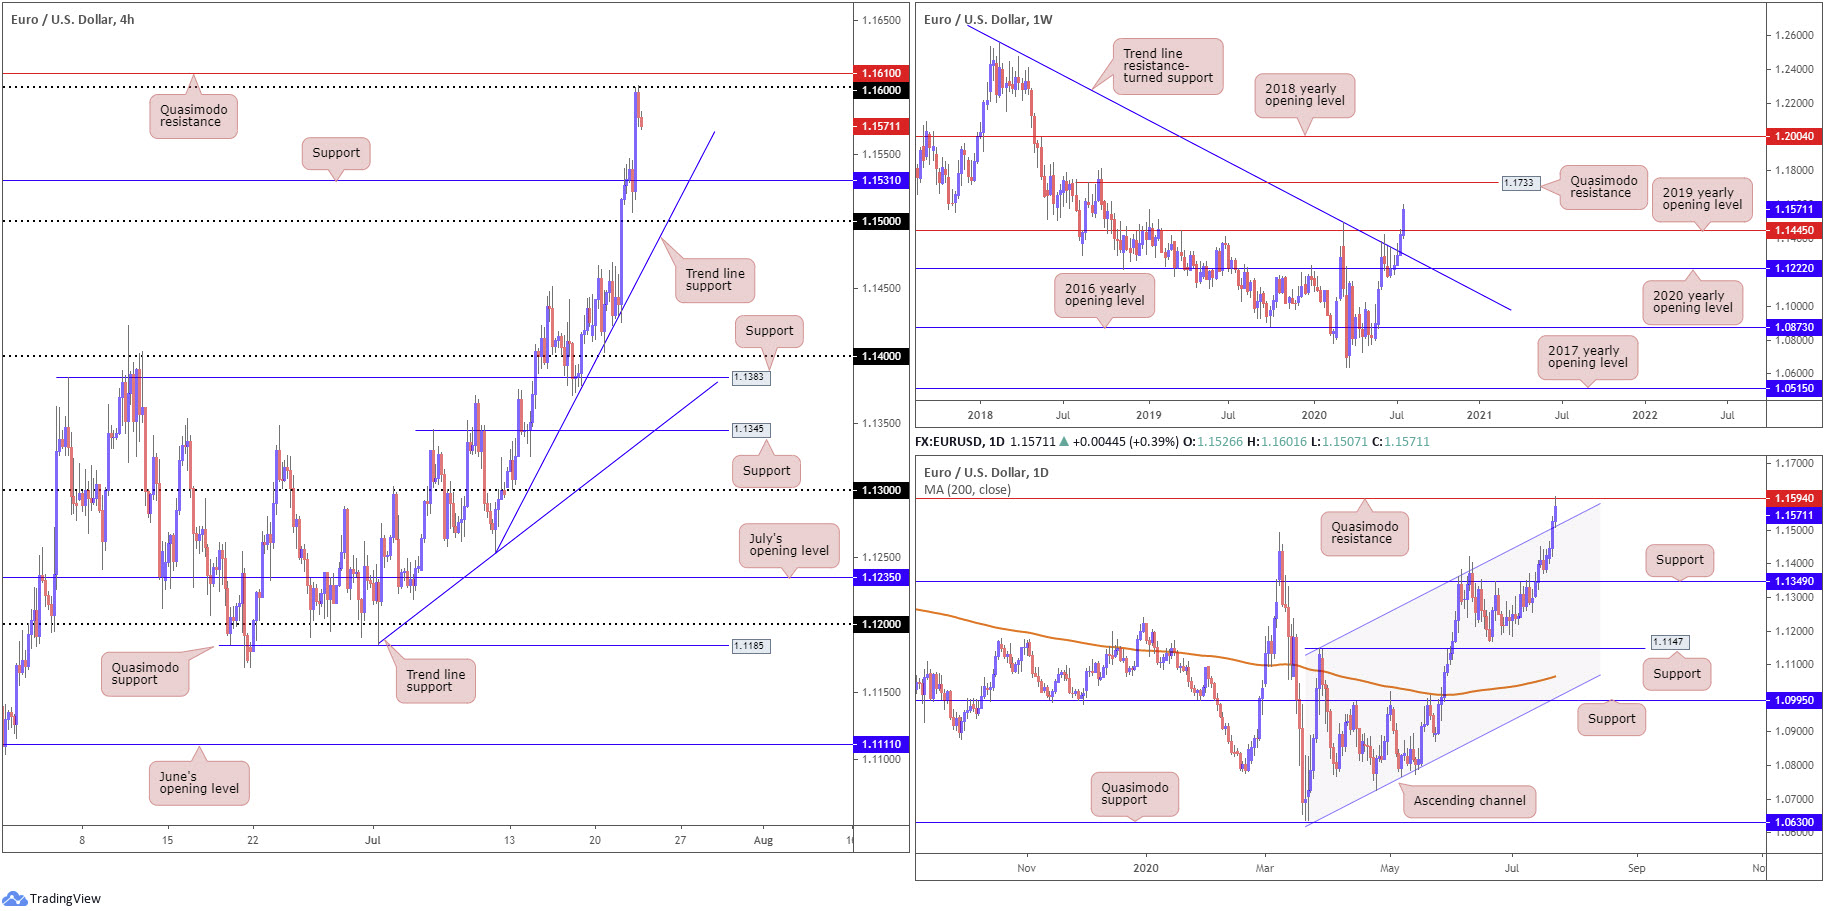
Technically, H4 invited an approach to the 1.16 handle, a level shadowed closely by Quasimodo resistance at 1.1610. Continued downside south of 1.16 has support at 1.1531 to target, followed by a steep trend line support, taken from the low 1.1254, and the 1.15 handle.
Further afield, weekly price is making considerable headway north of resistance at 1.1445, the 2019 yearly opening level. In the event buyers remain in the driver’s seat, Quasimodo resistance at 1.1733 lines up as the next potential upside target.
A closer examination of price movement on the daily timeframe, however, reveals the unit recently trekked through channel resistance, taken from the high 1.1147, and shook hands with Quasimodo resistance at 1.1594. Beyond here, chart studies display limited resistance until crossing swords with the weekly Quasimodo formation mentioned above at 1.1733.
Areas of consideration:
Short sellers from 1.16 currently trade in profit, bolstered on the back of daily Quasimodo resistance from 1.1594. The big question, though, is whether sellers have enough fuel to reach/retest H4 support at 1.1531, knowing weekly buyers demonstrate a relatively clear road north to Quasimodo resistance at 1.1733.
Should 1.1531 make an appearance, dip-buyers are likely to make a show. Conservative buyers may factor in the possibility of a fakeout through 1.1531 into 1.15 before taking action.
Alternatively, a H4 close above Quasimodo resistance at 1.1610 could stir breakout buyers, in hope of reaching 1.17 (H4) and 1.1733 on the weekly timeframe.
GBP/USD:
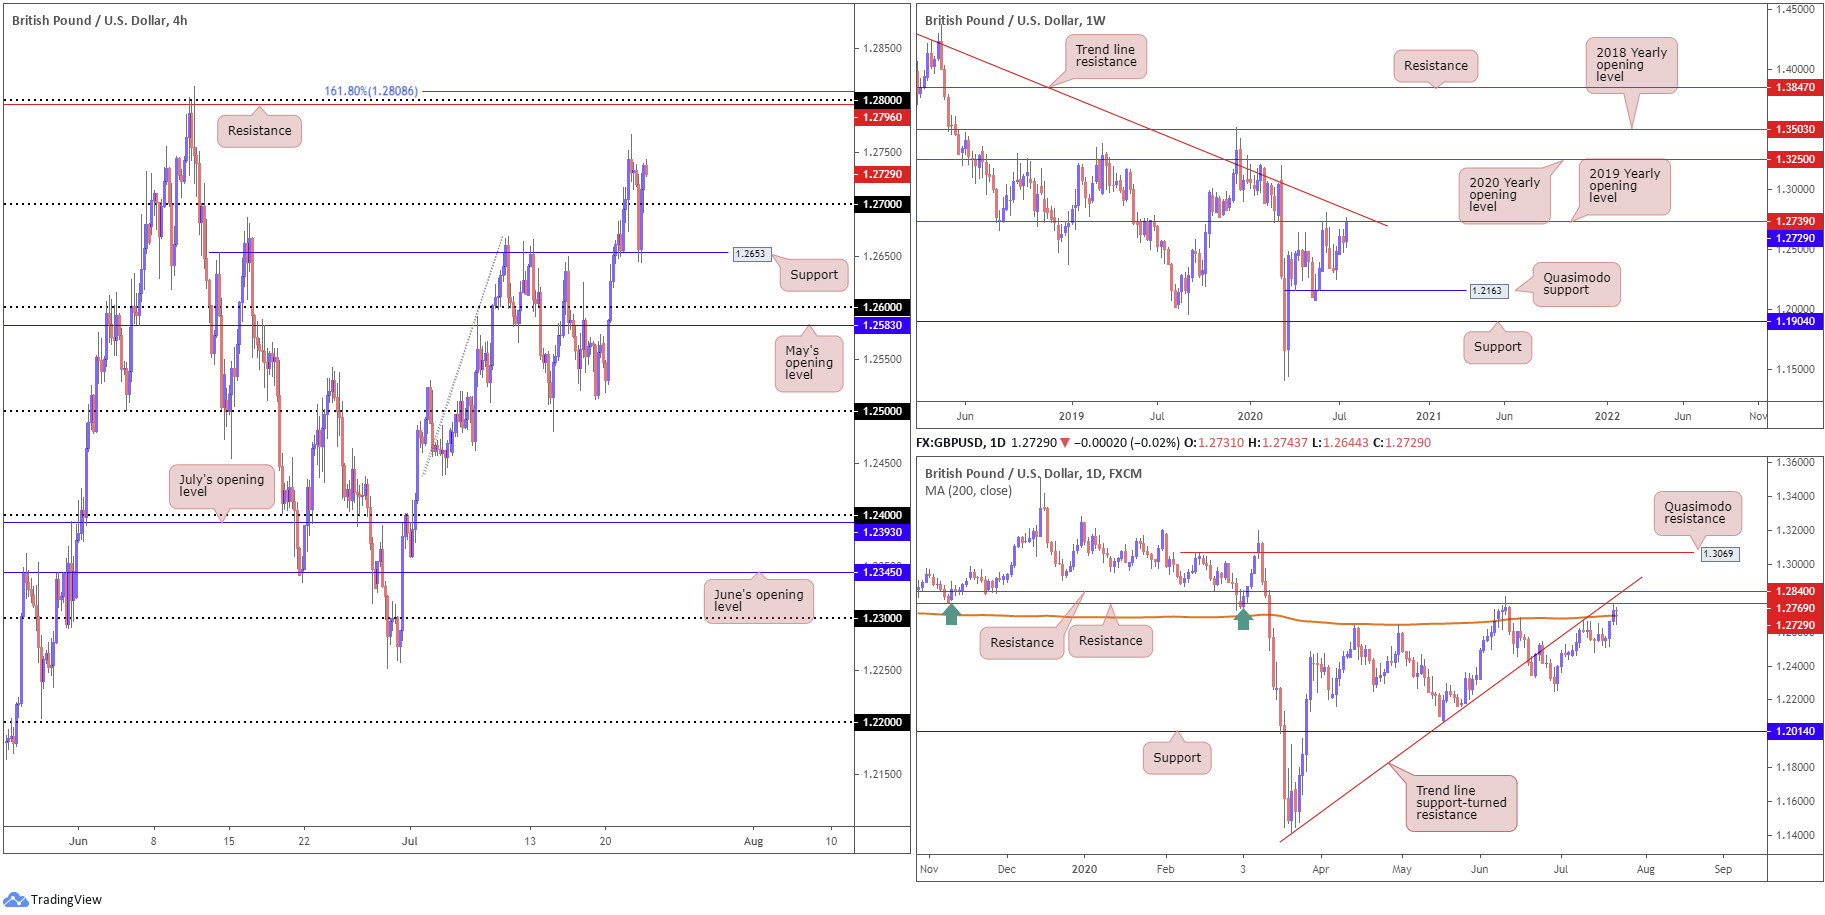
As we transitioned into London hours on Wednesday, the British pound came under pressure against the buck and drew H4 through 1.27 towards support at 1.2653. Heading into the US session, however, likely fed by sell-stop liquidity, price movement reclaimed 1.27+ status to trade unchanged by the European close. To the upside, resistance is seen at 1.2796, closely shadowed by the 1.28 handle and 161.8% Fibonacci extension point at 1.2808.
Meanwhile, the story on the weekly timeframe has price action clinging to the underside of the 2019 yearly opening level at 1.2739, with a break exposing nearby long-term trend line resistance, taken from the high 1.5930.
Lower on the curve, technical direction shows daily price remains above the 200-day SMA (orange – 1.2698) and is within touching distance of resistance coming in at 1.2769. Readers may also want to acknowledge additional resistance resides close by at 1.2840, coupled with trend line support-turned resistance, taken from the low 1.1409.
Areas of consideration:
Having weekly price embrace the underside of the 2019 yearly opening level at 1.2739, and daily flow scratching resistance at 1.2769, buyers north of 1.27 could struggle to gain a decisive foothold. Despite the immediate trend pointing northbound and 200-day SMA holding as support, the two aforementioned higher timeframe resistances would be enough to deter most buying.
A H4 close beneath 1.27 or 1.2653 support, therefore, could be a bearish scenario to keep an eye out for, with breakout sellers ultimately taking aim at 1.26 and May’s opening level at 1.2583.
AUD/USD:
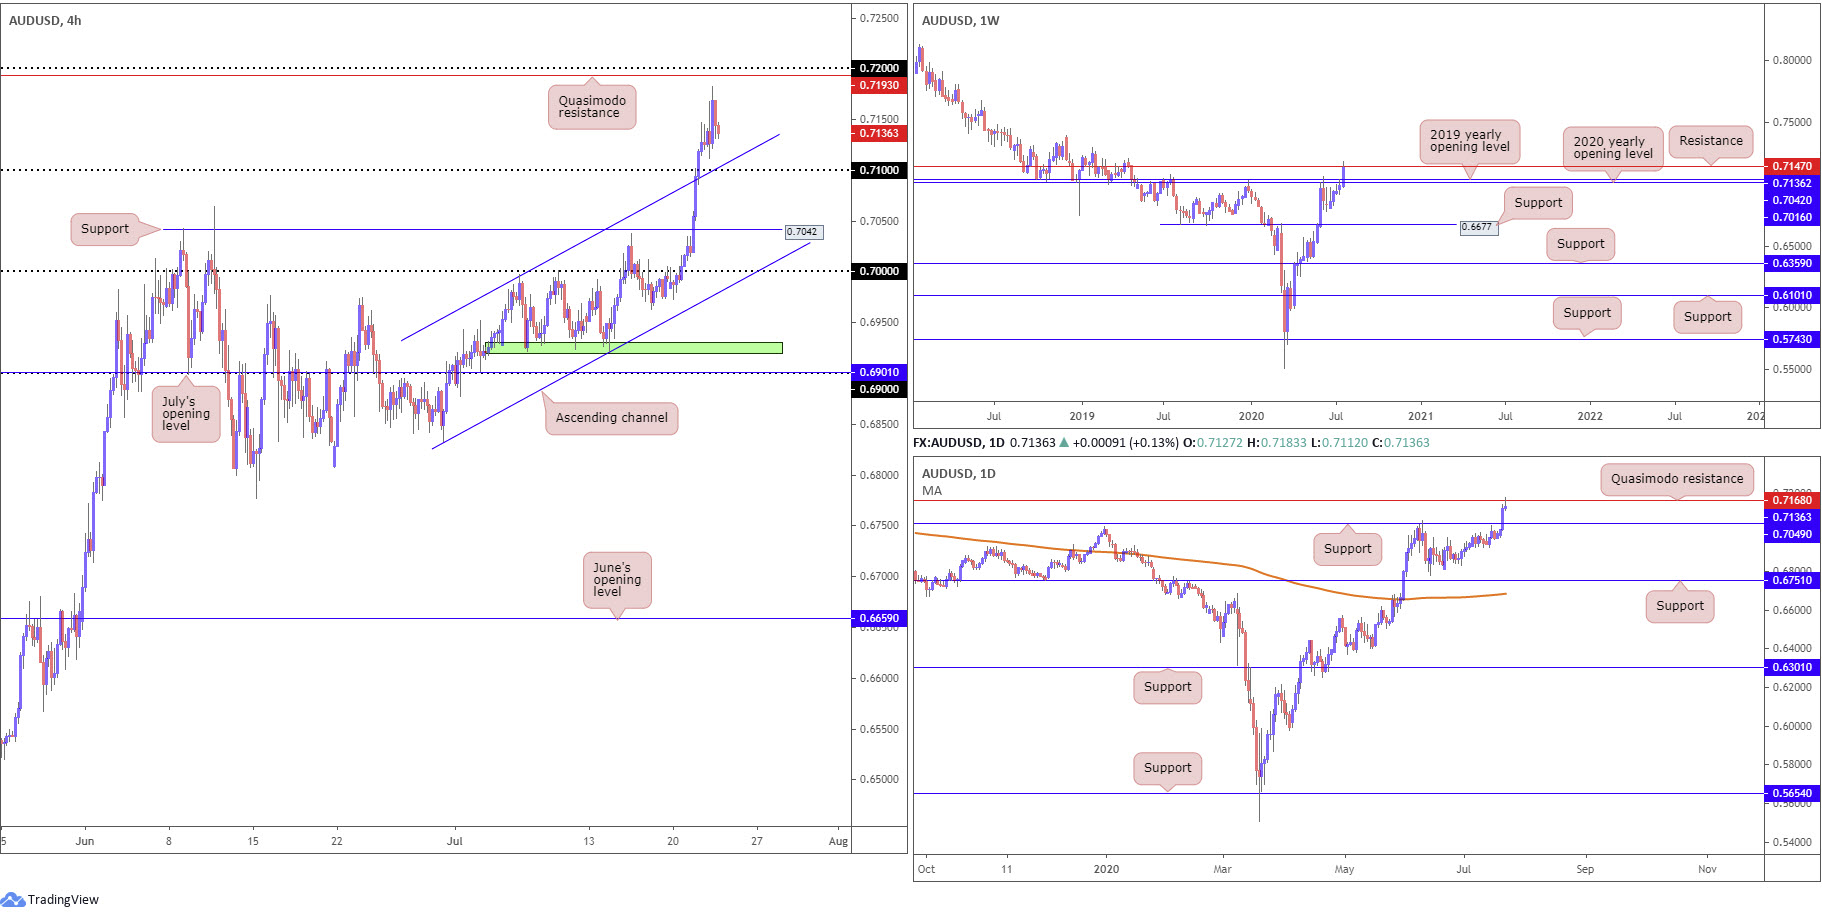
Following Tuesday’s 1.6% rise, Wednesday struck highs at 0.7182, the highest level since April 2019, and modestly retreated south. The US dollar index also continued to find soft ground, consequently puncturing 95.00.
H4 movement, as evident from the chart, found thin air ahead of Quasimodo resistance at 0.7193 and the 0.72 handle. A continuation south today may call for a 0.71 retest, a psychological number sited under channel resistance-turned support, extended from the high 0.6997. Beyond the aforementioned structures, traders will be looking at support coming in from 0.7042, a Quasimodo resistance.
Weekly price, after chiselling through the 2020 and 2019 yearly opening levels at 0.7016 and 0.7042, respectively, pulled in resistance at 0.7147. Similarly, we also see daily price fading Quasimodo resistance at 0.7168 in the shape of a shooting star candlestick pattern.
Areas of consideration:
Weekly resistance at 0.7147 and daily Quasimodo resistance at 0.7168, regardless of the immediate trend facing northbound, is likely to weigh on upside attempts.
As such, a H4 retest at 0.71/channel support is likely on the cards today. Whether buyers make a stand here is difficult to judge. Traders will likely be watching price action closely for signs of bullish intent at this point. A H4 close beneath 0.71, though, as the higher timeframes suggest, could encourage intraday selling to daily support at 0.7049 and H4 support from 0.7042.
USD/JPY:
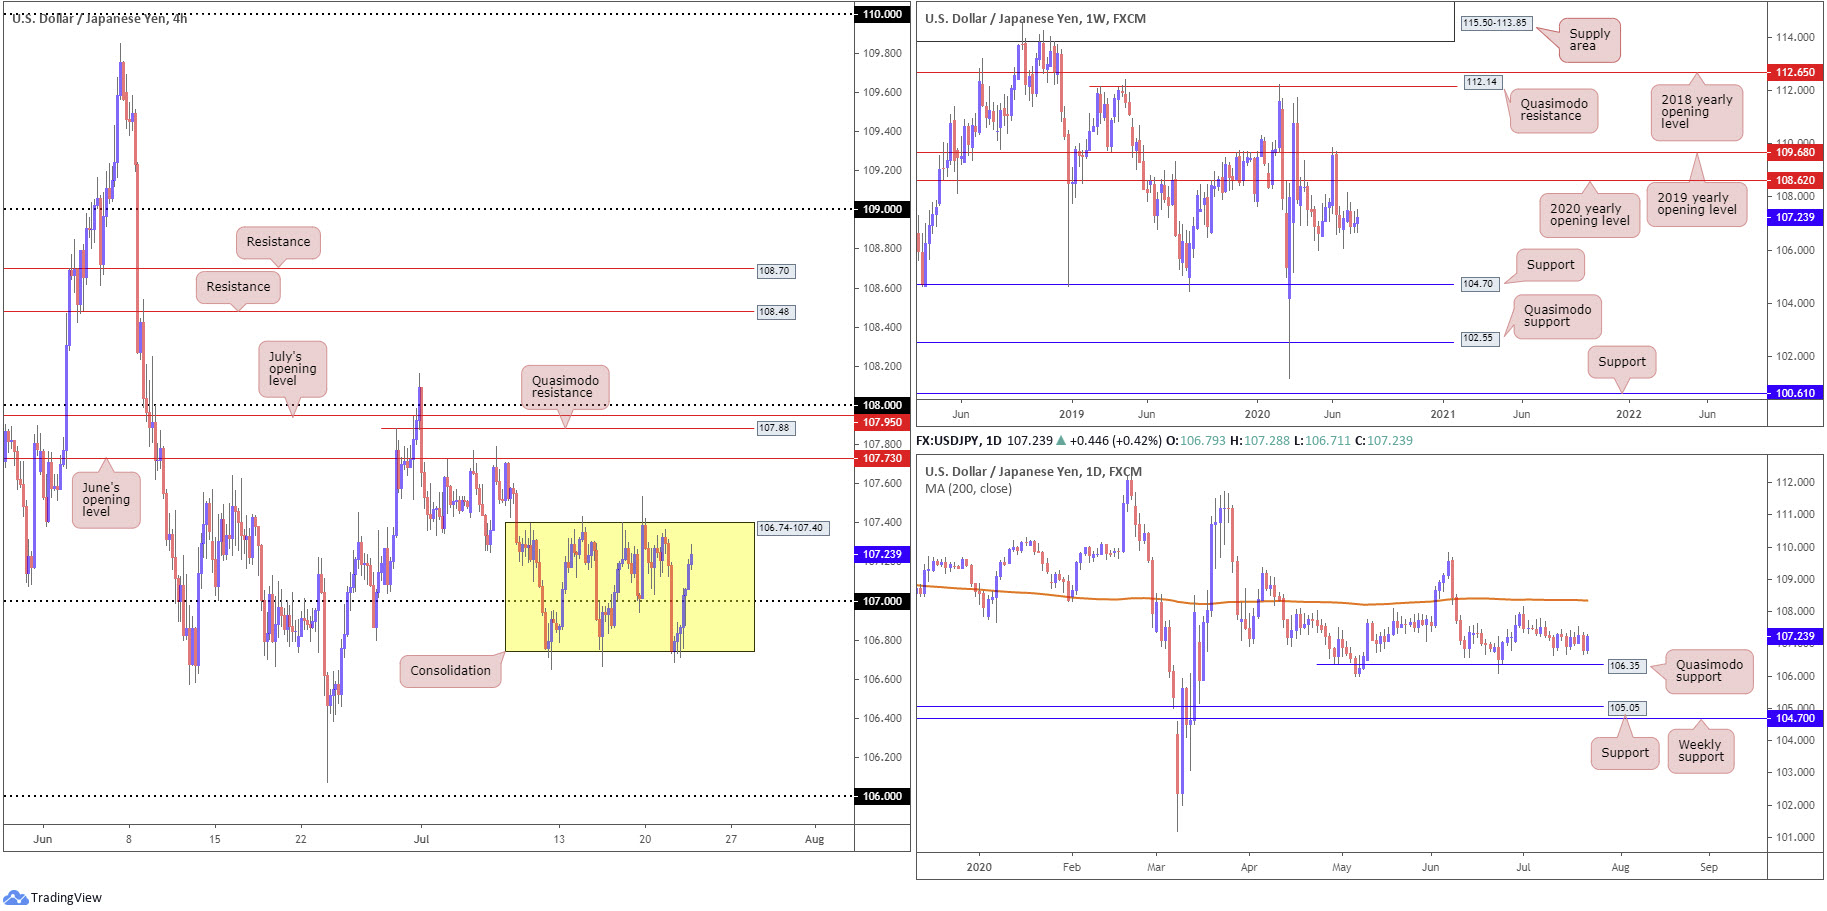
Since early July, the H4 candles have been entrenched within a consolidation (yellow) between 106.74-107.40, a reasonably wide range that houses the 107 handle. Outside of the aforementioned range, the spotlight is focused on June’s opening level at 107.73 and the 106 handle.
Further out on the weekly timeframe, price is seen consolidating beneath the 2020 yearly opening level at 108.62. Support, on the other hand, can be derived from the 105.98 6th May low, with a breach uncovering long-term support plotted at 104.70. Candle action on the daily timeframe remains focused on Quasimodo support from 106.35 and the 200-day SMA (orange – 108.34) as resistance, assuming we get past the 108.16 July 1st high.
Areas of consideration:
Owing to the height of the H4 consolidation between 106.74-107.40, range traders may, should we connect with 107.40, seek bearish themes back to at least 107. A breakout north of here, on the other hand, will perhaps spark additional upside towards June’s opening level at 107.73, unlocking the door to potential intraday bullish scenarios.
USD/CAD:
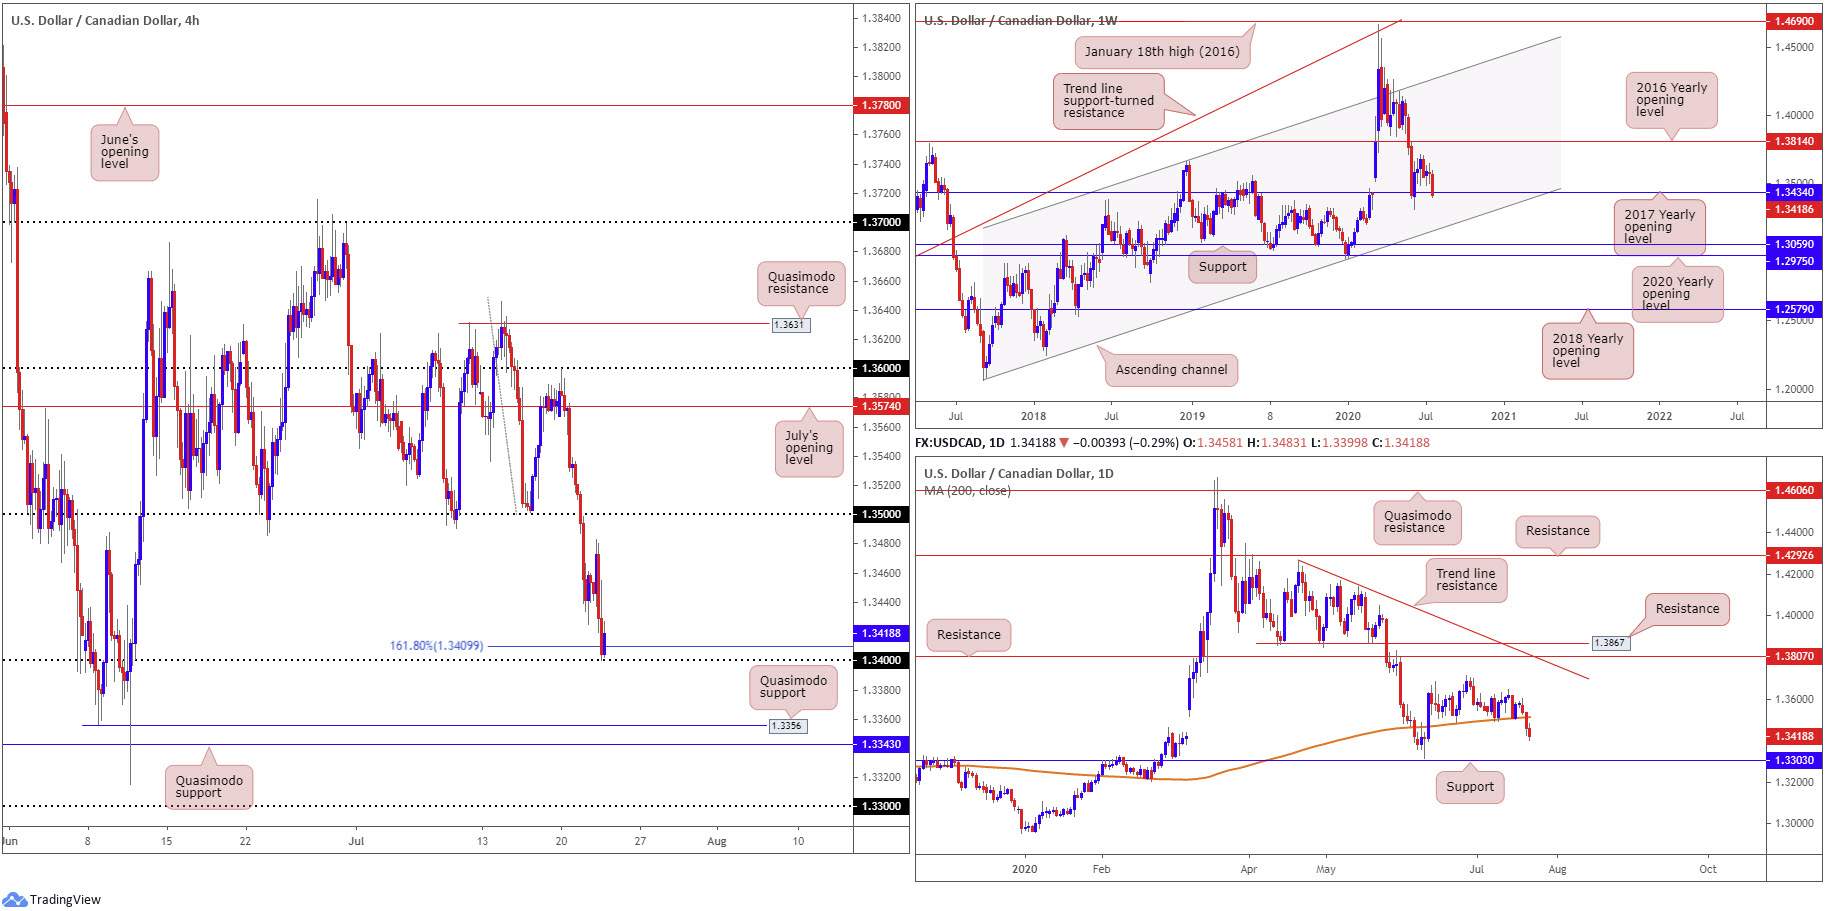
The US dollar, despite an early recovery attempt, shed ground against the Canadian dollar Wednesday, recording a third consecutive daily loss. The US dollar index plunged through 95.00, WTI put up a modest rally and Statistics Canada revealed inflation, measured by the Consumer Price Index, advanced, collectively sending USD/CAD to the 1.34 neighbourhood and 161.8% H4 Fibonacci extension support at 1.3409. To push through this zone will shine the intraday spotlight on Quasimodo support at 1.3356, followed by another Quasimodo support at 1.3343.
Price action, based on the weekly timeframe, has support, by way of the 2017 yearly opening level, from 1.3434 in play. Below 1.3434, channel support, taken from the low 1.2061, can be viewed as the next potential floor. A USD/CAD bid, nevertheless, throws the 2016 yearly opening level at 1.3814 in the pot as feasible resistance, with follow-through buying to try and tackle a dense block of supply between 1.4190/1.3912.
Movement on the daily timeframe shows Tuesday ruptured the 200-day SMA (orange – 1.3512) and extended losses Wednesday. Continued downside, according to chart structure, is likely until reaching support priced in at 1.3303.
Areas of consideration:
Although USD/CAD trades south of the 200-day SMA (1.3512), suggesting a continuation to the downside, weekly price trades around support from 1.3434. This may lead to buyers making a show from 1.34 and the 161.8% H4 Fibonacci extension support at 1.3409 today.
Violating 1.34, nonetheless, could draw intraday sellers into the fold to approach H4 Quasimodo support at 1.3356. Conservative traders threatened by weekly price scratching support would likely wait and see if H4 retests 1.34 as resistance before pulling the trigger.
USD/CHF:
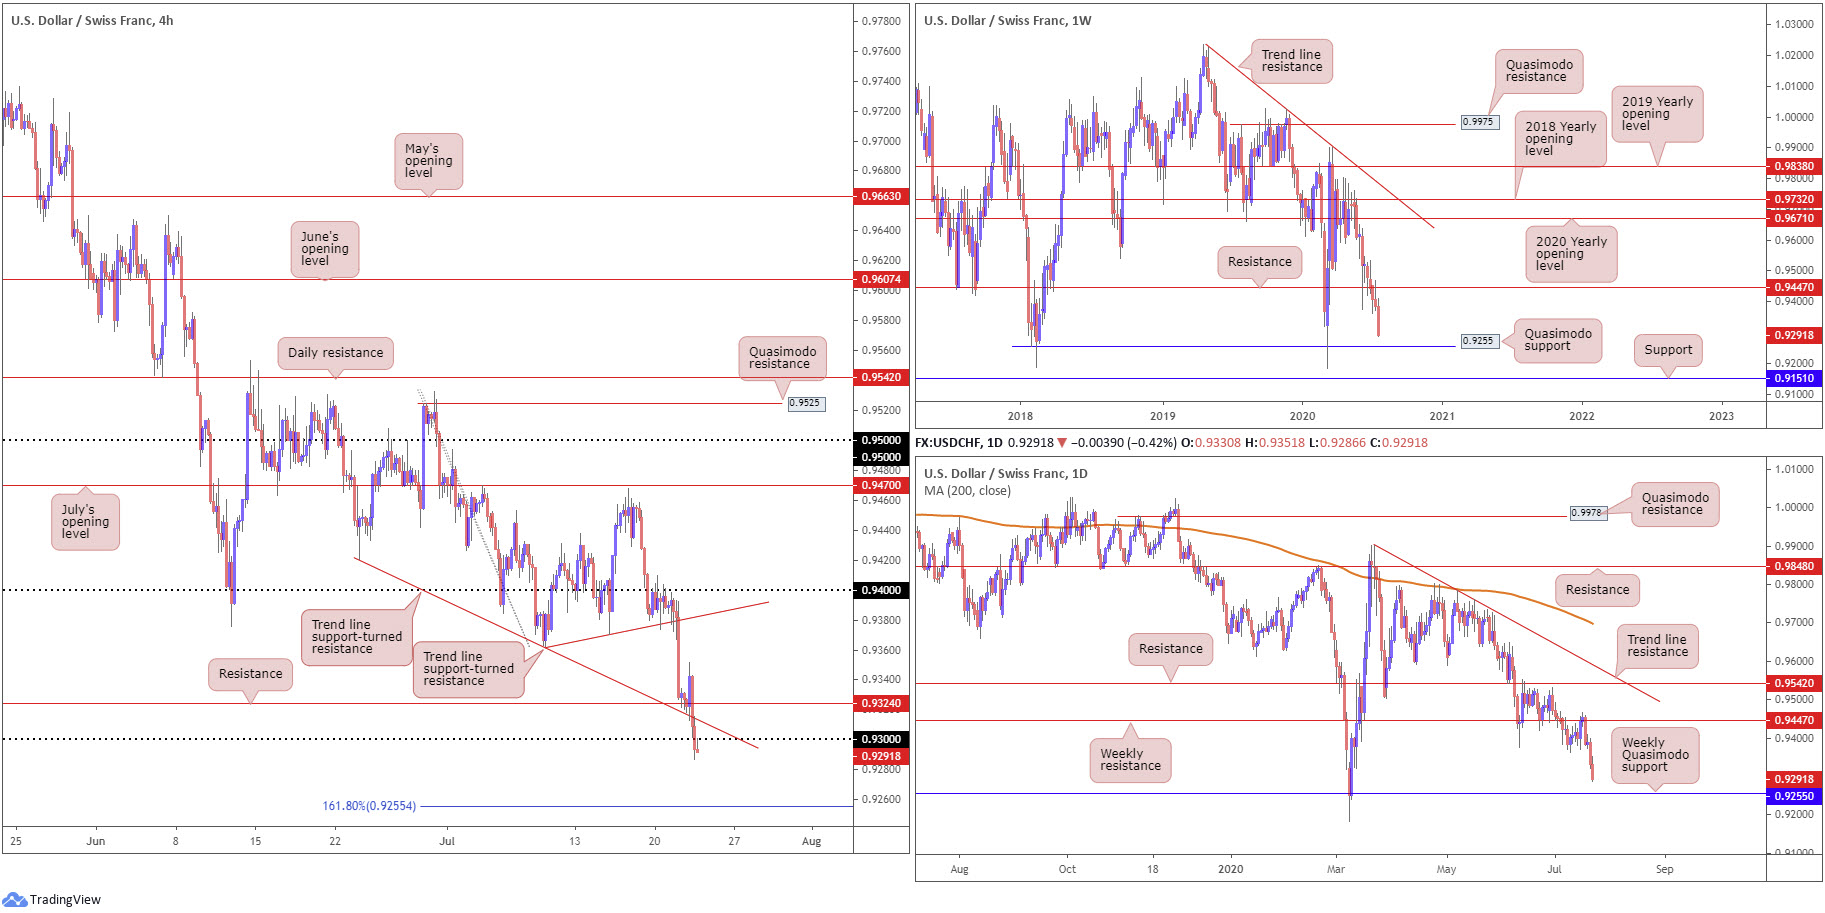
Wednesday had the US dollar sink further against the Swiss franc, pulled lower amidst persistent USD downside observed through the US dollar index, recently crunching through 95.00.
USD/CHF, based on the H4 timeframe, observed support at 0.9324, trend line support, taken from the low 0.9420, and the round number 0.93 give way (now serving resistances). This potentially sets the stage for a continuation move towards a 161.8% Fibonacci extension level at 0.9255.
In terms of higher timeframes, price action remains firmly under weekly resistance at 0.9447, with both daily and weekly price making its way towards weekly Quasimodo support coming in at 0.9255. Readers will also acknowledge the weekly Quasimodo support and 161.8% H4 Fibonacci extension share the same price level.
Areas of consideration:
Traders short the break of local trend line support on the H4, from 0.9362, currently trade in considerable profits, with further gain likely on the horizon to 0.9255. With that being the case, intraday sellers may make use of the recent break under 0.93 today, with conservative players likely eyeing the current H4 candle (retesting 0.93) for bearish cues.
Dow Jones Industrial Average:
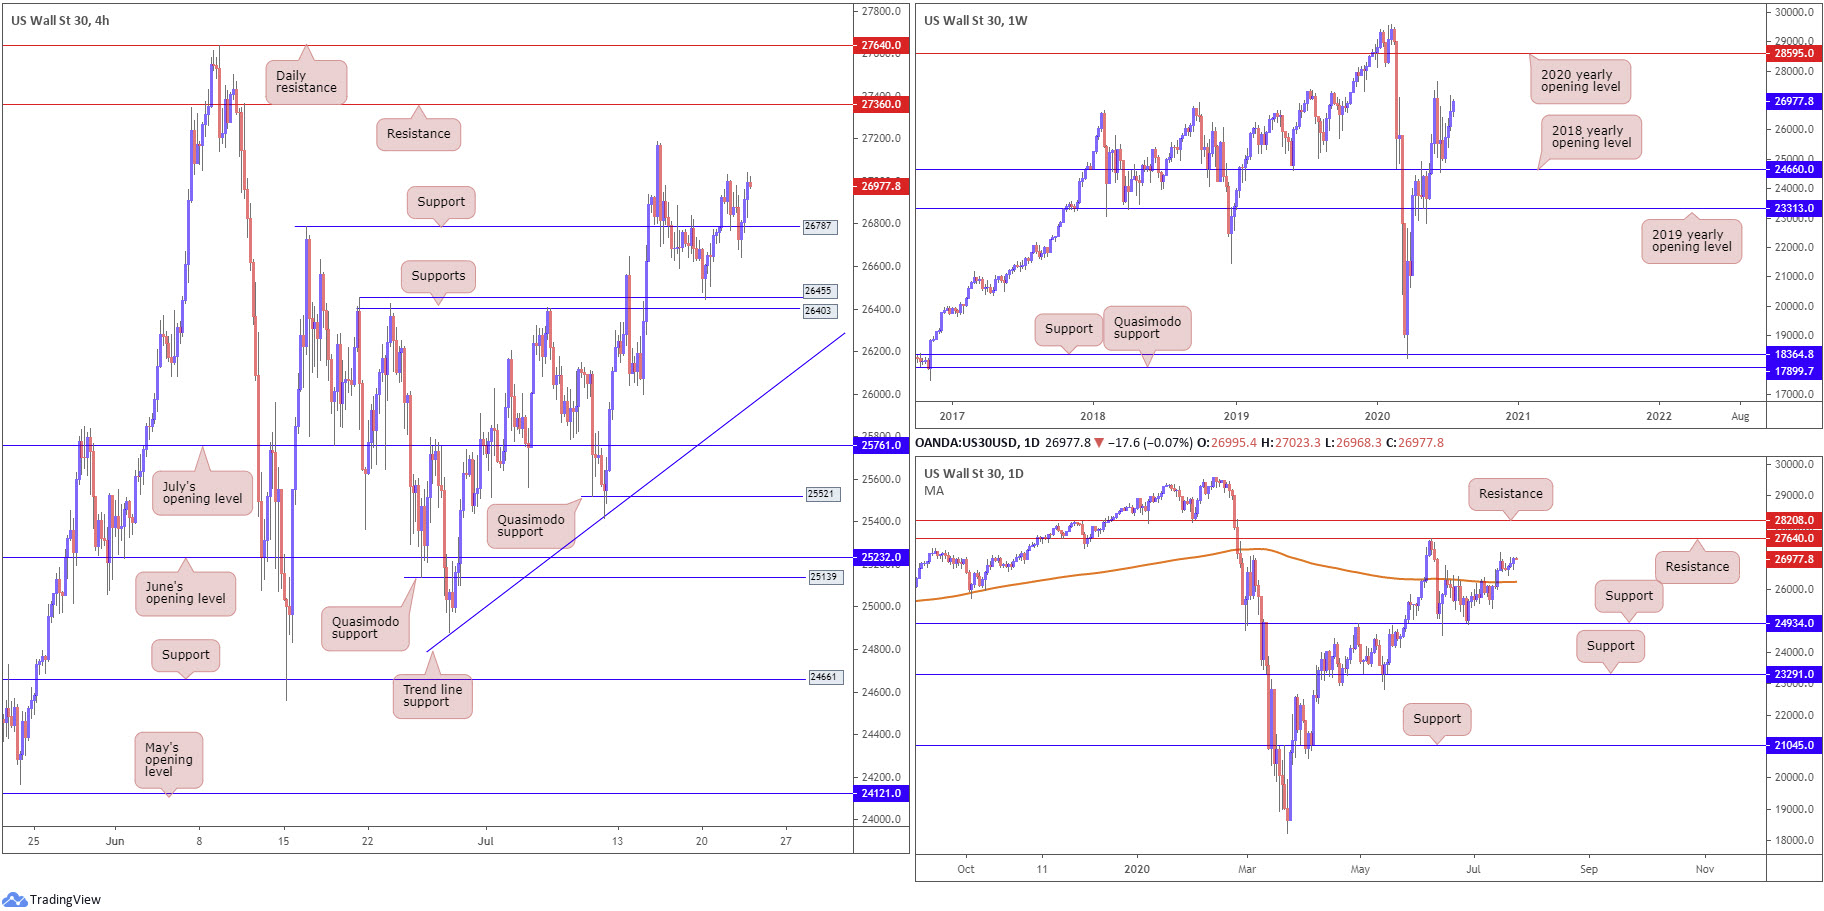
US equities finished Wednesday higher across the board as investors digested the possibility of a new spending bill versus tensions with China. The Dow Jones Industrial Average advanced 165.44 points, or 0.62%; the S&P 500 advanced 18.72 points, or 0.57%, and the tech-heavy Nasdaq 100 concluded higher by 37.68 points, or 0.35%.
H4 held support at 26787 Wednesday, despite dipping to lows at 26644, and shaped a modest daily bullish engulfing candle. Holding north of 26787 today opens things up to the 27187 July 15 high, closely shadowed by resistance at 27360.
The story on the daily timeframe reveals the 200-day SMA (orange – 26256) recently gave way, a dynamic value capping upside since mid-June. Despite price action entering into a consolidation since, the transition higher has shifted focus towards resistance at 27640.
Meanwhile, from the weekly timeframe, the 2018 yearly opening level at 24660 remains an important base of support, with traders likely to pull in the 27638 high, followed by a possible run to the 2020 yearly opening level at 28595.
Areas of consideration:
The retest at 26787 H4 support, albeit somewhat deep, has, as expected, enticed dip-buying strategies. Well done to those who managed to catch this move – the 27187 July 15 high, as noted above, is in position as the first take-profit target.
XAU/USD (GOLD):
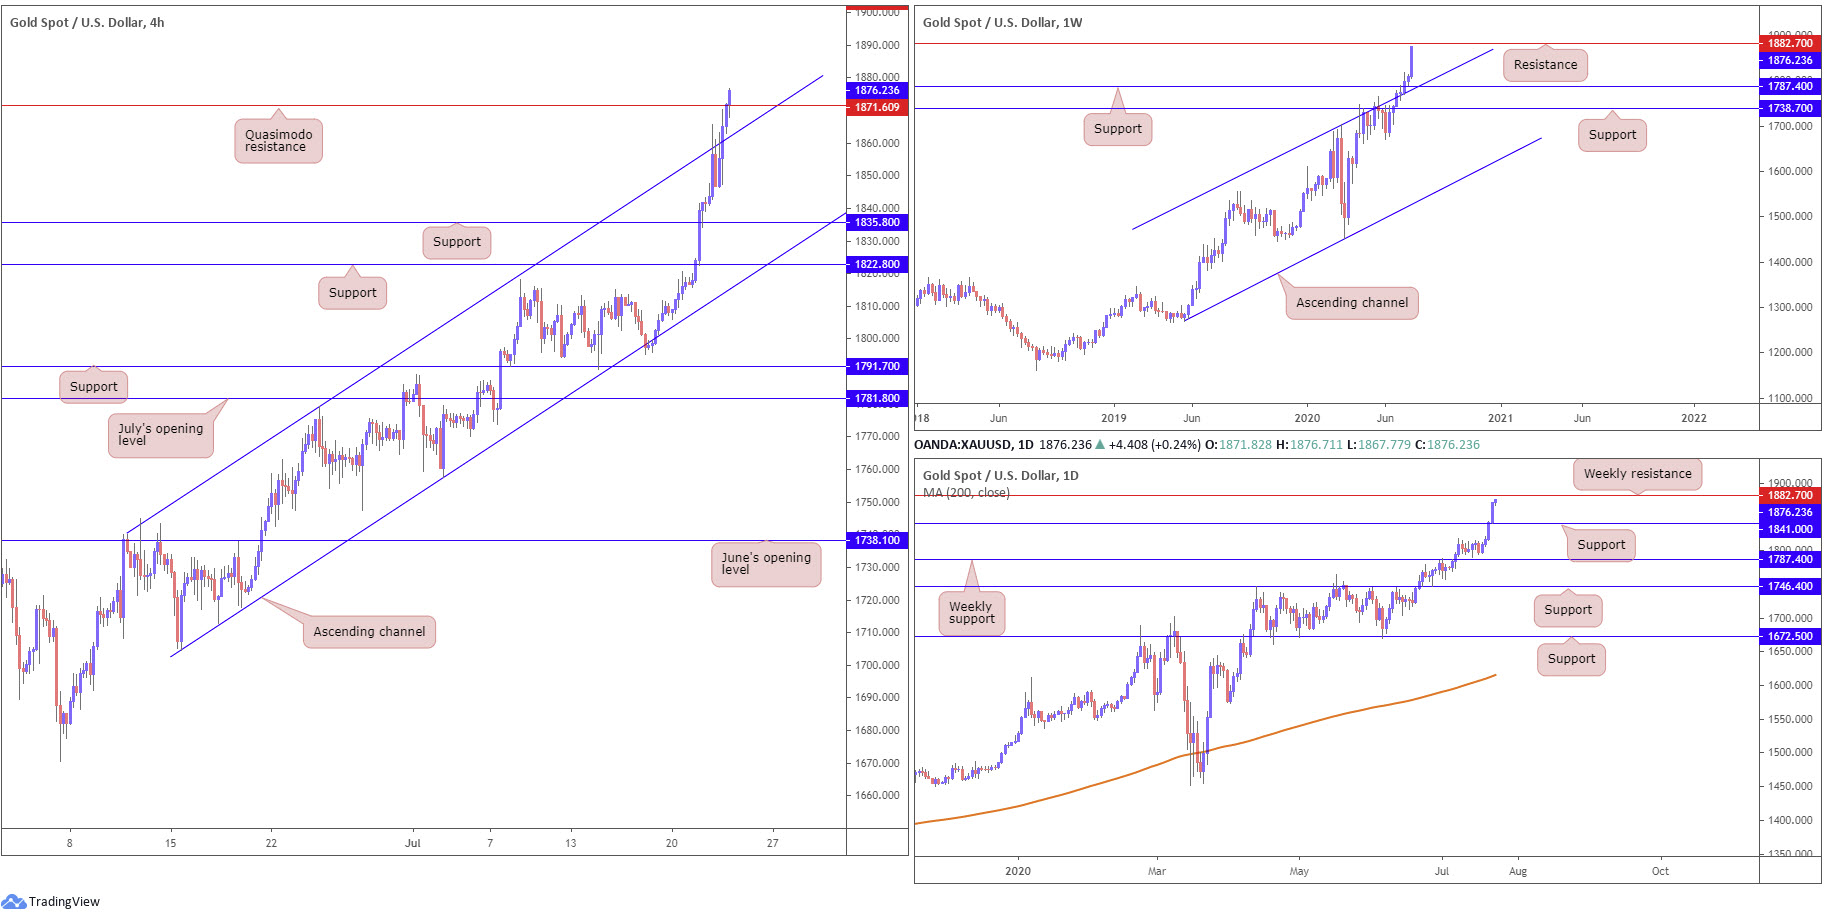
Technical buying, safe-haven demand and a soft US dollar index, guided XAU/USD northbound Wednesday, recording a fourth consecutive daily gain. Reaching highs not seen since early September 2011, weekly price is on course to cross paths with resistance coming in at 1882.7.
A closer examination of price movement on the daily timeframe reveals Quasimodo resistance at 1841.0 ceded ground yesterday (now serves as support), throwing the aforementioned weekly resistance into the pot as the next upside target.
Across the page on the H4 timeframe, we can see that after price soaked up countertrend sellers off channel resistance, taken from the high 1779.4, Quasimodo resistance made an appearance at 1871.6. The latter, however, is showing signs of weakening today, implying we’re likely headed for weekly resistance mentioned above at 1882.7.
Areas of consideration:
H4 closing above Quasimodo resistance at 1871.6 will likely encourage further buying, with hopes of boarding the current uptrend. Yet, breakout buyers may wobble today as the yellow metal closes in on weekly resistance at 1882.7.
Closing north of 1882.7, on the other hand, shines the spotlight on another H4 Quasimodo resistance at 1903.4 and highlights potential bullish themes.
The accuracy, completeness and timeliness of the information contained on this site cannot be guaranteed. IC Markets does not warranty, guarantee or make any representations, or assume any liability regarding financial results based on the use of the information in the site.
News, views, opinions, recommendations and other information obtained from sources outside of www.icmarkets.com.au, used in this site are believed to be reliable, but we cannot guarantee their accuracy or completeness. All such information is subject to change at any time without notice. IC Markets assumes no responsibility for the content of any linked site.
The fact that such links may exist does not indicate approval or endorsement of any material contained on any linked site. IC Markets is not liable for any harm caused by the transmission, through accessing the services or information on this site, of a computer virus, or other computer code or programming device that might be used to access, delete, damage, disable, disrupt or otherwise impede in any manner, the operation of the site or of any user’s software, hardware, data or property.


