
Key risk events today:
BoE Gov Bailey Speaks; US Unemployment Claims; US CB Leading Index m/m; New Zealand CPI q/q.
(Previous analysis as well as outside sources – italics).
EUR/USD:
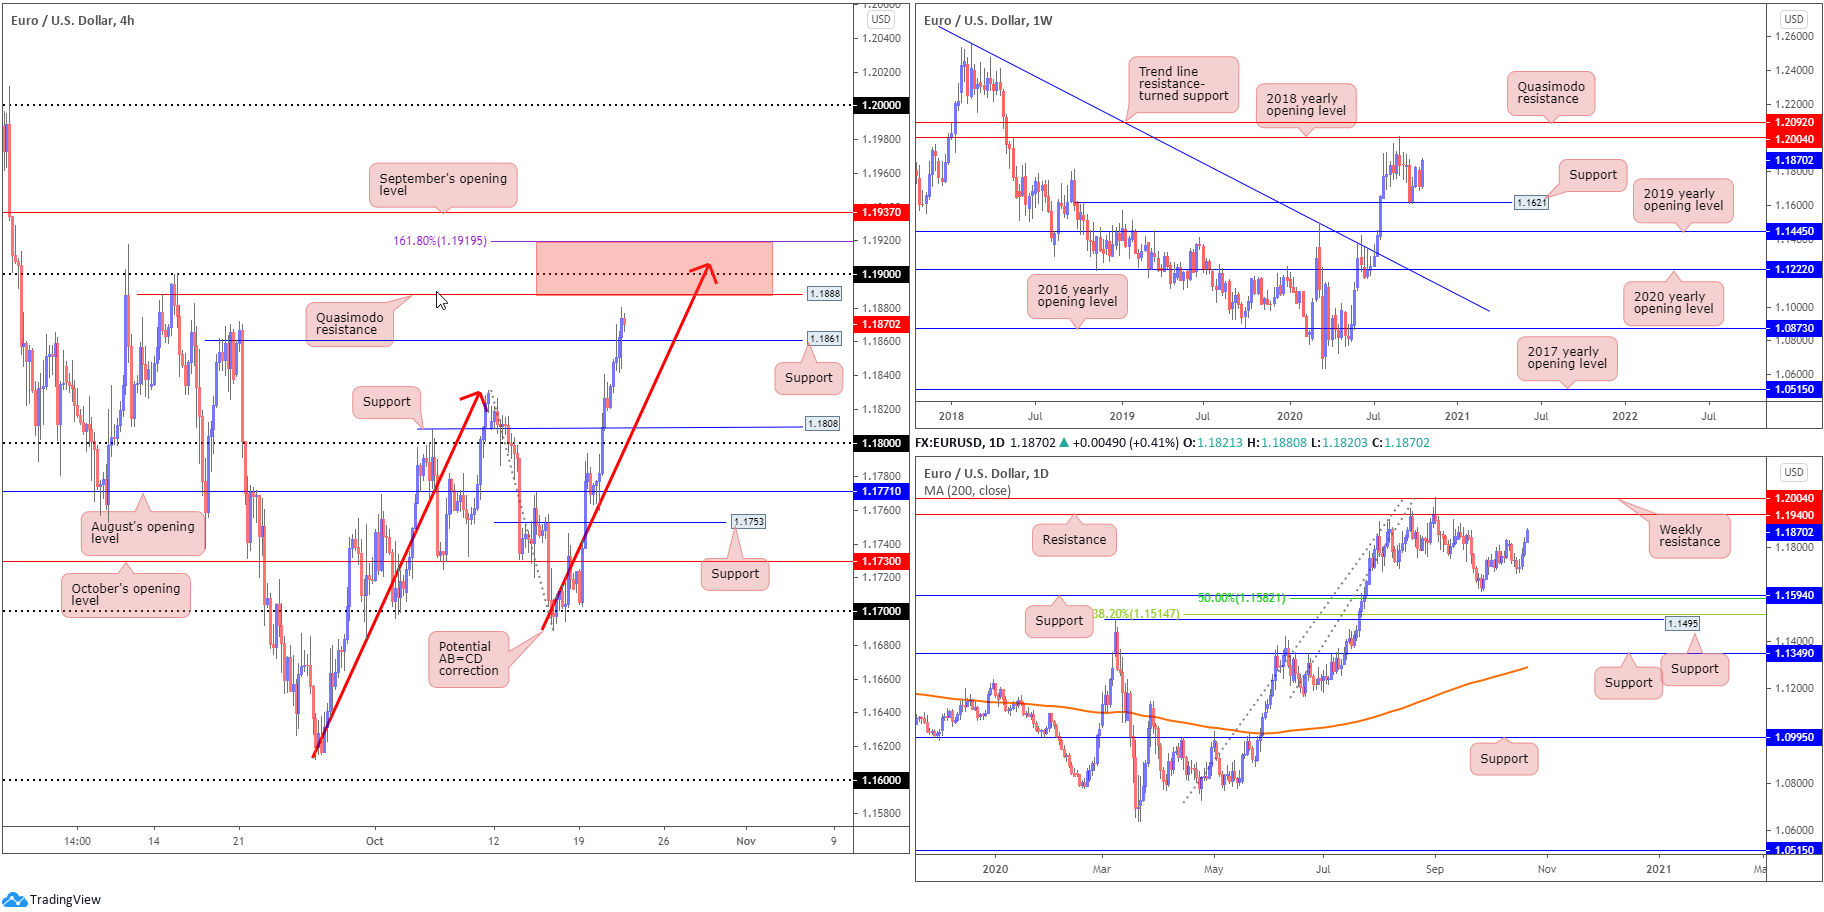
Europe’s single currency extended its bullish position against a broadly softer USD Wednesday (DXY crossed below 93.00).
Technicians, according to the weekly timeframe, will acknowledge room to advance, as bulls strengthen their position north of minor support at 1.1621. The next upside target on the weekly scale falls in around the 2018 yearly opening value at 1.2004 (a level that capped upside attempts in late August).
The technical position on the daily timeframe also exhibits scope to explore higher terrain, with little stopping bulls from taking a run at resistance coming in from 1.1940. It is worth noting this base is sited just under weekly resistance mentioned above at 1.2004.
A closer reading of price action on the H4 timeframe shows the candles taking a breather north of a recently breached Quasimodo resistance at 1.1861 (now potential support). Taking to higher levels today could see buyers square off with another Quasimodo resistance at 1.1888. Additionally, the 1.19 handle is close by, along with an AB=CD correction point at 1.1905 (red arrows) and a 1.618 BC projection plotted at 1.1919.
Areas of consideration:
- The H4 zone marked red between 1.1919/1.1888 is made up of strong H4 resistances and, therefore, may contain enough fuel to prompt a bearish reply.
- While the H4 area underlined above offers appeal, September’s opening value on the H4 timeframe at 1.1937, and its connection with daily resistance at 1.1940, opens up the possibility of a fakeout forming through 1.1919 before sellers make an appearance.
GBP/USD:
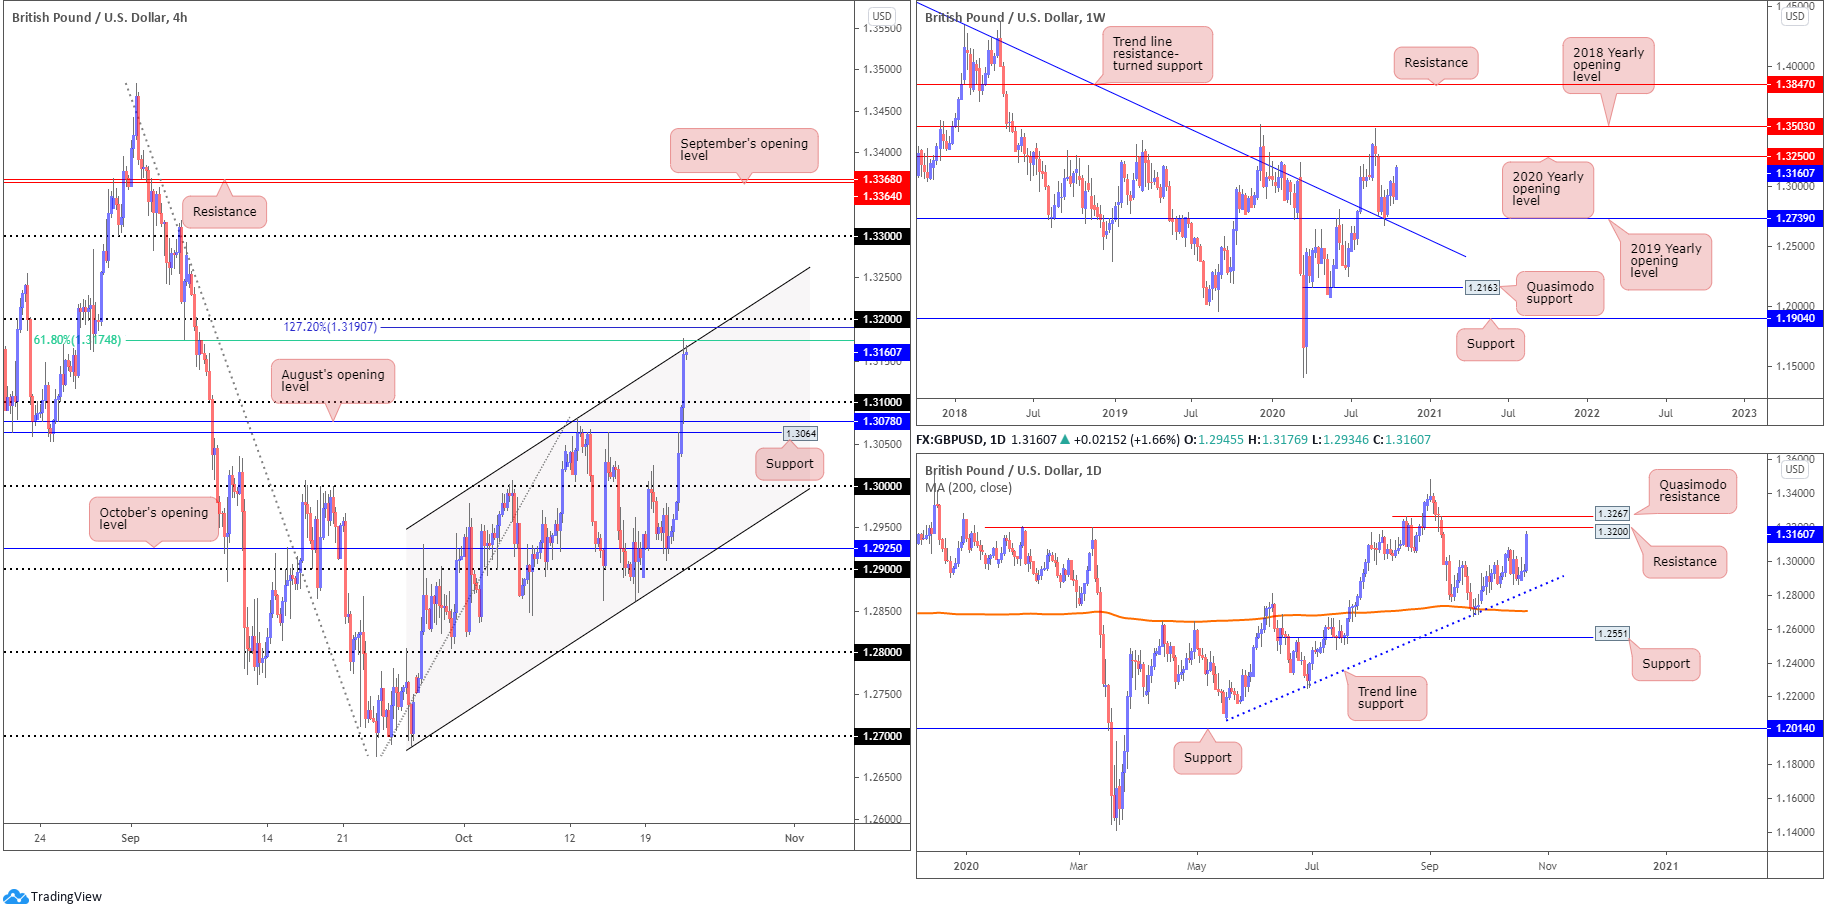
Sterling surged Wednesday, registering a fresh six-week high against the US dollar, amid reports Brexit negotiations are due to restart next week.
Weekly price, as evident from the chart, is seen pursuing resistance at 1.3250, a 2020 yearly opening value, while daily action nears resistance from 1.3200, shadowed closely by a Quasimodo resistance at 1.3267.
Across the page on the H4 timeframe, we can see recent upside welcomed channel resistance, taken from the high 1.3082. Note this area also converges with a 61.8% Fibonacci retracement ratio at 1.3174 and a nearby 127.2% Fibonacci projection point at 1.3190, along with the 1.32 handle.
Areas of consideration:
- Daily resistance plotted at 1.3200, a base blending with H4 resistance confluence (see above in bold), could weigh on continuation moves today. Technically, a correction to 1.31 may be on the cards.
- Clearance of 1.32, however, unlocks potential bullish scenarios to weekly resistance at 1.3250, followed by daily Quasimodo resistance at 1.3267 and then the 1.33 handle based on the H4.
AUD/USD:
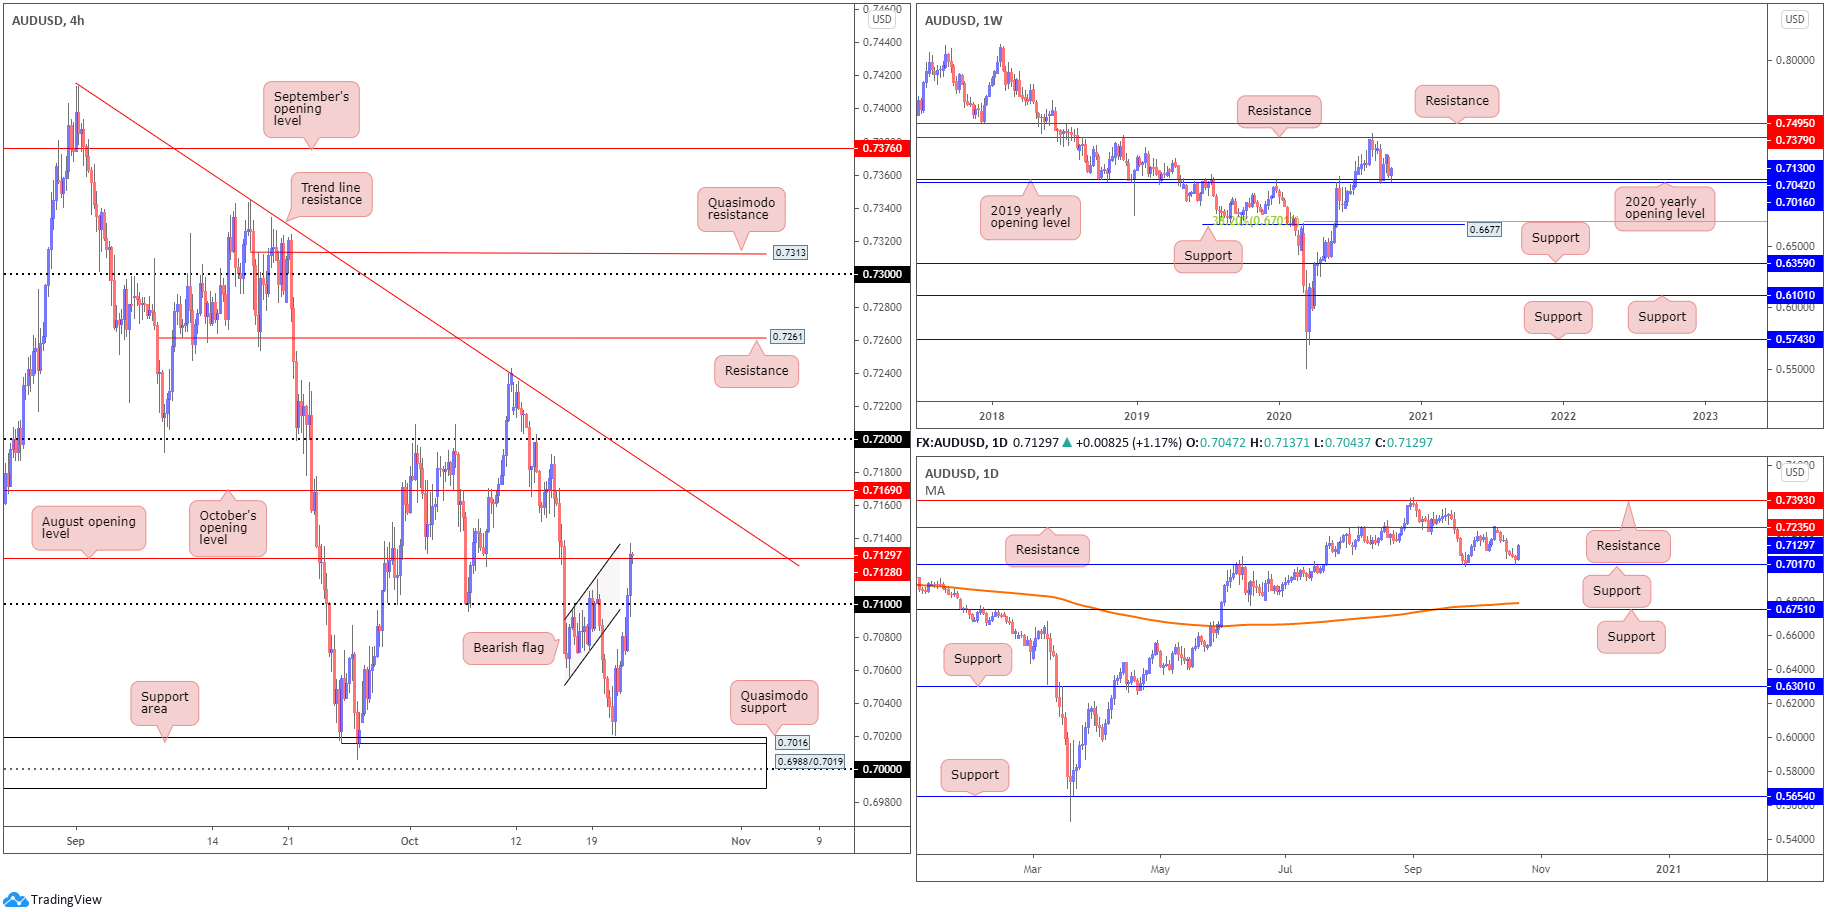
The Australian dollar continued to pursue higher ground against soft USD demand on Wednesday, pulling H4 candles above the 0.71 handle to August’s opening value at 0.7128. Continuation moves north of the latter shines the spotlight on October’s opening value at 0.7169, which happens to intersect with a trend line resistance, extended from the high 0.7413.
Recent buying, technically, should not really be a surprise. Wednesday’s technical briefing noted we’re coming from weekly support (made up of the 2020 [0.7016] and 2019 [0.7042] yearly opening values), together with daily price bottoming three pips ahead of support at 0.7017. As for the trend, AUD/USD has also offered a healthy bullish stance since early 2020.
Areas of consideration:
- Owing to where we trade on the higher timeframes, continuation moves above August’s opening value at 0.7128 on the H4 is a possible setup to be aware of, targeting 0.7169. Conservative buyers might opt to wait and see if a 0.7128 retest forms before committing.
USD/JPY:
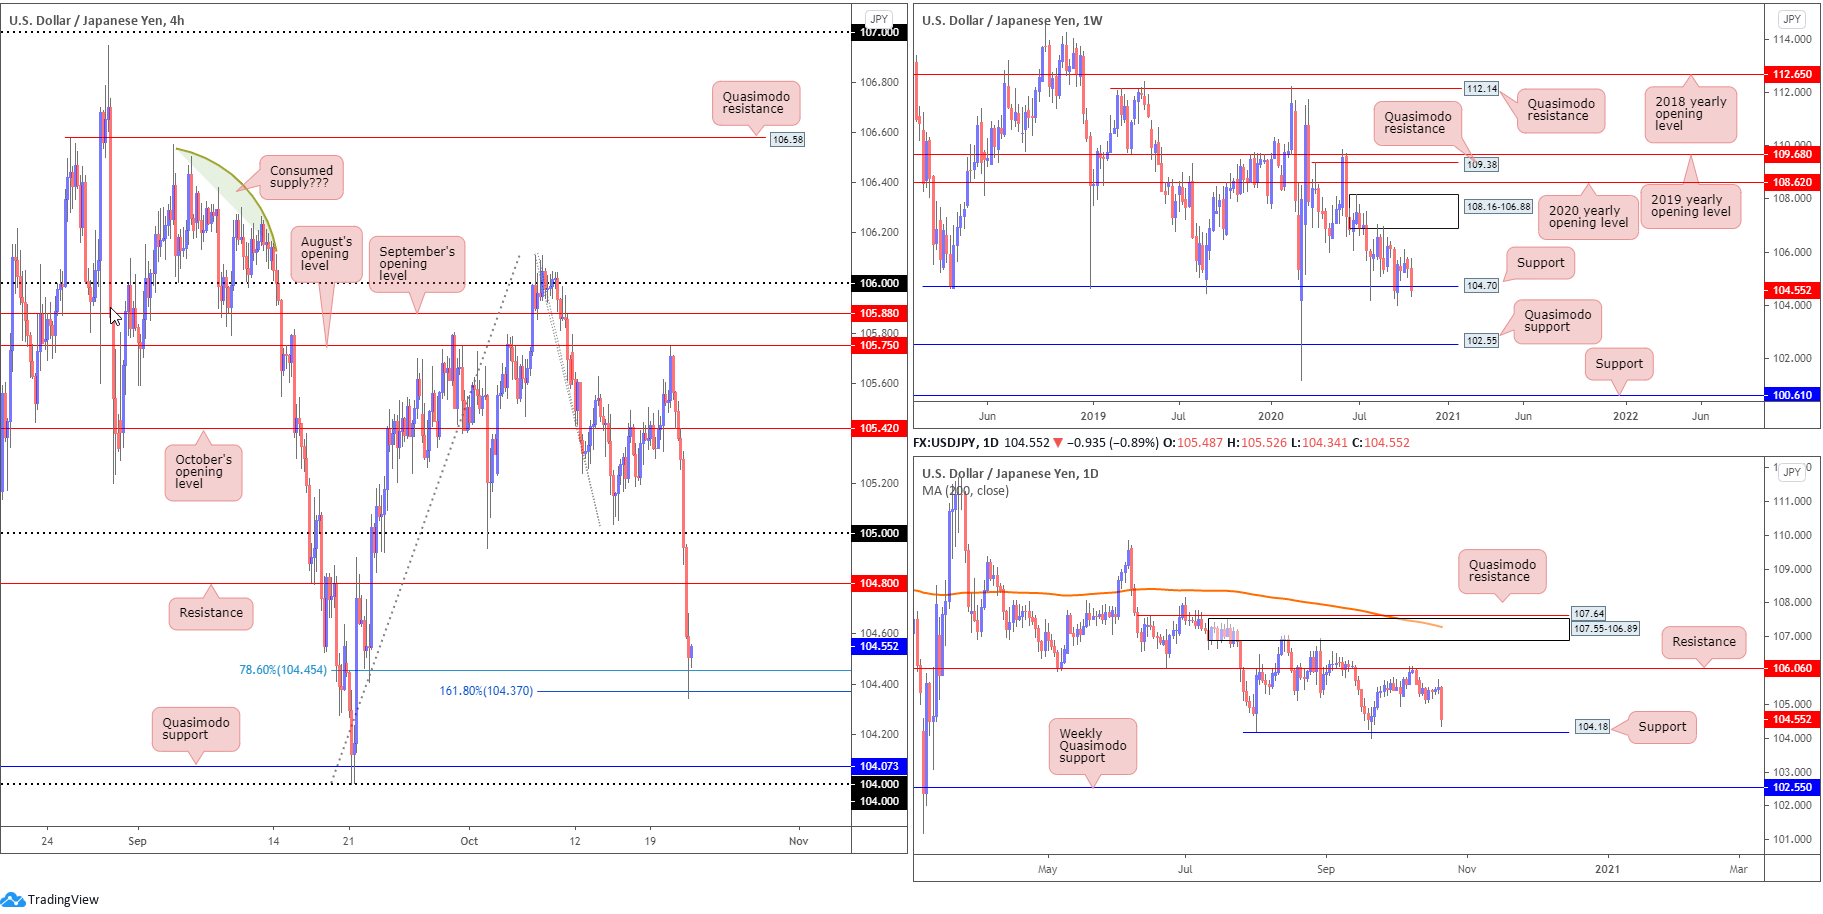
USD/JPY collapsed Wednesday amidst broad USD weakness, with technical shorts established south of October’s opening value at 105.42, the 105 handle and support at 104.80 (now potential resistance) exacerbating downside pressure on the H4 scale. Bearish targets, assuming we breach the 161.8% Fibonacci projection point at 104.37 (and 78.6% Fibonacci retracement ratio at 104.45), can be seen at Quasimodo support from 104.07, shadowed by the 104 handle.
Further afield, weekly price entered space south of support at 104.70. Though taking bearish breakout positions based on this may prove challenging, given the level has welcomed a number of whipsaws in the past. In addition to this, daily price eyes nearby support fixed from 104.18. Breaking the latter, however, could spark strong bearish interest, with weekly Quasimodo support at 102.55 targeted.
Areas of consideration:
- The 104 handle, H4 Quasimodo support at 104.07 and daily support priced in at 104.18 forms a tight support area to be mindful of.
- Continued support off the 161.8% H4 Fibonacci projection point at 104.37 and 78.6% Fibonacci retracement ratio at 104.45 could have bulls target H4 resistance at 104.80. Though do bear in mind, the H4 Fibs lack higher timeframe confluence.
USD/CAD:
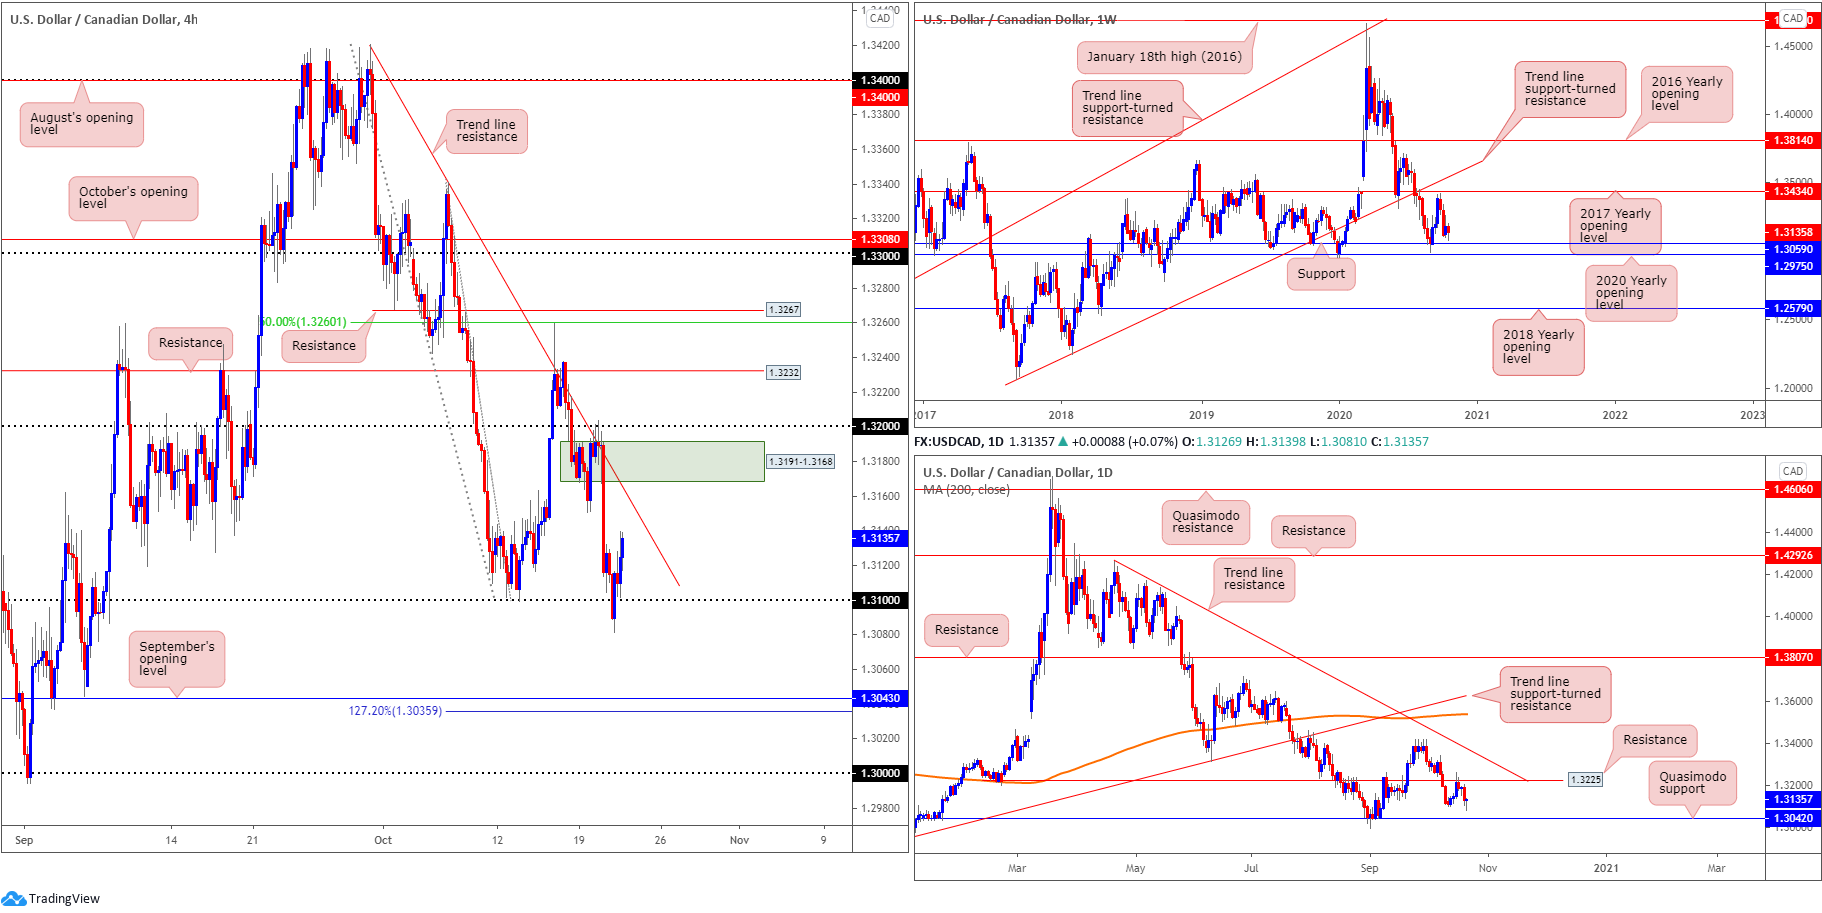
Wednesday witnessed H4 knock on the door of 1.31 and, albeit following a rather painful whipsaw to lows at 1.3081, stage a stronger-than-expected recovery. Technically, this swerves trend line resistance, taken from the high 1.3420, into sight, with a break exposing supply (green) around 1.3191-1.3168 (sited south of 1.32). Digging under 1.31, however, will have traders’ crosshairs shift towards September’s opening value at 1.3043 (according to our charts), closely shadowed by a 127.2% Fibonacci projection point at 1.3036.
Following a two-week decline south of the 2017 yearly opening value at 1.3434 on the weekly timeframe, price discovered a floor ahead of support at 1.3059 in recent dealings (arranged above the 2020 yearly opening value at 1.2975).
Daily resistance at 1.3225 nudged its way into the spotlight last week and, as you can see, served sellers well. Downside momentum subsided Wednesday, however, responding by way of a hammer candle pattern. Should the Canadian dollar remain on the winning side of the table going forward, though, revisiting Quasimodo support coming in at 1.3042 is a possible scenario.
Areas of consideration:
- As both weekly and daily timeframes exhibit scope to move as far south as 1.3059 (weekly timeframe), reacting from H4 trend line resistance (1.3420) or H4 supply at 1.3191-1.3168 is a possibility.
- Tunnelling under 1.31 on the H4 also unchains a potential bearish theme, targeting 1.3059 as an initial take-profit zone.
USD/CHF:
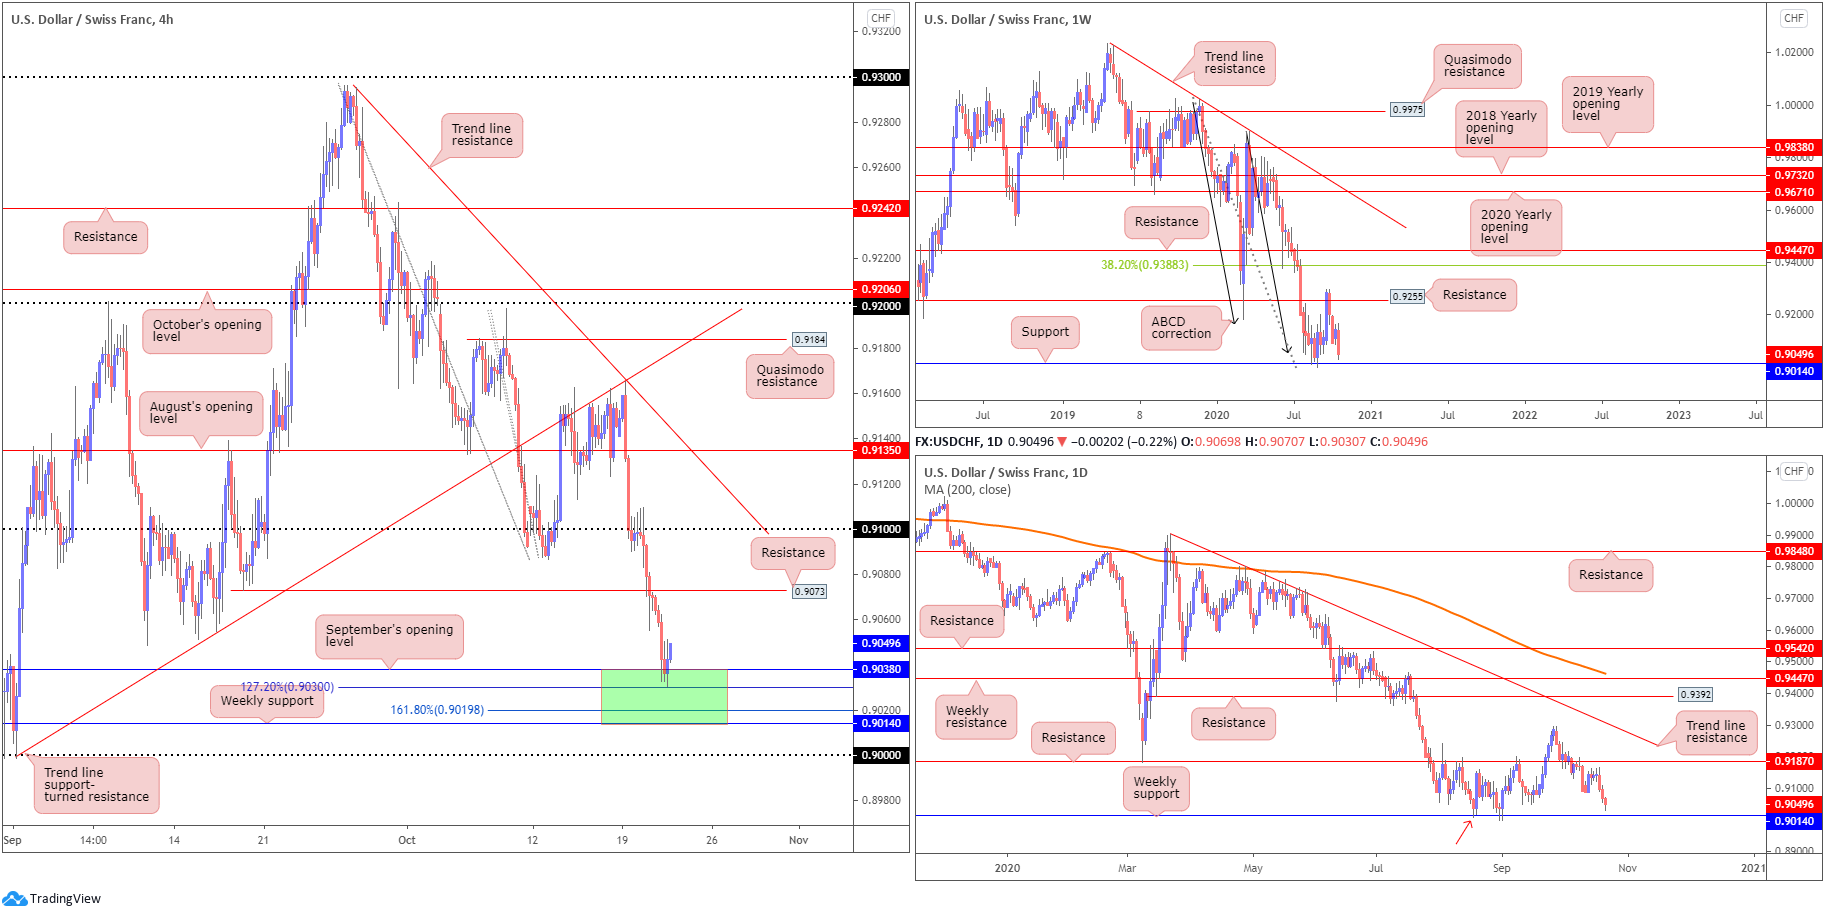
The US dollar extended its bearish position against the Swiss franc Wednesday, consequently generating a third consecutive daily bearish candle.
Based off the weekly timeframe’s technical position, we can see the unit fast approaching support at 0.9014, bolstered by ABCD support at 0.9051 (black arrows). Closer analysis of price action on the daily timeframe also reveals the pair closing in on weekly support mentioned above at 0.9014, after failing to grip resistance priced in at 0.9187. What’s interesting is weekly support on the daily chart also represents a Quasimodo support (red arrow – left shoulder).
Looking over the H4 chart, technical eyes will note September’s opening value at 0.9038, with the help of a 127.2% Fibonacci projection point at 0.9030, withstood downside attempts Wednesday. This could, assuming buyers maintain a bullish position, take the currency pair to H4 resistance at 0.9073. Interestingly, though, a break of 0.9030 leads price to a 161.8% Fibonacci projection point at 0.9019, sited ahead of weekly support underlined above at 0.9014.
Areas of consideration:
- The area marked green on the H4 timeframe between weekly support at 0.9014 and September’s opening value from 0.9038 echoes strong support.
- While there is clearly some interest from buyers out of the upper range of 0.9014/0.9038 (likely a combination of short covering and fresh long positions), a dive into the area to test weekly support at 0.9014 could develop before buyers gather enough traction to advance towards 0.9073.
Dow Jones Industrial Average:
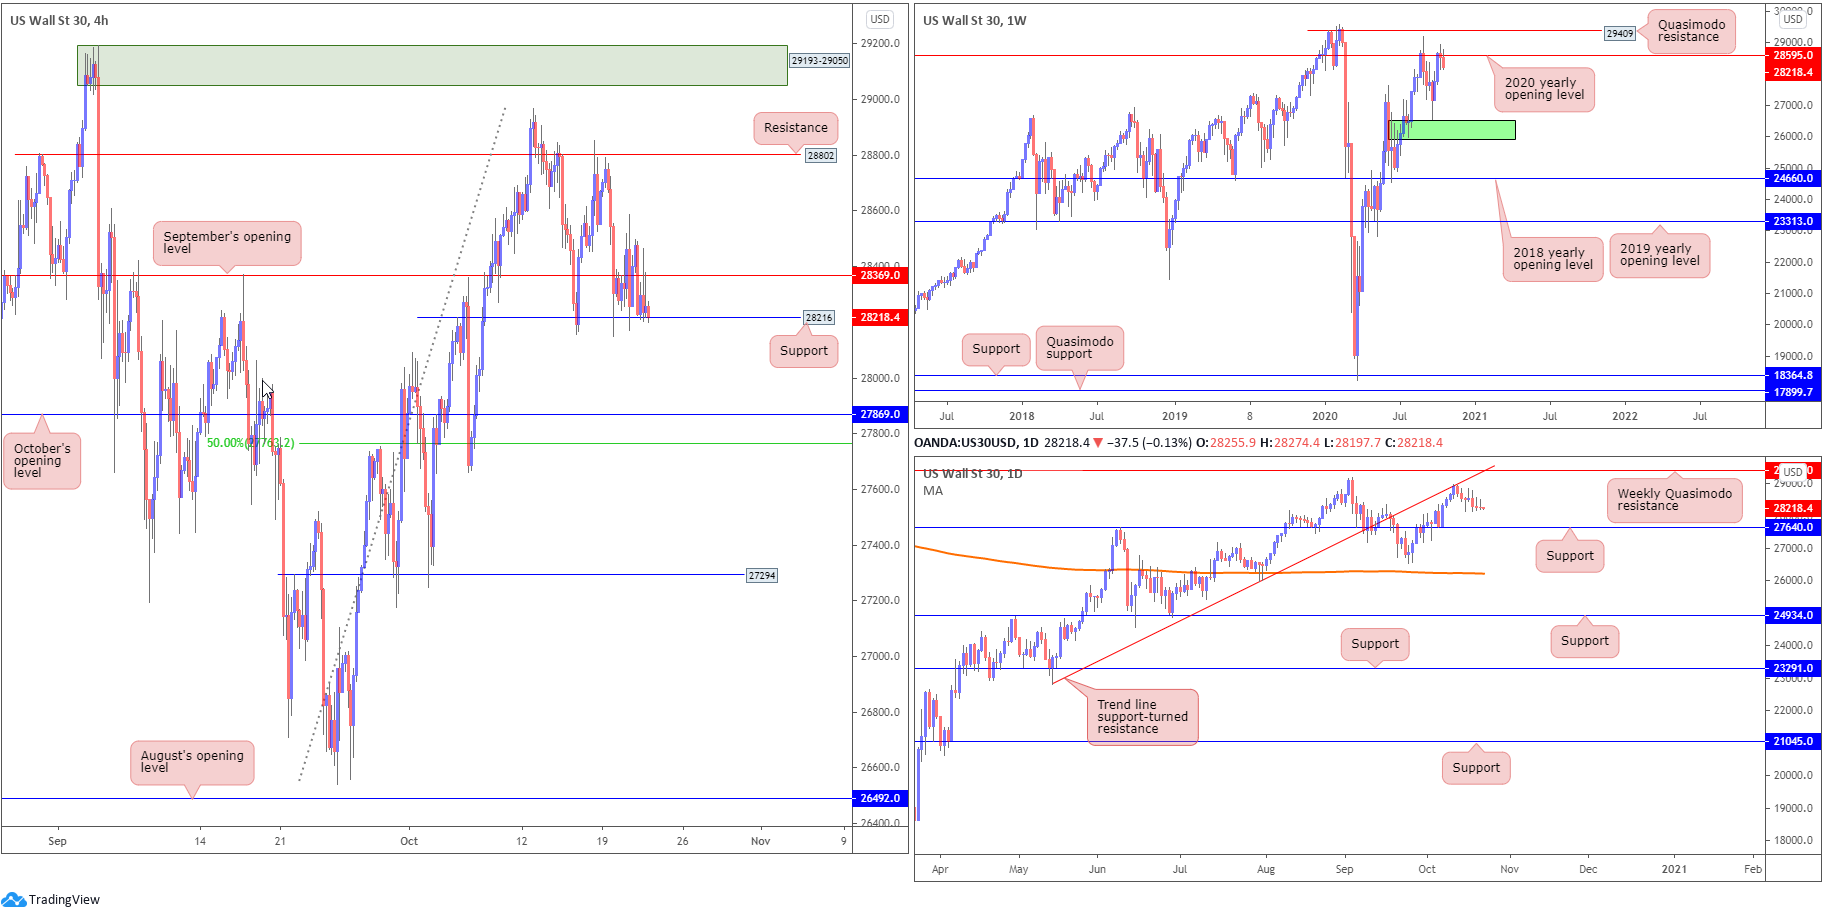
Amidst ongoing stimulus talks, major US equity benchmarks curved lower Wednesday. The Dow Jones Industrial Average shed 97.97 points, or 0.35%, the S&P 500 declined 7.56 points, or 0.22% while the Nasdaq traded lower by 31.80 points, or 0.28%.
From a technical standpoint, weekly price is seen backing off from resistance at 28595, a 2020 yearly opening value. Bearish pressure generated from weekly resistance witnessed daily price reject trend line support-turned resistance early last week, extended from the low 22803. Candlestick traders will also likely acknowledge price formed two back-to-back shooting star candlestick patterns (these formations, however, are likely to be irrelevant owing to where they’ve formed – shooting star patterns are best discovered at peaks).
Entering Thursday’s session, the H4 candles are tucked between September’s opening value at 28369 and support coming in at 28216 (a prior Quasimodo resistance level). Price readers will acknowledge that a 28216 break today draws support at 27869 (October’s opening value) into the frame and a neighbouring 50.0% retracement ratio at 27763. Whereas a rotation higher, moves that climb above 28369, shines the spotlight on resistance at 28802.
Areas of consideration:
- 28216 giving way on the H4 stirs a bearish scenario, targeting 27869.
- Daily support priced at 27640, positioned just under the 50.0% retracement ratio on the H4 at 27763 and nearby October’s opening value at 27869, delivers reasonable confluence some traders may find of use.
XAU/USD (GOLD):
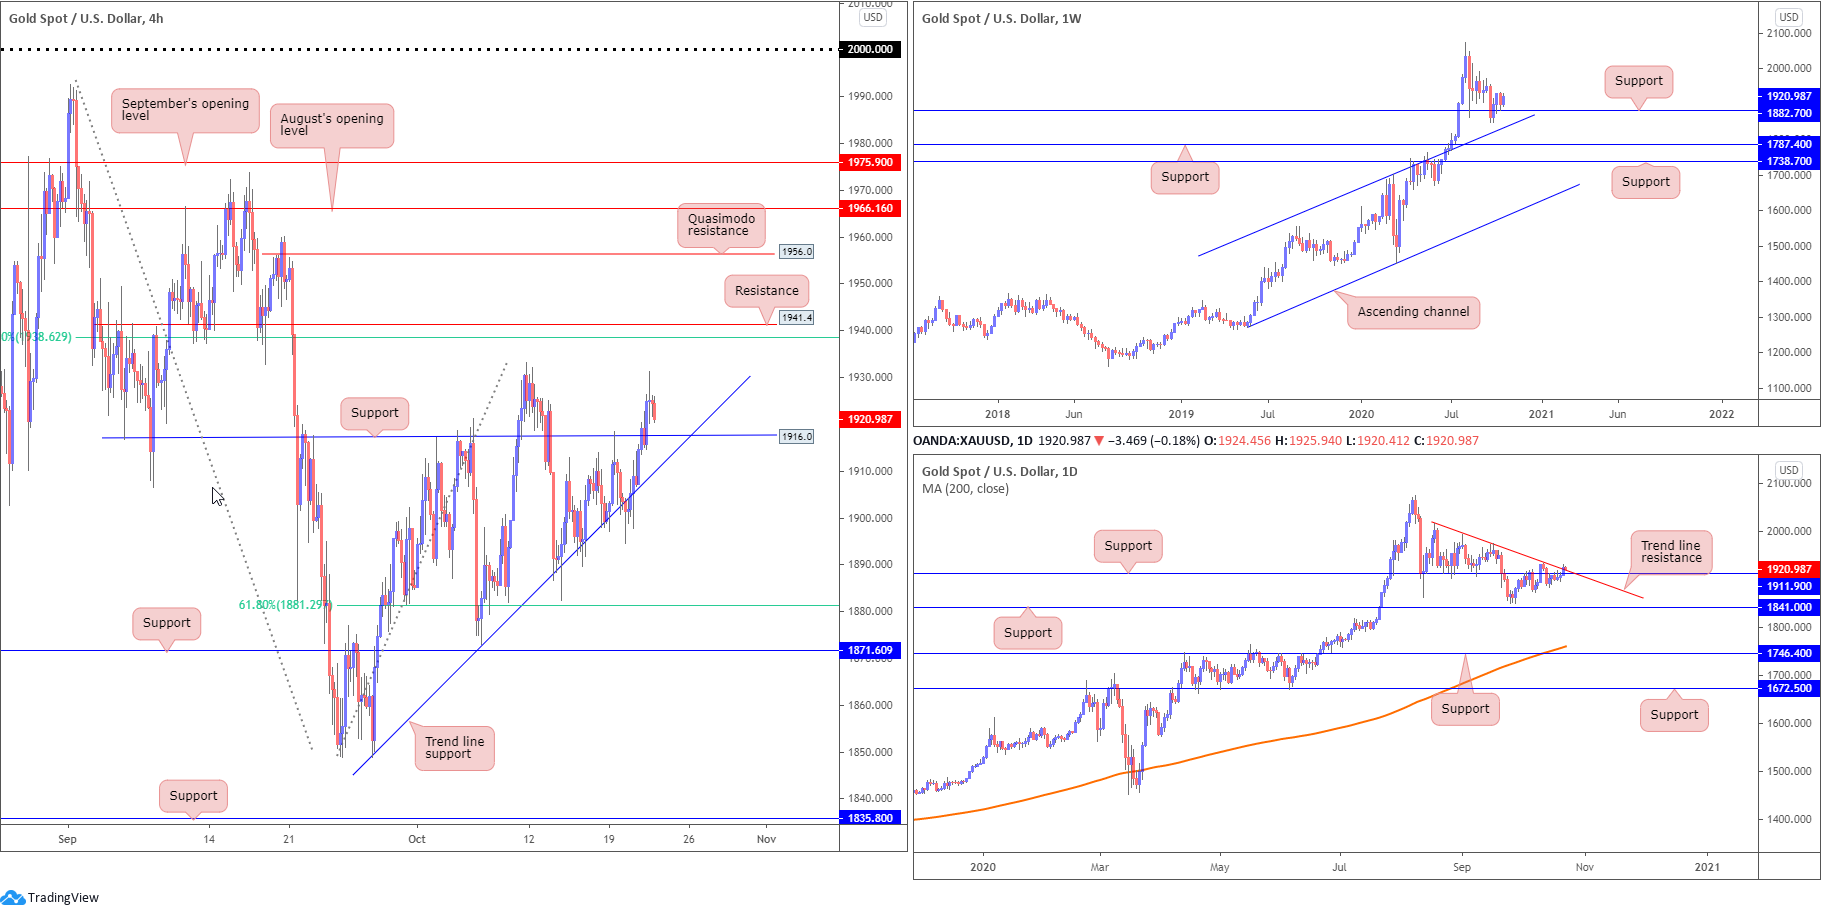
Kicking this morning’s analysis off from the top, weekly price continues to maintain a presence north of support at $1,882. Loitering nearby, channel resistance-turned support, taken from the high $1,703, is also visible. While the trend (higher since 2016) favours a bullish scenario here, the lack of buying interest seen from mid-August implies a dip to the aforementioned channel support. Traders are also urged to pencil in supports at $1,787 and $1,738 in the event buyers fail to make an appearance.
The daily timeframe recently overthrew resistance at $1,911, and is, at the time of writing, attempting to topple trend line resistance, taken from the high $2,015. The above could imply further upside is on the table and help confirm bullish intent off noted weekly support.
The story on the H4 timeframe reveals trendline support, taken from the low $1,848, has, despite a number of downside attempts, held firm. Wednesday finished above resistance at $1,916, though marginally off session peaks, consequently poised to potentially retest $1,916 today in the form of support. Directly overhead, we see the $1,933 October 11 peak, followed by H4 resistance at $1,941 and a 61.8% Fibonacci retracement ratio at $1,938.
Areas of consideration:
- With the trend on gold higher since 2016, and weekly buyers holding support at $1,882, a $1,916 H4 retest may be sufficient to stir a bullish response, targeting the noted H4 resistances (bold).
The accuracy, completeness and timeliness of the information contained on this site cannot be guaranteed. IC Markets does not warranty, guarantee or make any representations, or assume any liability regarding financial results based on the use of the information in the site.
News, views, opinions, recommendations and other information obtained from sources outside of www.icmarkets.com.au, used in this site are believed to be reliable, but we cannot guarantee their accuracy or completeness. All such information is subject to change at any time without notice. IC Markets assumes no responsibility for the content of any linked site.
The fact that such links may exist does not indicate approval or endorsement of any material contained on any linked site. IC Markets is not liable for any harm caused by the transmission, through accessing the services or information on this site, of a computer virus, or other computer code or programming device that might be used to access, delete, damage, disable, disrupt or otherwise impede in any manner, the operation of the site or of any user’s software, hardware, data or property


