
EUR/USD:
The US Federal Reserve, as expected, kept interest rates unchanged at 2.25-2.50% Wednesday. The trajectory of rate hikes was also narrowed, with the central bank stating it will not hike interest rates this year amid a slowing economy. The US Treasury 10-year yield dropped to a 14-month low following the release, as well as the US dollar index exploring ground sub 96.00.
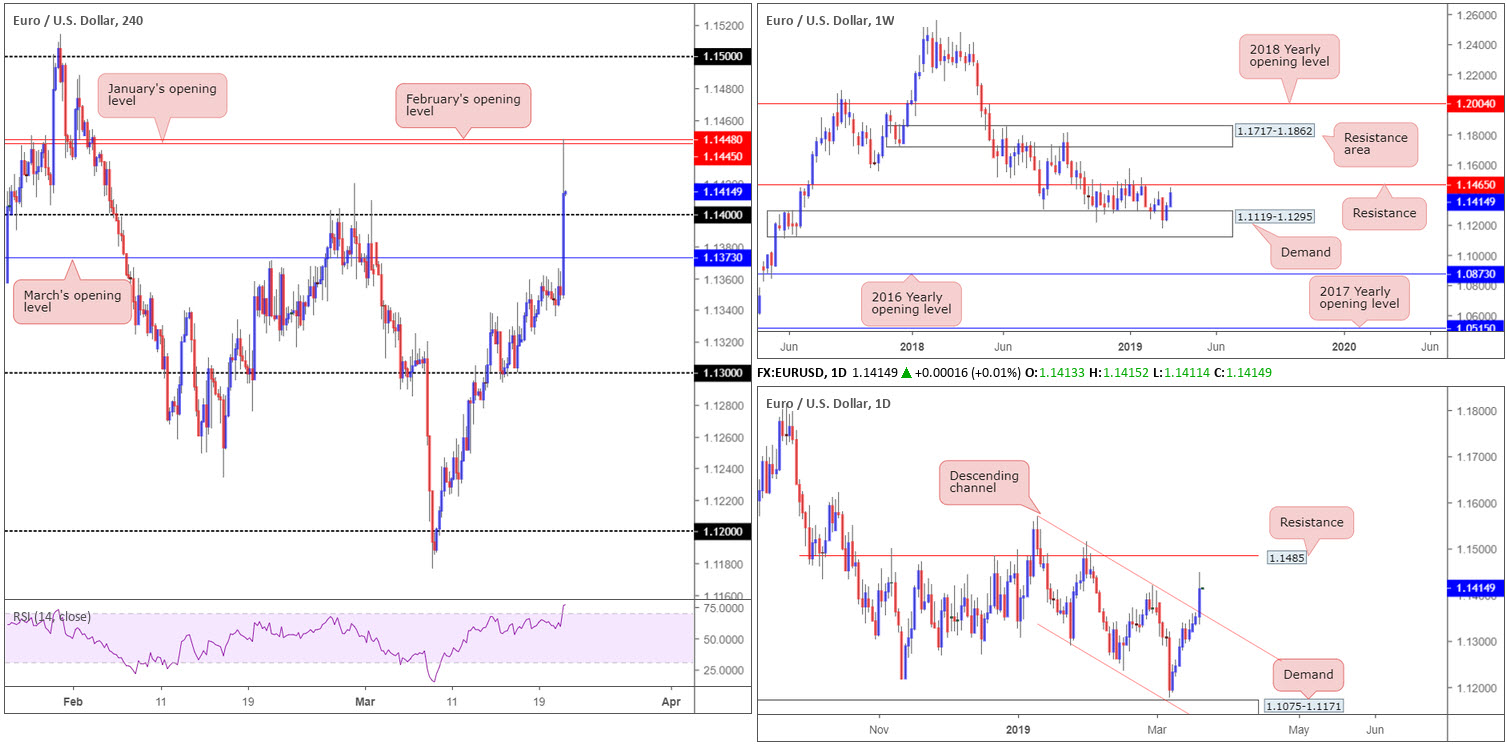
EUR/USD movement, in response to the Fed, overthrew March’s opening level on the H4 timeframe at 1.1373, followed by 1.14 and consequently brought January/February’s opening levels at 1.1445/48 into the mix, which, as you can see, was defended into the close.
Higher-timeframe flows show daily action swallowed channel resistance (extended from the high 1.1569) yesterday, potentially setting the stage for a run towards hefty resistance plotted at 1.1485. By the same token, weekly price is now poised to approach resistance coming in at 1.1465, following last week’s stronger-than-expected response out of demand at 1.1119-1.1295.
Areas of consideration:
Between the 1.15 handle on the H4 timeframe and weekly resistance at 1.1465 (daily resistance is housed within this range at 1.1485) is an area active sellers may inhabit. Should 1.15/1.1465 enter the fray sometime today, a short on the back of a H4 bearish candlestick signal is an option (entry/risk levels can be determined according to the candlestick’s structure), targeting 1.14 as an initial port of call.
Having seen the market conclude Wednesday closing above 1.14, a retest play at this number is also a consideration today. Upside targets from here fall in around January/February’s opening levels at 1.1445/48, shadowed by the weekly resistance at 1.1465.
Today’s data points: EU Economic Summit; Philly Fed Manufacturing Index.
GBP/USD:
Sterling continued to be whipped around on Brexit headlines Wednesday ahead of the EU summit today.
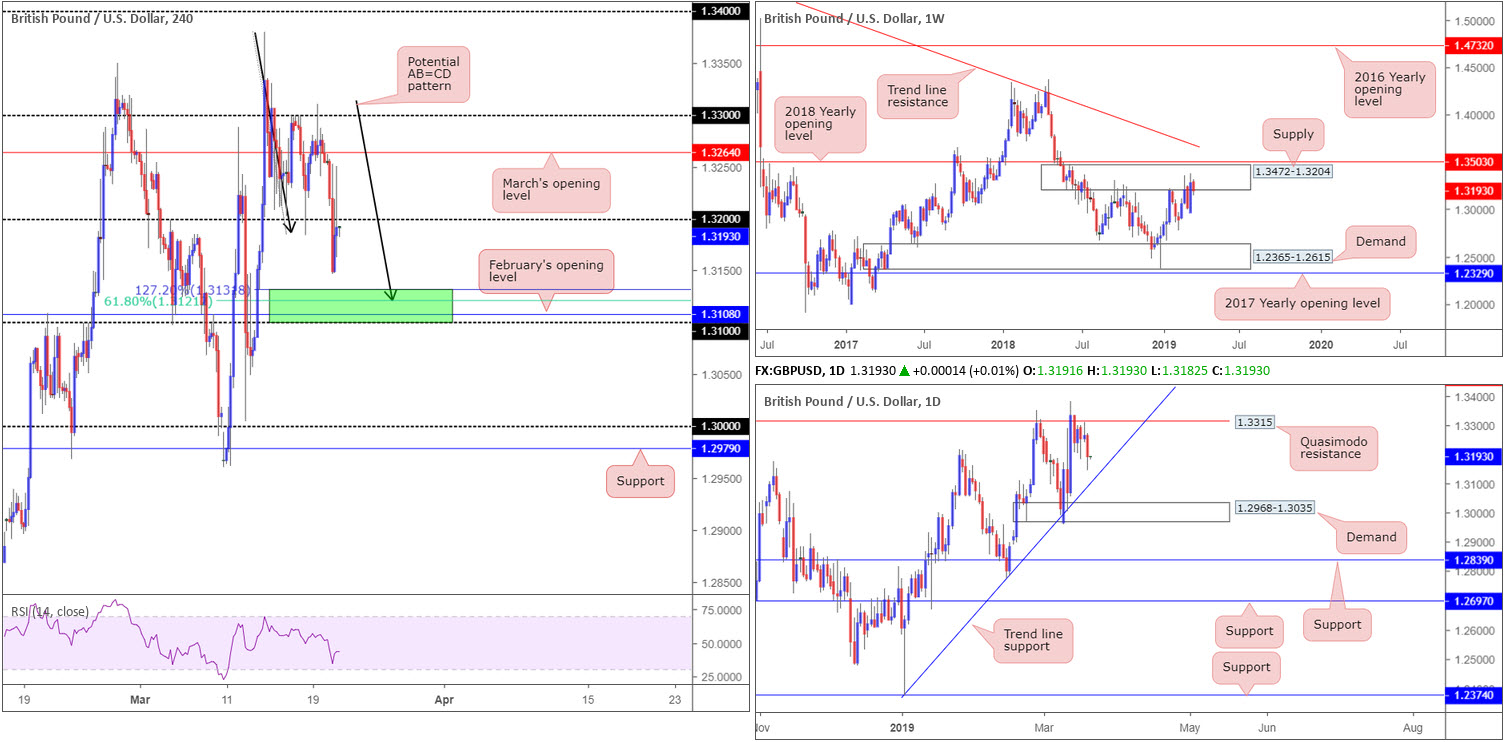
The British pound erased more than half a per cent vs. its US counterpart, reclaiming 1.32 (H4) to the downside in the process. Seeing 1.32 hold as resistance into the close, the unit could be gearing up for a test of a rather interesting base of H4 support (green) at 1.31/1.3133 (comprised of a 127.2% H4 AB=CD [black arrows] pattern at 1.3133, a 61.8% H4 Fibonacci support at 1.3121 and a round number at 1.31). It might also interest traders to note a daily trend line support (extended from the low 1.2373) merges close by the said H4 area.
Decorating the weekly timeframe, however, is a supply zone at 1.3472-1.3204. Although the area has been tested on a number of occasions since July 2018 (which could lead to the market eventually overthrowing the area for 1.3503), it would be rash to overlook the zone.
Areas of consideration:
Despite weekly price possibly eyeing lower levels, a bounce (at the very least) is expected to develop from the green H4 zone at 1.31/1.3133. For traders concerned weekly opposition may be too much to handle, despite having a nearby daily trend line supporting the zone, waiting for additional confirmation to form before pulling the trigger is an option (traders can base entry/risk parameters on their chosen confirmation technique).
In terms of take-profit targets, bearing in mind the approach to 1.31/1.3133 has yet to complete, the research team notes 1.32 as a logical resistance.
Today’s data points: UK Retail Sales m/m; UK Public Sector Net Borrowing; MPC Official Bank Rate Votes; BoE Monetary Policy Summary; BoE Official Bank Rate Decision; UK Asset Purchase Facility; MPC Asset Purchase Facility Votes; Philly Fed Manufacturing Index.
AUD/USD:
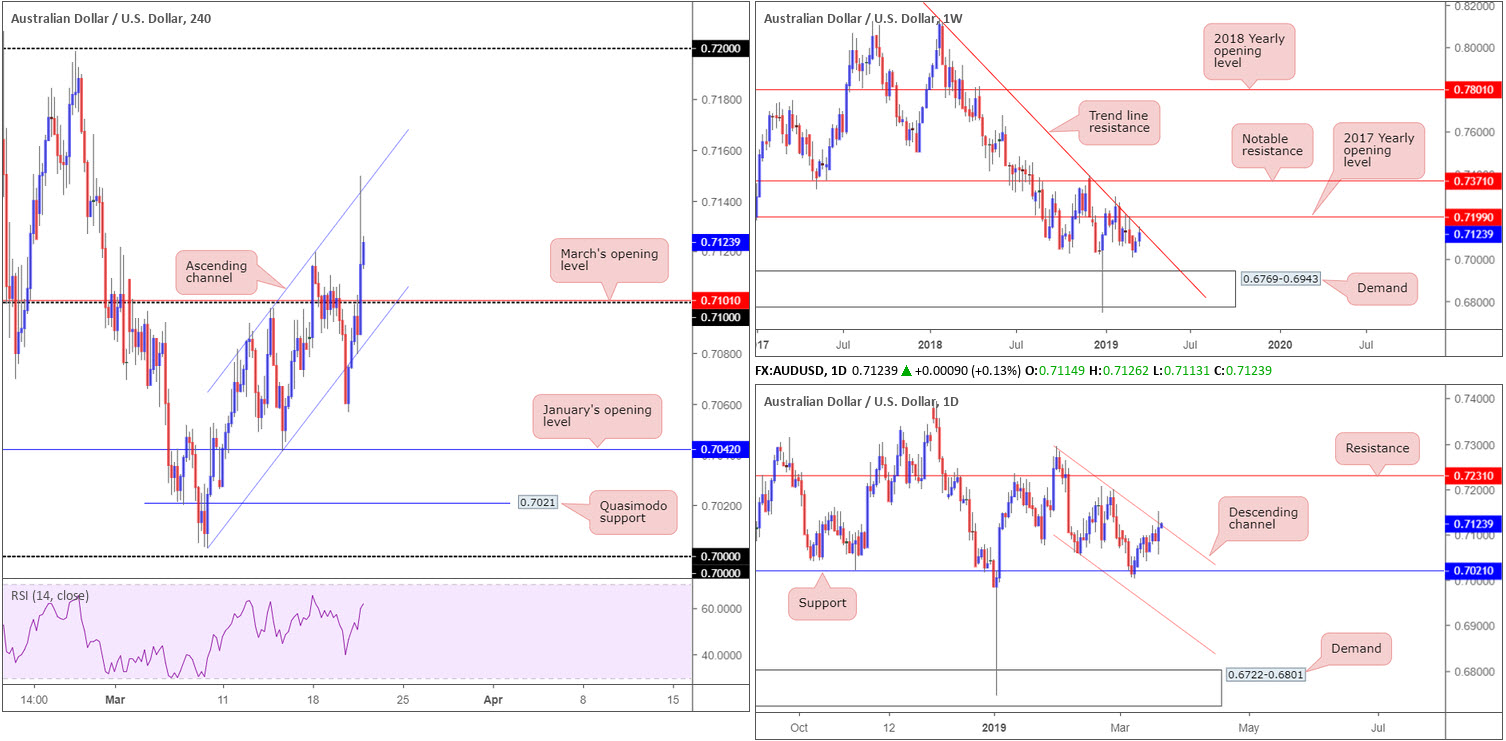
AUD/USD bulls entered an offensive phase following Wednesday’s dovish Fed, subsequently stimulating a H4 break beyond 0.71 (and March’s opening level at 0.7101). Despite concluding trade up 0.39%, H4 price action ran into headwinds from channel resistance (taken from the high 0.7081), which may eventually call for a retest at 0.71 (and merging channel support [from the low 0.7003]). Interestingly, the current H4 channel resistance fuses closely with channel resistance on the daily timeframe (extended from the high 0.7295), as well as weekly trend line resistance (etched from the high 0.8135).
Areas of consideration:
Ultimately, the research team notes strong resistance present on the H4, daily and weekly timeframes. As such, a retest play off 0.71 today is difficult.
To prove seller intent, traders may elect to wait and see if the H4 candles can defeat 0.71 to the downside, opening up a possible run in the direction of yesterday’s low 0.7056, followed by January’s opening level at 0.7042. A retest of 0.71 as resistance, following a break lower, is considered a strong sell signal given the overall technical picture (entry and stop-loss placement can be determined on the rejecting candle’s structure).
Today’s data points: AUD Employment Change; AUD Unemployment Rate; Philly Fed Manufacturing Index.
USD/JPY:
Following the US Federal Reserve’s dovish note Wednesday, along with the central bank keeping interest rates unchanged (as expected), the US dollar ceded considerable ground against its Japanese counterpart, down 0.63% on the day.
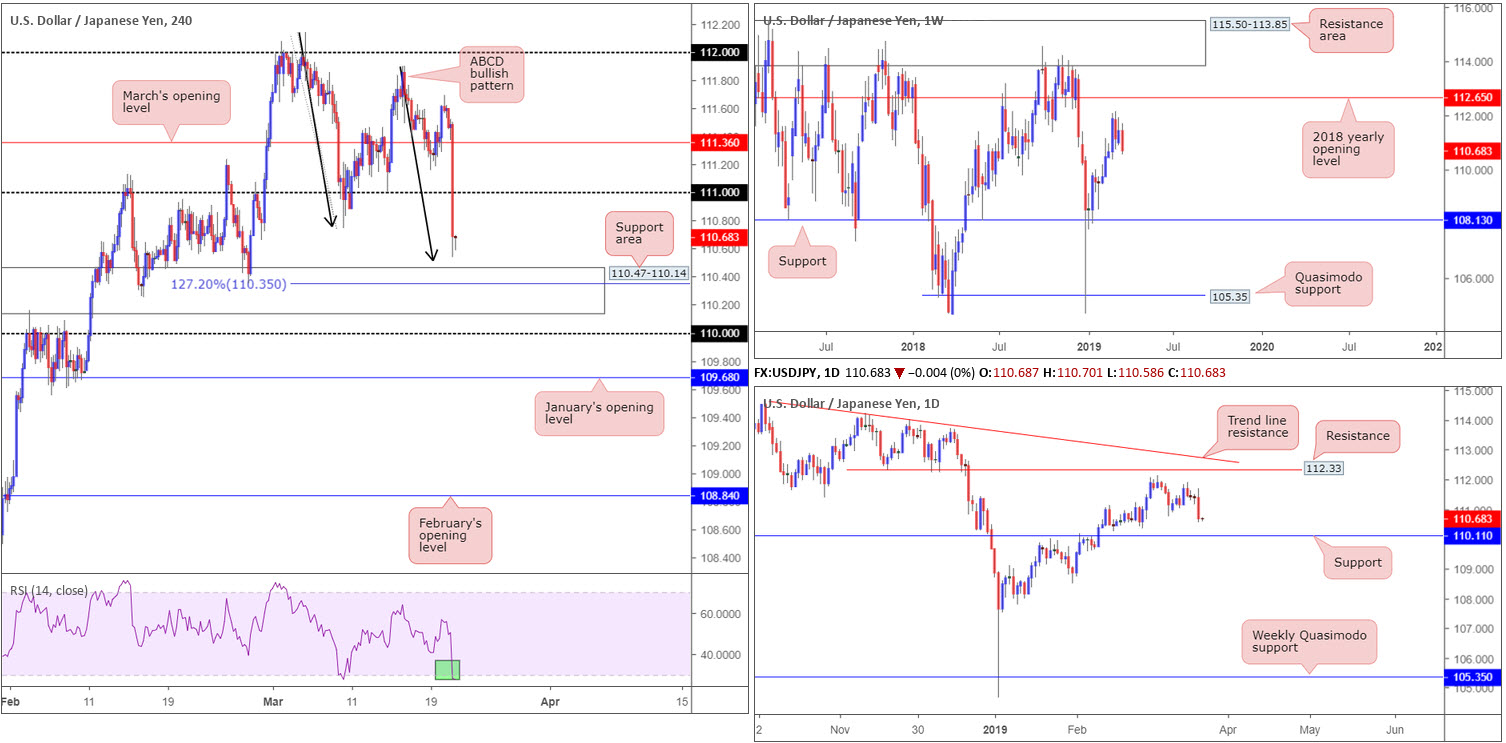
Swallowing March’s opening level at 111.36 on the H4 timeframe as well as the round number 111, the candles put in a mild bottom just north of a support area coming in at 110.47-110.14 and an ABCD bullish pattern (black arrows) around 110.51. Further adding to this, the RSI indicator is seen displaying an oversold reading (green).
A few points beneath the current H4 support area lies a daily support level at 110.10, therefore a fakeout below the H4 zone could come to fruition. Weekly flow, on the other hand, is currently lingering in no man’s land. A few weeks back the market witnessed the pair top within striking distance of the 2018 yearly opening level at 112.65. Since then we’ve seen upside momentum deteriorate.
Areas of consideration:
Traders have the option of entering long from the top edge of the H4 support area at 110.47-110.14, knowing the trade factors in an ABCD completion point (black arrows) which could, by the way, stretch to test its 127.2% Fibonacci extension point at 110.35.
Waiting for additional technical confirmation at 110.47-110.14, either on the H4 timeframe or lower down (entry and stop-loss placement can then be determined on the confirming structure’s rules of engagement), is also something to consider given the threat of a potential fakeout to daily support at 110.11, and an overall lack of support from the higher timeframes.
Today’s data points: Philly Fed Manufacturing Index; Japanese banks are closed in observance of Vernal Equinox Day.
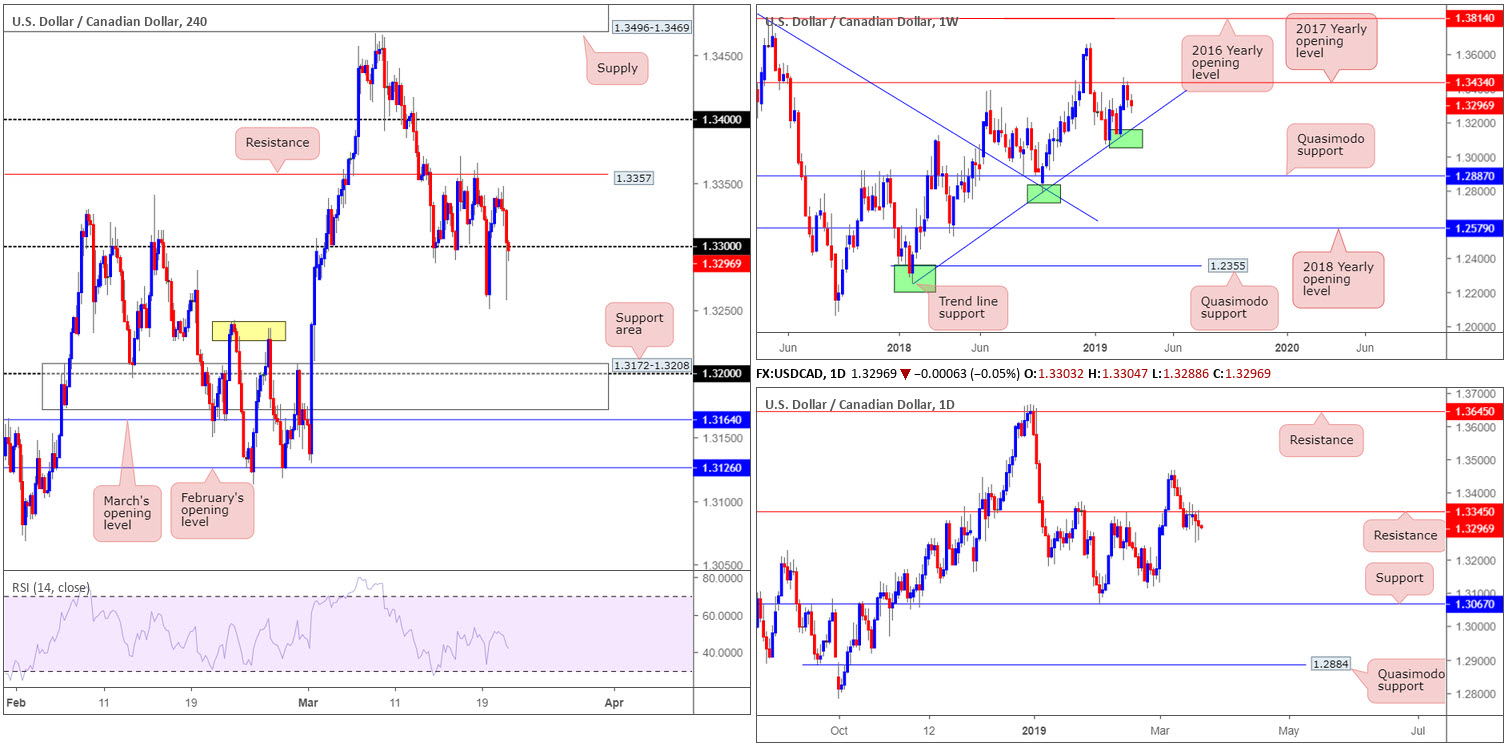
USD/CAD:
In recent sessions the USD/CAD staged a modest selloff, influenced by a dovish Fed message. 1.33 on the H4 timeframe is currently under attack, after yesterday’s push to lows at 1.3257 tripped a large portion of stop-loss orders from traders looking to fade the psychological mark. Assuming breakout selling is strong, additional downside may take shape today; ultimately targeting the support area at 1.3172-1.3208 (converges with round number 1.32). Why price action is unlikely to find support off the 1.3220 (yellow) zone is down to where we’re potentially heading on the weekly timeframe.
Fusing with the current H4 support area is a weekly trend line support (extended from the low 1.2421). Note on the daily timeframe, however, price has room to push beyond 1.32, targeting the 1.3112 Feb 25 low.
Areas of consideration:
On account of the above reading, two possible scenarios could take shape today/tomorrow:
- H4 price extends yesterday’s losses and prints a decisive close beneath 1.33. With this coming to fruition, a retest play to the underside of here as resistance is a consideration, with the current H4 support area at 1.3172-1.3208 in place as the take-profit target.
- A long from the H4 support area at 1.3172-1.3208 is high probability, according to its association with weekly structure: trend line support. An entry from 1.32 is an idea with a stop-loss order placed beneath the area’s limit: 1.3172.
Today’s data points: Philly Fed Manufacturing Index.
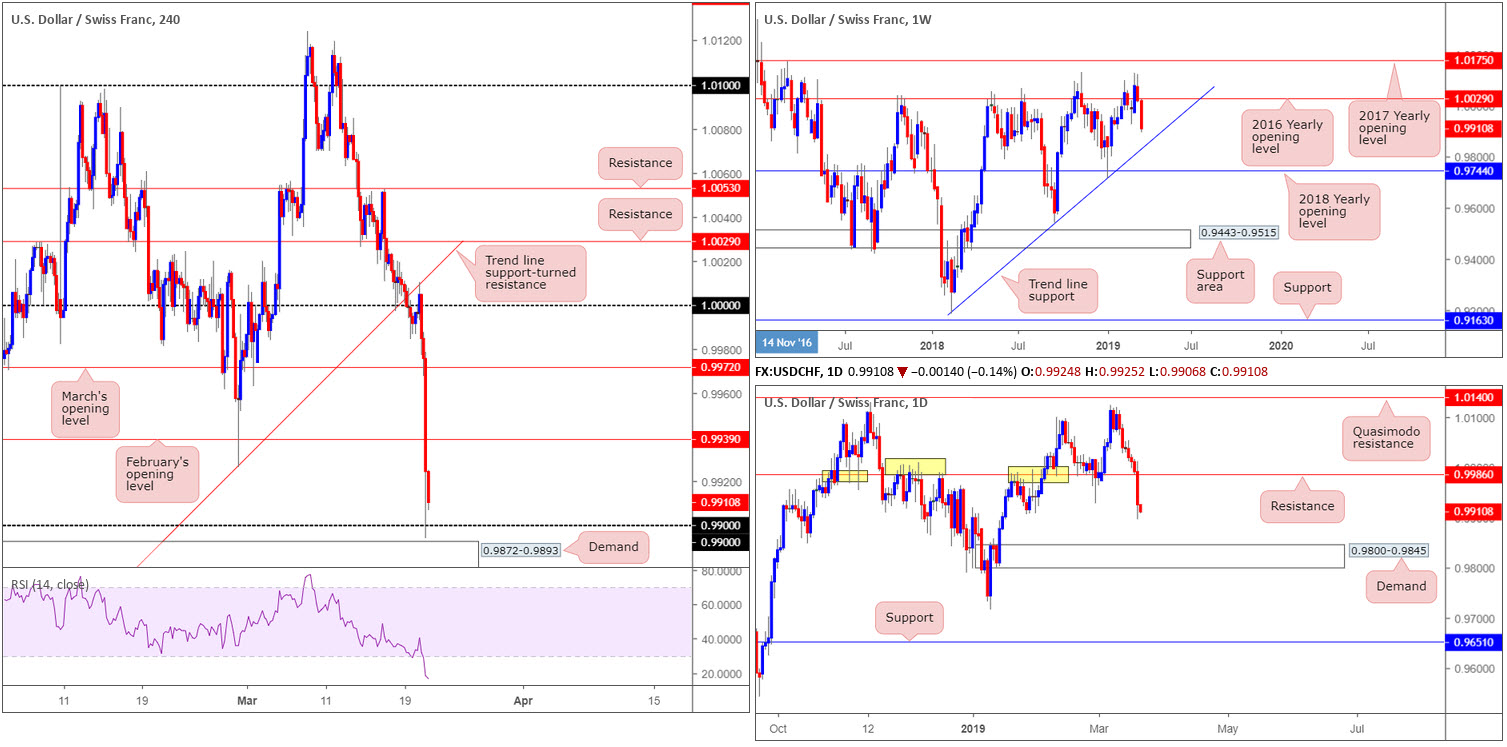
USD/CHF:
Focus shifted to the Federal Reserve Wednesday, with the central bank keeping interest rates unchanged, as anticipated. This, alongside its dovish message, sent the US dollar (along with US Treasury yields) southbound, consequently weighing on the USD/CHF.
Down 0.67% on the day, a number of key technical supports were taken out on the H4 timeframe following a retest to the underside of a trend line support-turned resistance (taken from the low 0.9716) and 1.0000 (parity). The move ultimately exposed 0.99 and, although missing the top edge of nearby demand at 0.9872-0.9893, was defended into the closing bell. Traders may also wish to acknowledge the RSI technical indicator is seen invading oversold territory.
Things on the weekly timeframe are relatively straightforward. Last week’s weekly candle concluded marginally beneath the 2016 yearly opening level at 1.0029 and gave rise to a possible downturn this week, and turn we have. Weekly flow now eyes trend line support (pencilled in from the low 0.9187) as its next downside target. A closer reading on the higher timeframes reveals yesterday’s action toppled notable daily support priced in at 0.9986 (now acting resistance) and perhaps cleared the runway to daily demand coming in at 0.9800-0.9845.
Areas of consideration:
H4 demand mentioned above at 0.9872-0.9893, the round number 0.99 and the RSI suggesting an oversold environment could lead to an attempted recovery today. Despite local confluence, weekly and daily timeframes both portend a move beyond the noted H4 structures to 0.9845: the top edge of daily demand which happens to merge with the current weekly trend line support. This demand, therefore, is a valid zone worthy of the watch list for a potential long in the near future.
Intraday sellers may attempt to sell the breakout below the aforementioned H4 demand, targeting 0.9845. This offers less than 30 pips to play with so traders are urged to consider risk/reward implications before pulling the trigger.
Today’s data points: Philly Fed Manufacturing Index; SNB Monetary Policy Assessment; CHF Libor Rate; SNB Press Conference.
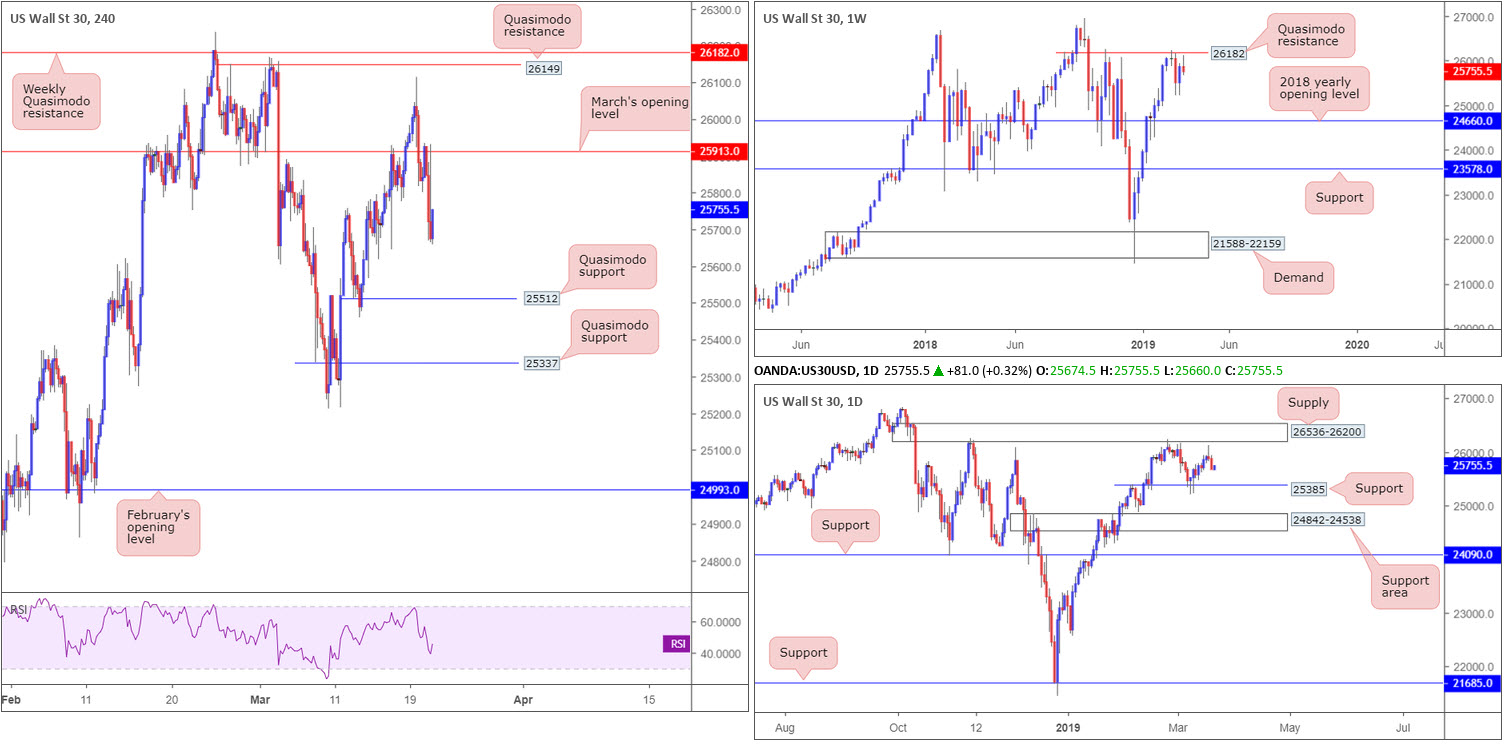
Dow Jones Industrial Average:
The Dow Jones Industrial Average closed lower Wednesday following the Federal Reserve’s latest monetary-policy announcement. The Fed forecast no rate hikes in 2019, down from two hikes forecasted previous.
Technically speaking, the weekly timeframe has price action selling off just south of Quasimodo resistance at 26182. Aside from the 25213 March 4 low, limited support is visible on this scale until the 2018 yearly opening level at 24660 enters the mix. Support on the daily timeframe is seen at 25385 after the unit topped (in the shape of a bearish pin-bar formation) ahead of supply at 26536-26200.
March’s opening level on the H4 timeframe at 25913 served as strong resistance yesterday, forcing price action to lows at 25665. Downside support from current price has a minor Quasimodo formation at 25512 to target, followed by another more pronounced Quasimodo support at 25337 (aligns closely with daily support mentioned above at 25385).
Areas of consideration:
With room seen for the market to extend losses, a retest play at the underside of March’s opening level drawn from 25913 is certainly worth considering. Another area of interest is the H4 Quasimodo support at 25337, given its connection with daily support at 25385.
Conservative traders will likely seek additional confirmation at both of the above said levels before executing a trade. Employing the use of candlestick analysis is one option. An alternative to this is to drill down to the lower timeframes and trade local structure.
Today’s data points: Philly Fed Manufacturing Index.
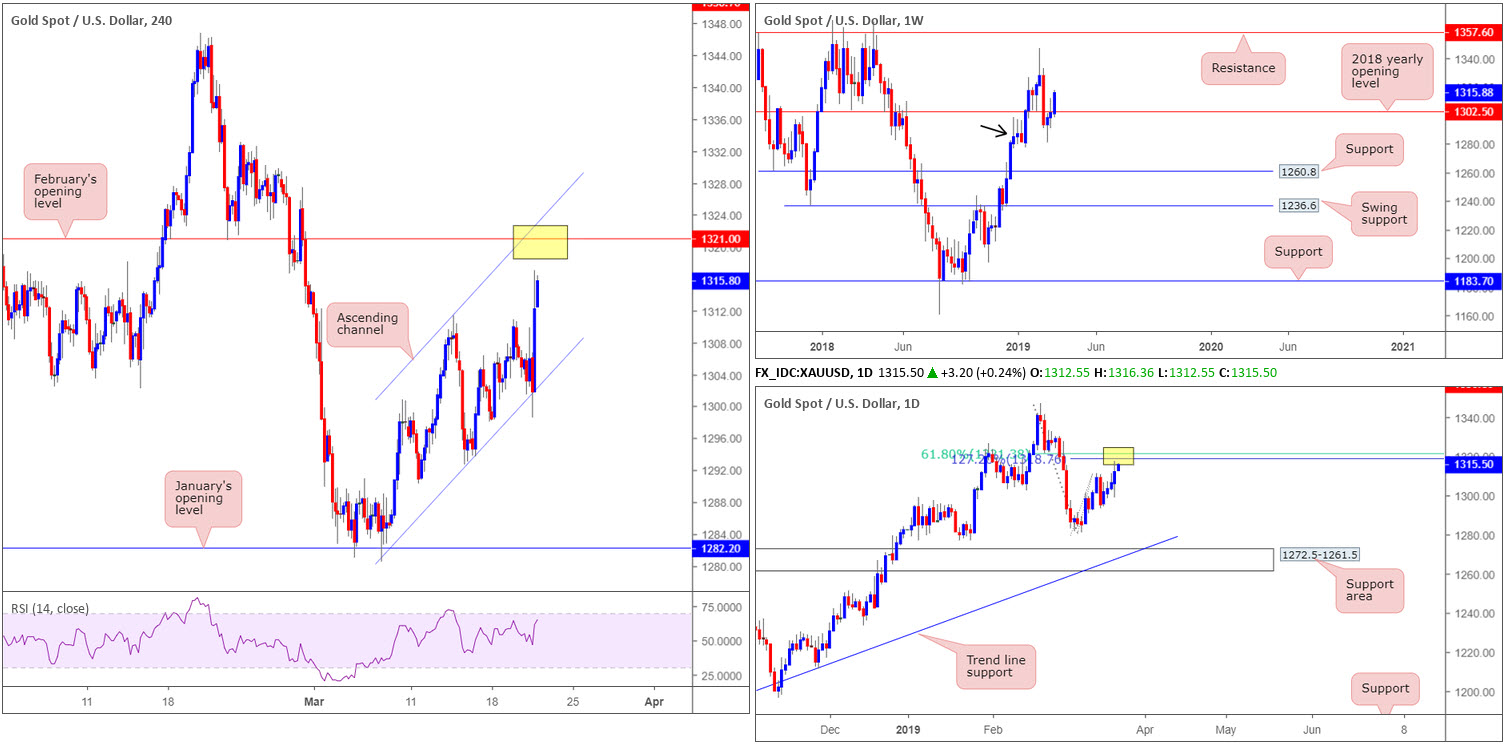
XAU/USD (GOLD):
Underpinned by a waning greenback and US Treasury yields via a dovish Fed, Wednesday observed bullion catapult itself northbound wrapping up the day printing a fourth consecutive gain.
Thanks to yesterday’s movement, weekly flow is seen establishing ground above its 2018 yearly opening level at 1302.5. Continued buying from this angle has the 1346.7 Feb 18 high in sight, tailed closely by resistance at 1357.6. Buyers on the weekly timeframe may want to note potential resistance on the daily timeframe between 1321.3/1318.7: a 61.8% Fibonacci resistance and 127.2% Fibonacci ext. point.
Merging closely with the aforesaid Fibonacci values is February’s opening level at 1321.0 on the H4 timeframe and a nearby channel resistance (taken from the high 1311.3). It also worth pointing out the RSI indicator is seen nearing its overbought value.
Areas of consideration:
A response from 1321.0 on the H4 timeframe is expected, seeing it unites closely with daily Fibonacci resistances. A short from here with a stop-loss order plotted above the current H4 channel resistance is, therefore, worthy of attention. Waiting for additional confirmation to come about before pulling the trigger is recommended, however, since a sell from here has opposition from weekly flow.
The accuracy, completeness and timeliness of the information contained on this site cannot be guaranteed. IC Markets does not warranty, guarantee or make any representations, or assume any liability with regard to financial results based on the use of the information in the site.
News, views, opinions, recommendations and other information obtained from sources outside of www.icmarkets.com.au, used in this site are believed to be reliable, but we cannot guarantee their accuracy or completeness. All such information is subject to change at any time without notice. IC Markets assumes no responsibility for the content of any linked site. The fact that such links may exist does not indicate approval or endorsement of any material contained on any linked site.
IC Markets is not liable for any harm caused by the transmission, through accessing the services or information on this site, of a computer virus, or other computer code or programming device that might be used to access, delete, damage, disable, disrupt or otherwise impede in any manner, the operation of the site or of any user’s software, hardware, data or property.


