
Key risk events today:
Canada ADP Non-Farm Employment Change; Philly Fed Manufacturing Index; US Unemployment Claims; US CB Leading Index m/m.
(Previous analysis as well as outside sources – italics).
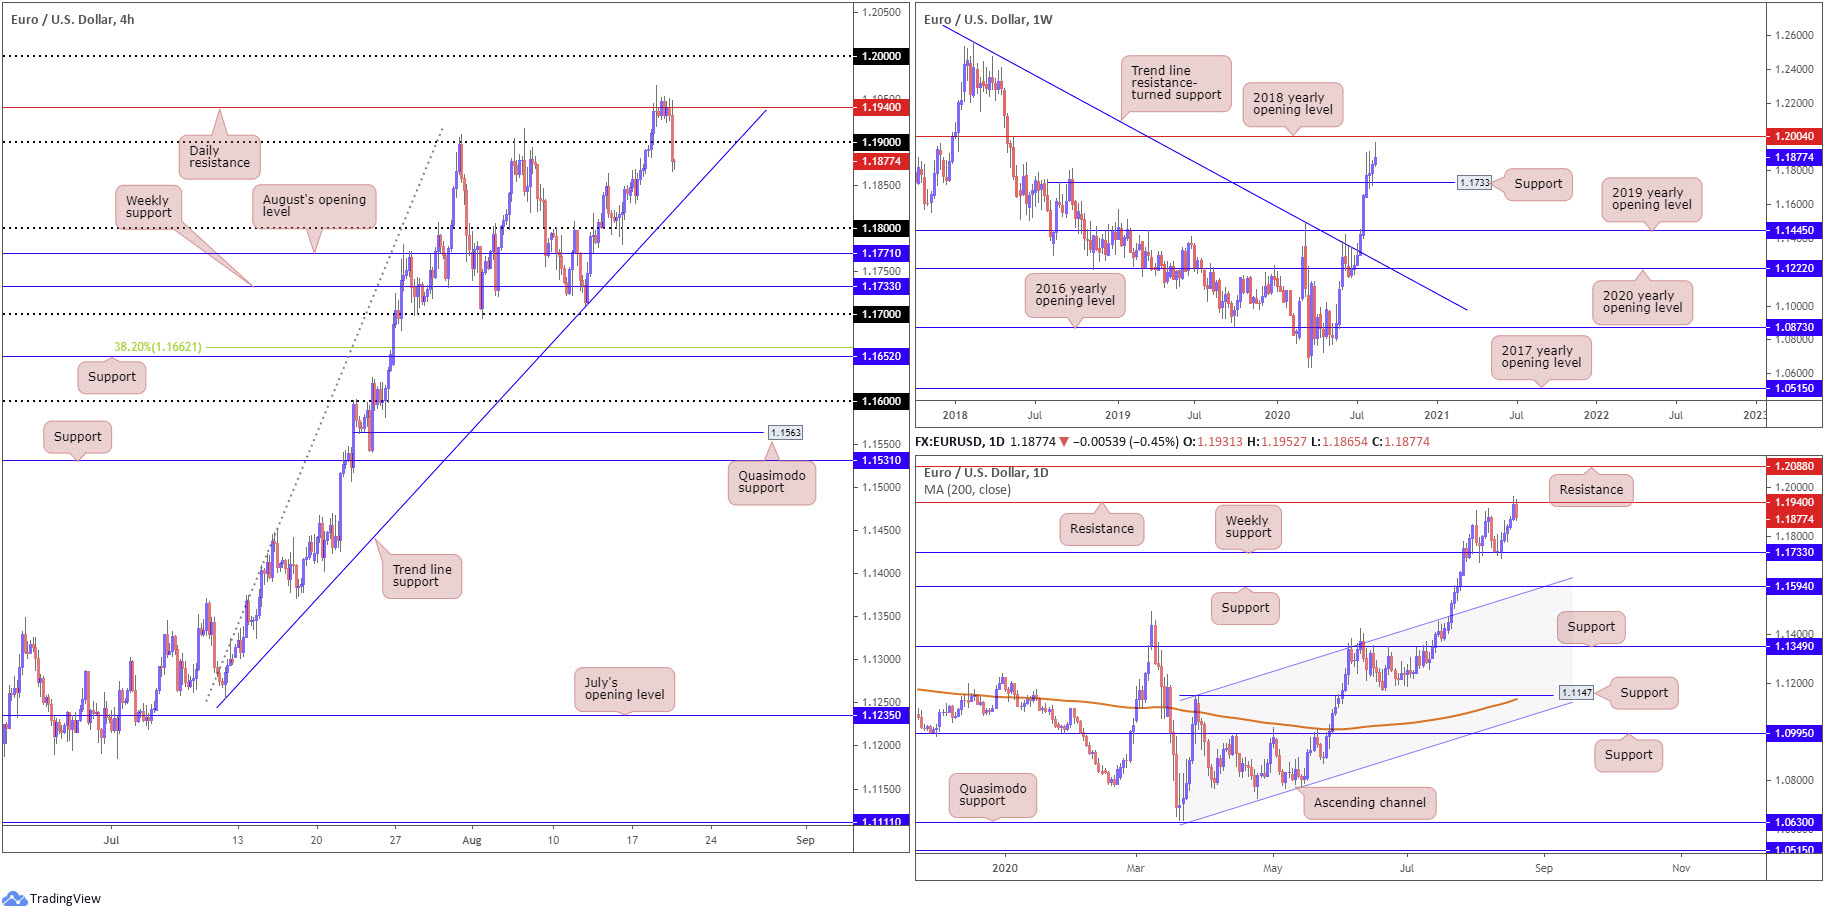
EUR/USD:
The euro staged a sharp U-turn Wednesday as the DXY reclaimed fresh territory above 92.50, and US Treasury yields traded considerably off worst levels.
Technically, following Tuesday’s fresh peak at 1.1965, a move that registered a sixth consecutive daily gain, EUR/USD twisted lower from daily resistance at 1.1940 Wednesday and dipped a toe in waters south of 1.19 (H4). Trend line support, extended from the low 1.1254, sits as the next downside target on the H4 timeframe, followed by the 1.18 handle. Beyond these levels, traders may also acknowledge August’s opening level at 1.1771.
Price action on the higher timeframes show weekly price trading off best levels, on track to produce a shooting star pattern (bearish). Weekly resistance is seen by way of the 2018 yearly opening level at 1.2004, followed by daily resistance positioned at 1.2088 (above 1.1940). In terms of support, we can see the 1.1733 weekly level may re-enter the mix, a prior Quasimodo resistance level.
Areas of consideration:
The decisive rejection from daily resistance at 1.1940, a move that swarmed 1.19 on the H4, unlocks the possibility of bearish countertrend scenarios today, targeting at least H4 trend line support, taken from the low 1.1254. A retest at the underside of 1.19 may also be enough to lure conservative sellers into the fight.
Do bear in mind, though, the current trend faces northbound, therefore reducing risk to breakeven as soon as logically possible is likely an approach most prudent traders will adopt.
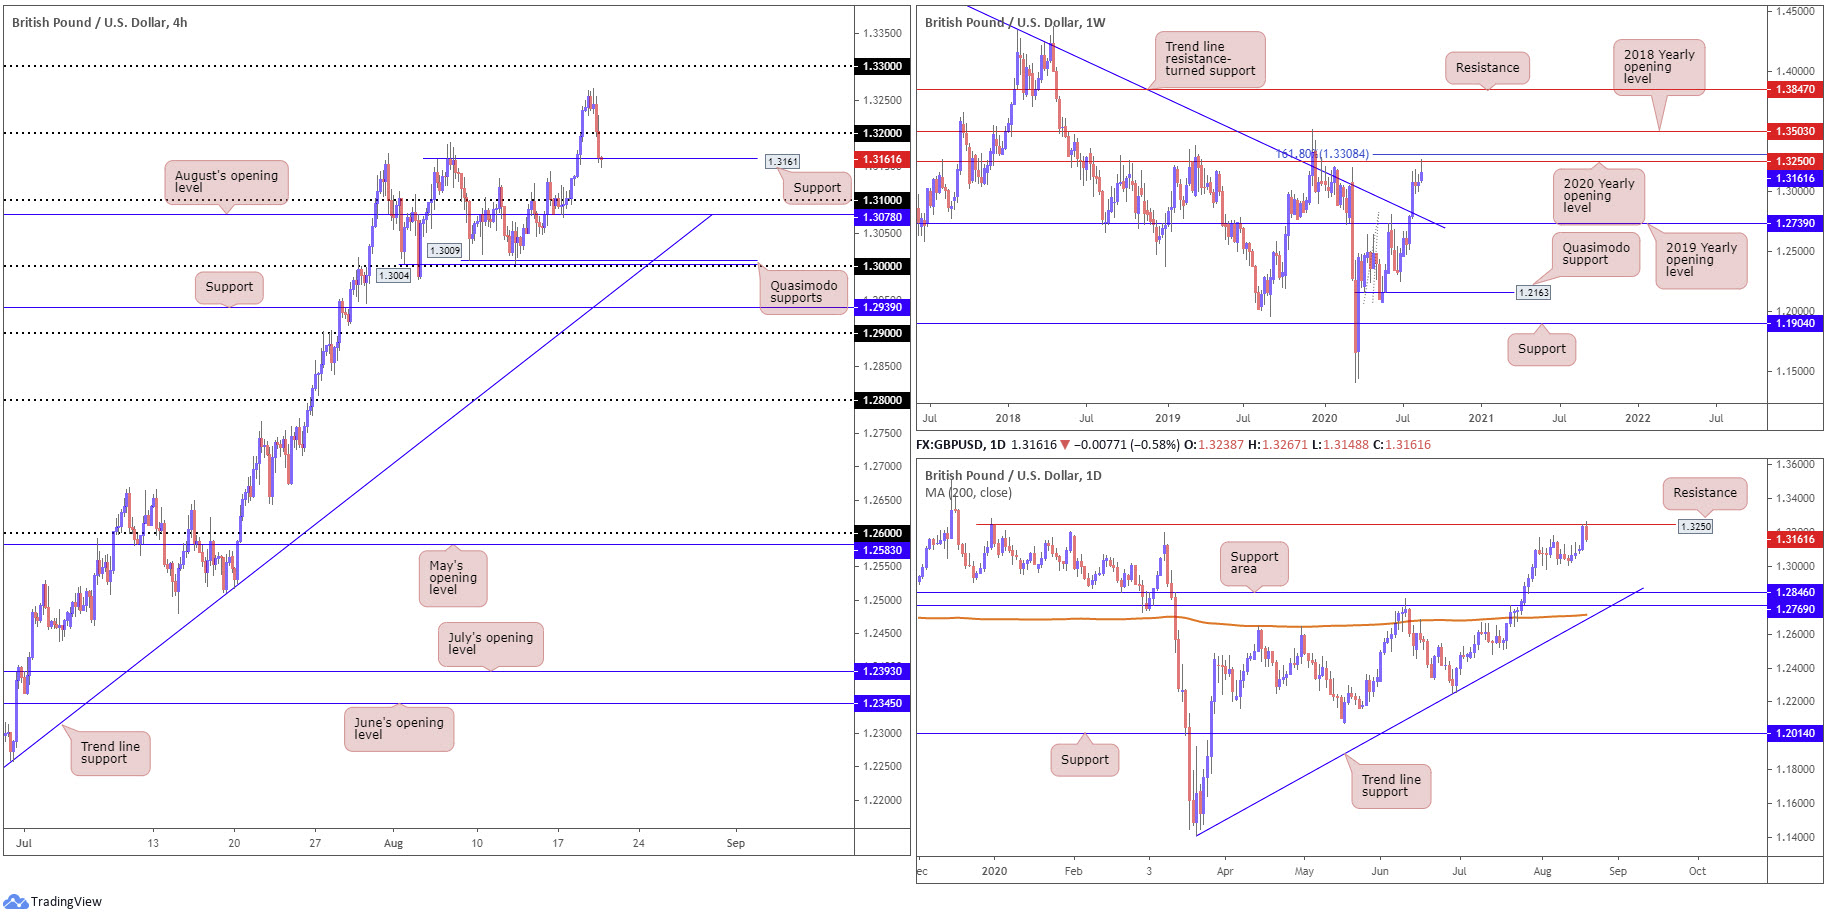
GBP/USD:
Leaving the 1.3284 December 31 high unchallenged, sterling gave up its post-CPI strength against a robust dollar Wednesday, sinking through 1.32 heading into early US hours and eventually shaking hands with H4 support coming in at 1.3161 (prior Quasimodo resistance). Elbowing through the latter today frees room for 1.31 support and August’s opening level at 1.3078.
From the weekly timeframe, the July 27 trend line resistance (1.5930) break has likely stirred long-term bullish themes. Fresh resistance seen by way of the 2020 yearly opening level at 1.3250 made an appearance yesterday, closely stalked by a 161.8% Fibonacci extension point at 1.3308.
Daily resistance at 1.3250 was also thrown into the mix yesterday, a barrier sharing the same space with resistance on the weekly timeframe, the 2020 yearly opening level. Persistent weakness from here shines the spotlight on a daily support area between 1.2769/1.2846.
Areas of consideration:
Price action off H4 support at 1.3161 is somewhat subdued, likely due to weekly resistance at 1.3250 (2020 yearly opening level) entering vision. In the absence of support on the daily timeframe, current H4 support echoes a vulnerable tone, perhaps underlining intraday bearish themes today towards the 1.31ish neighbourhood.
Further selling beyond 1.3078 on the H4 is also possible, targeting the key figure 1.30, a base surrounded by Quasimodo supports and a trend line support, taken from the low 1.2274.
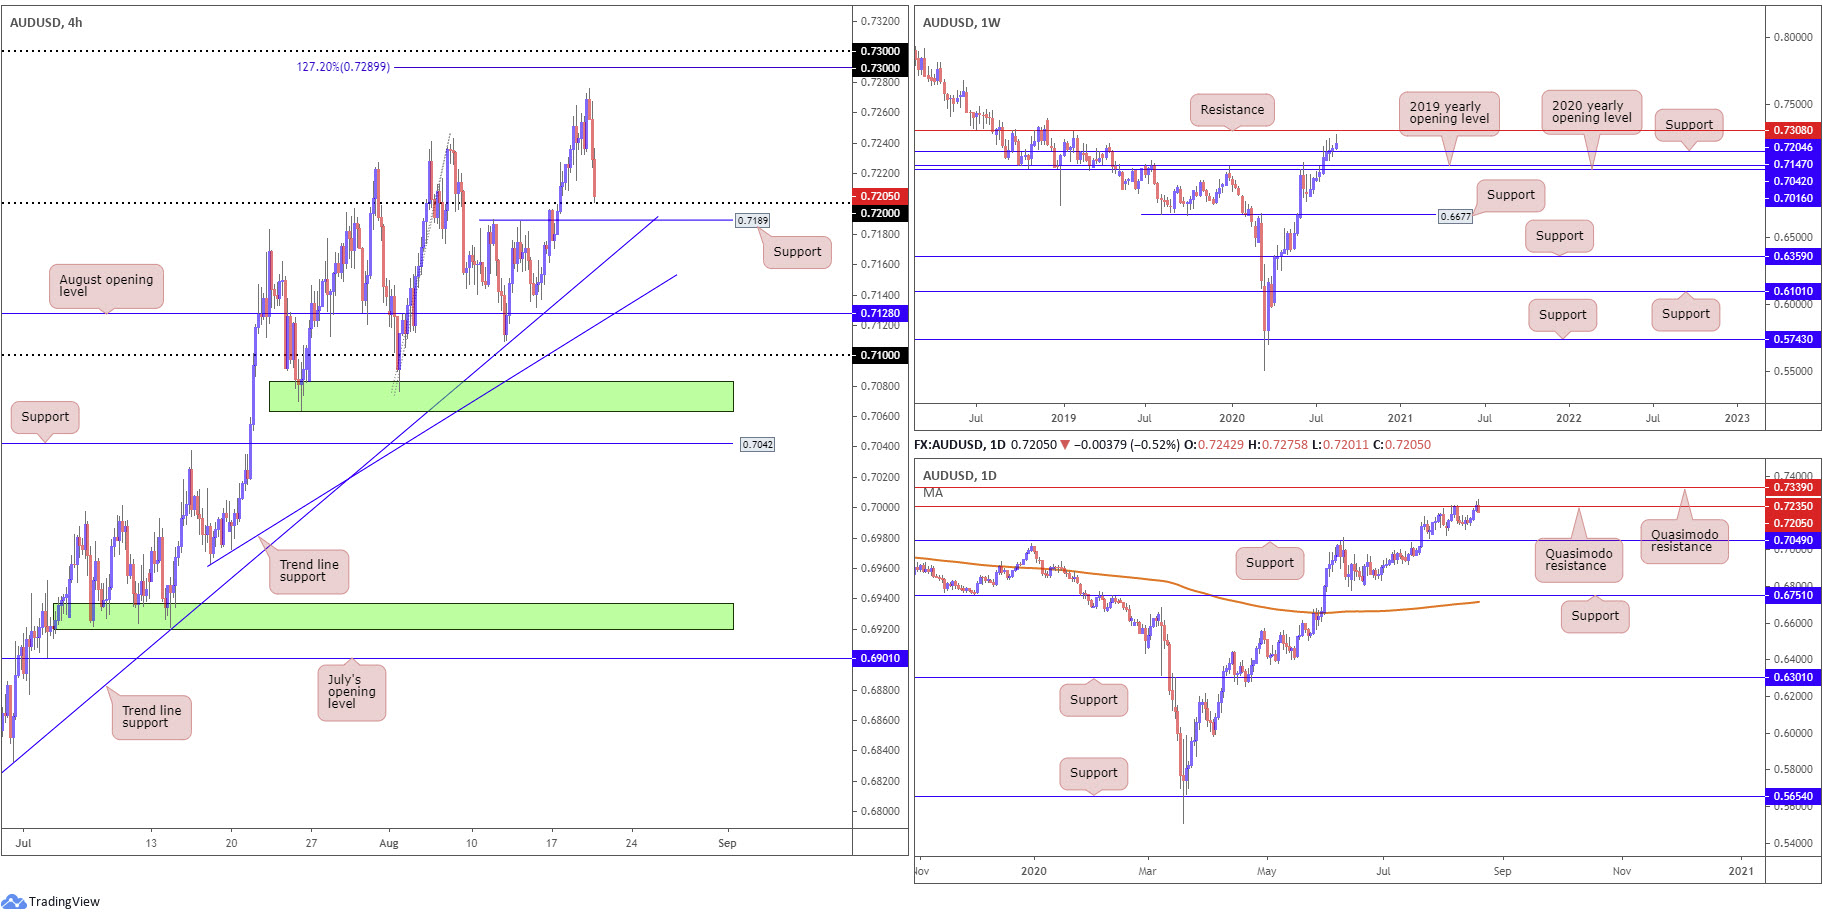
AUD/USD:
The US dollar index staging a stronger-than-expected recovery, and daily price engaging Quasimodo resistance at 0.7235, weighed on the Australian dollar Wednesday. This guided H4 candles back within a stone’s throw away from the 0.72 handle, sited just north of support at 0.7189 and a trend line support, taken from the low 0.6832. Readers will also acknowledge weekly support resting close by at 0.7147.
While the reaction from daily Quasimodo resistance displays scope to reach support at 0.7049 on the daily timeframe, 0.7147 support on the weekly timeframe is likely to halt downside.
Areas of consideration:
Overall, the trend in this market points northbound for the time being.
Intraday, a fakeout through the 0.72 round number into nearby H4 support at 0.7189 could occur today. A H4/H1 close back above 0.72 (off 0.7189), therefore, may revive buyers.
Longer term, it appears we may eventually cross swords with weekly support at 0.7147, a level that may attract a rebound to weekly resistance at 0.7308, followed by daily Quasimodo resistance at 0.7339.
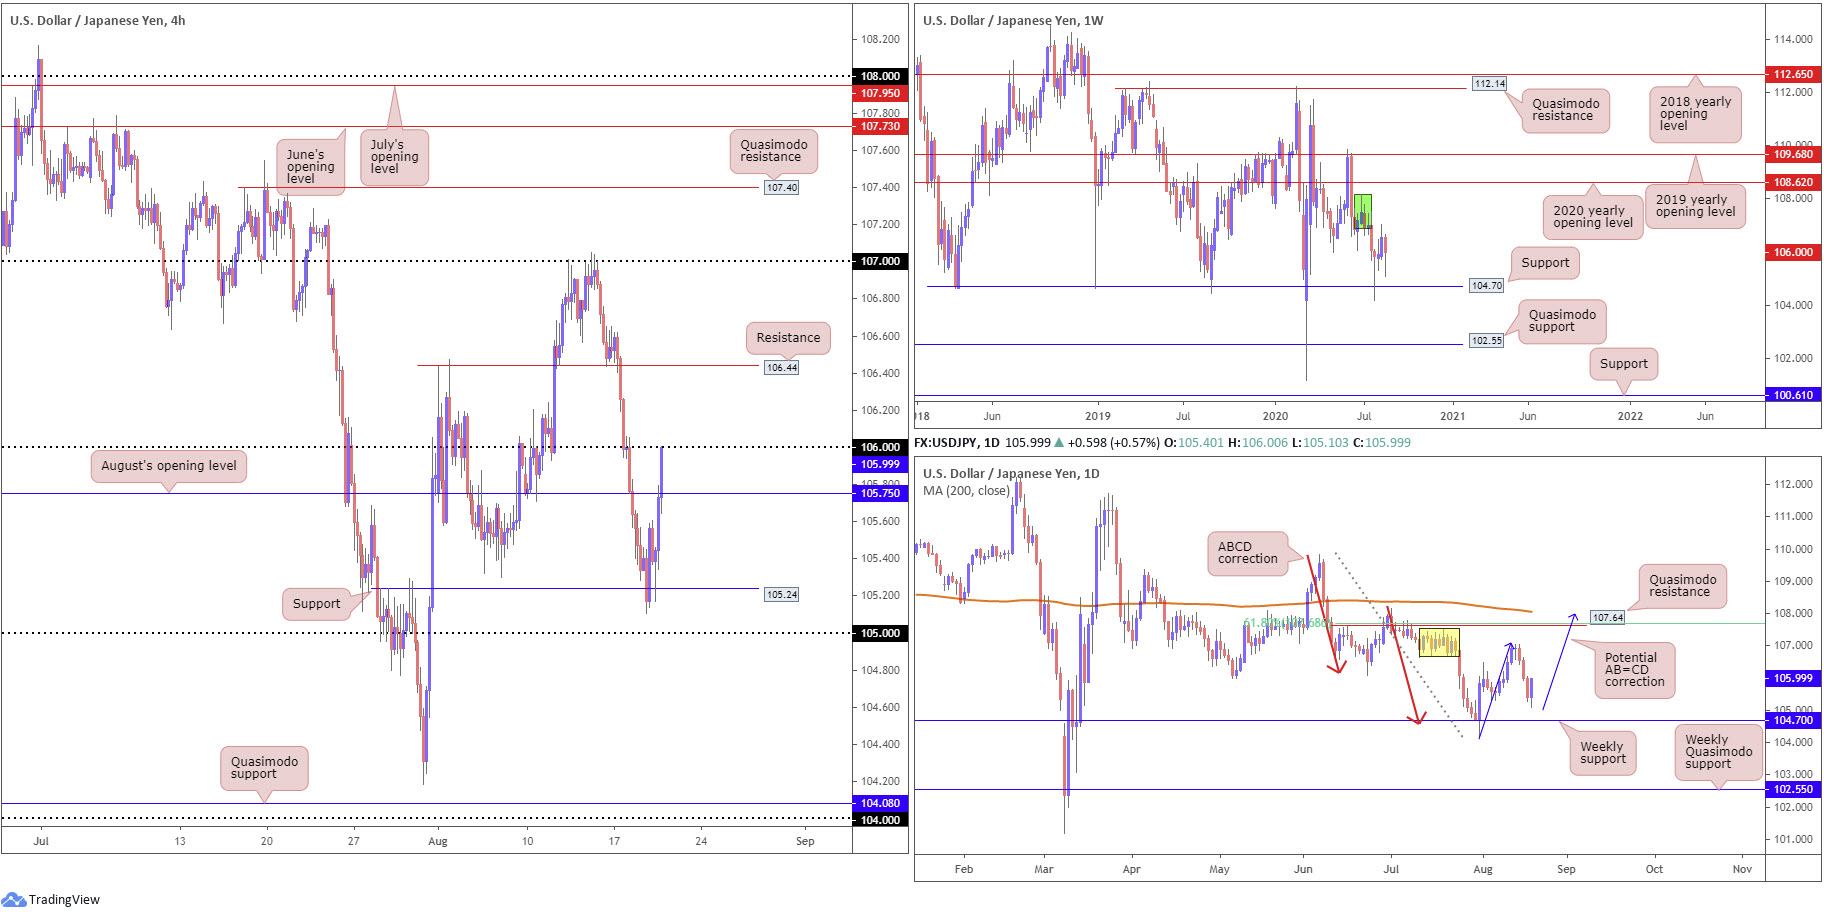
USD/JPY:
Recent declines drew H4 support at 105.24 into view, a prior Quasimodo resistance level. US Treasury yields recouping daily losses along with the DXY mounting a healthy recovery that absorbed offers around 92.50, witnessed USD/JPY enter an offensive phase Wednesday. Upside momentum devoured August’s opening level at 105.75 on the H4 timeframe and tested the 106 handle. Breaking the psychological level today seats resistance at 106.44 on the hit list, with a violation unmasking 107.
Further out, supply at 106.88-108.16 (green) has so far proven a tough nut to crack on the weekly timeframe. Neighbouring structures to keep a tab on fall in at support drawn from 104.70 and the 2020 yearly opening level at 108.62.
Yesterday’s rebound powerfully snapped a three-day bearish phase, kicking off the beginnings of a D-leg to a possible AB=CD bearish correction (blue arrows) at 108.00. Serving nearby the AB=CD structure, traders will find Quasimodo resistance positioned nearby at 107.64, along with the 61.8% Fibonacci retracement ratio at 107.68 and the 200-day SMA (orange – 108.06).
Areas of consideration:
While (technical) downside risk remains in this market until reaching weekly support at 104.70, the ducks are being lined up for a possible 106 breach today on the H4 timeframe, enough to perhaps stimulate intraday breakout strategies towards H4 resistance at 106.44. Conservative players are likely to seek a 106 retest before committing (occasionally found on the lower timeframes, such as the H1 and M15 timeframes).
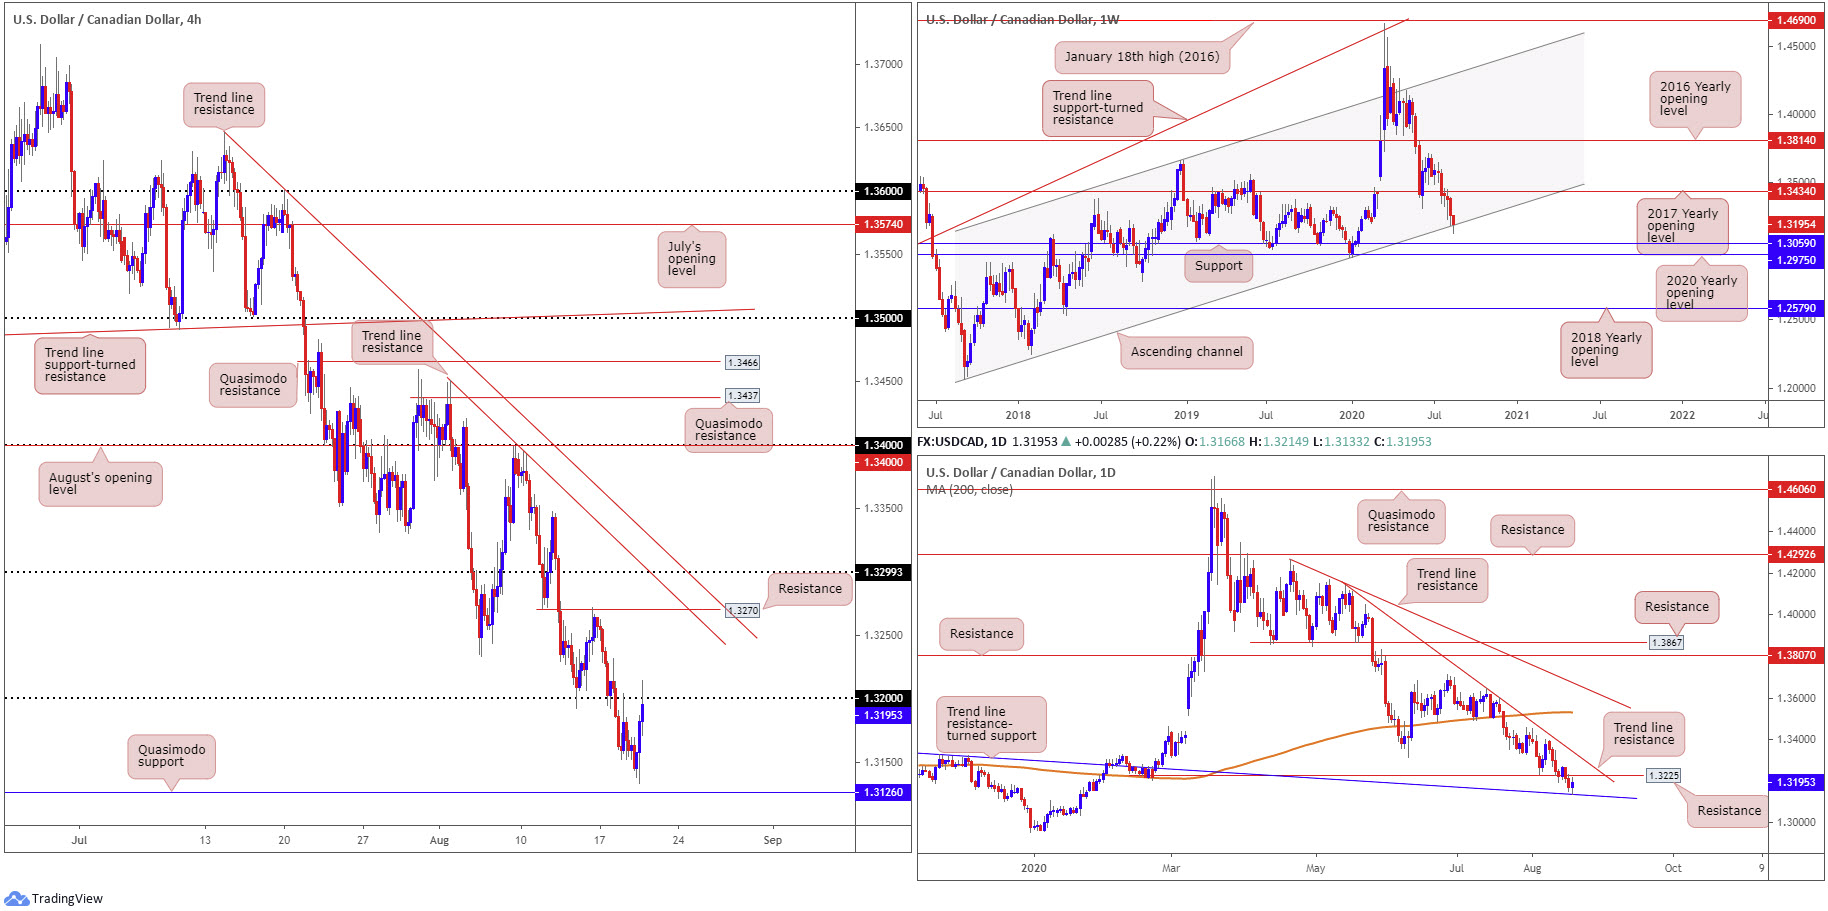
USD/CAD:
After cycling to multi-month lows at 1.3133, USD/CAD carved out a clear-cut bottom ahead of H4 Quasimodo support at 1.3126 Wednesday. Boosted on the back of rising US Treasury yields and the DXY reclaiming 92.50+ status, H4 recently crossed paths with the underside of 1.32. Space above here is relatively clear to resistance plotted at 1.3270 and trend line resistance, taken from the high 1.3451.
Breakout buyers above 1.32 are urged to tread with caution, as daily resistance lies around the 1.3225 region, a prior Quasimodo support level. Note daily price is also rebounding from a trend line resistance-turned support, extended from the high 1.3382. Alternatively, there is a possibility daily resistance might not hold much weight, having observed weekly price grip channel support, drawn from the low 1.2061.
Areas of consideration:
- Supporting bearish scenarios, the current trend points south, daily resistance is located at 1.3225 and H4 recently retested 1.32 as resistance.
- Supporting bullish scenarios, we have a daily trend line resistance-turned support, extended from the high 1.3382, in play, alongside weekly channel support, taken from the low 1.2061.
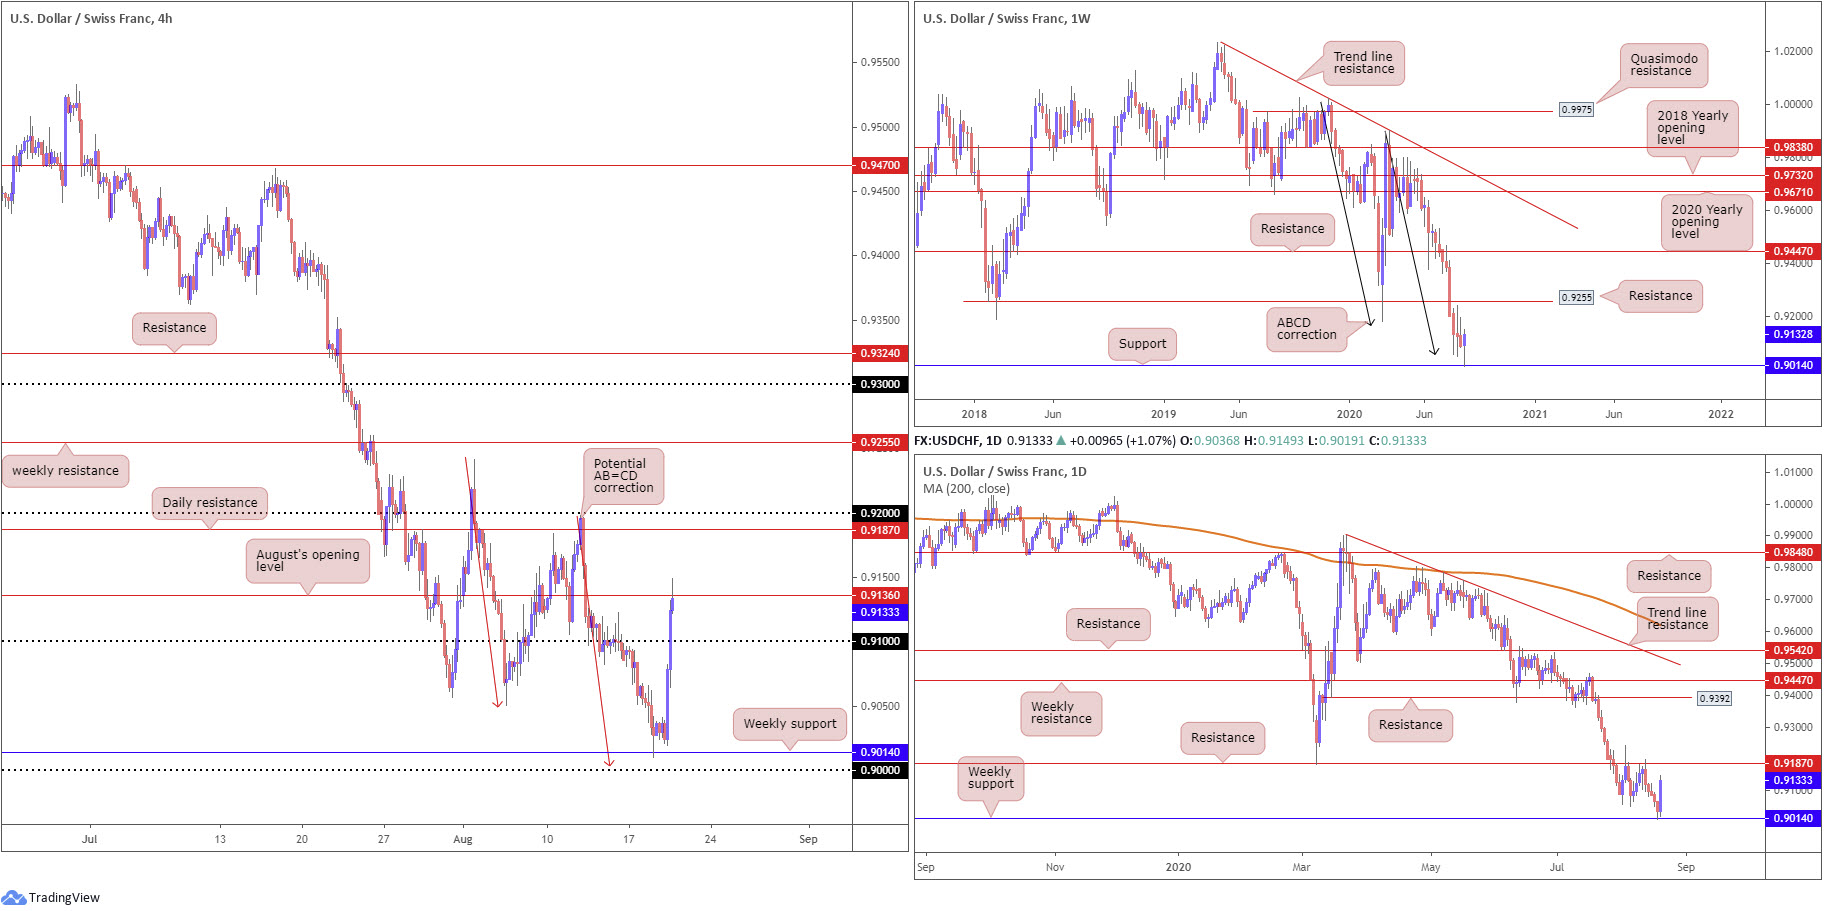
USD/CHF:
For those who read Wednesday’s technical briefing you may recall the following (italics):
The combination of strong support coating the 0.90 neighbourhood on the H4 timeframe today (weekly support at 0.9014, a weekly ABCD support at 0.9051 [black arrows] and a H4 AB=CD support at 0.9003 [red arrows]) is likely appealing to buyers, particularly countertrend strategies. While the area may not stimulate a major reversal, owing to the immediate downtrend in play, it is still a base that could prompt a recovery back to at least daily resistance at 0.9072 (since removed) and the 0.91 handle (H4).
As evident from the charts this morning, price staged an impressive rebound from the aforementioned structure, consequently pulling through the 0.91 handle on the H4 timeframe and shaking hands with August’s opening level at 0.9136. Beyond this barrier, price is tipped for additional outperformance to daily resistance at 0.9187 and the 0.92 handle (H4).
Areas of consideration:
Observing scope for further buying on the higher timeframes, a H4 close above August’s opening level at 0.9136 could be in store today. This gifts buyers another potential opportunity to long this market, either on the breakout or retest of 0.9136, targeting the aforementioned levels highlighted in bold.
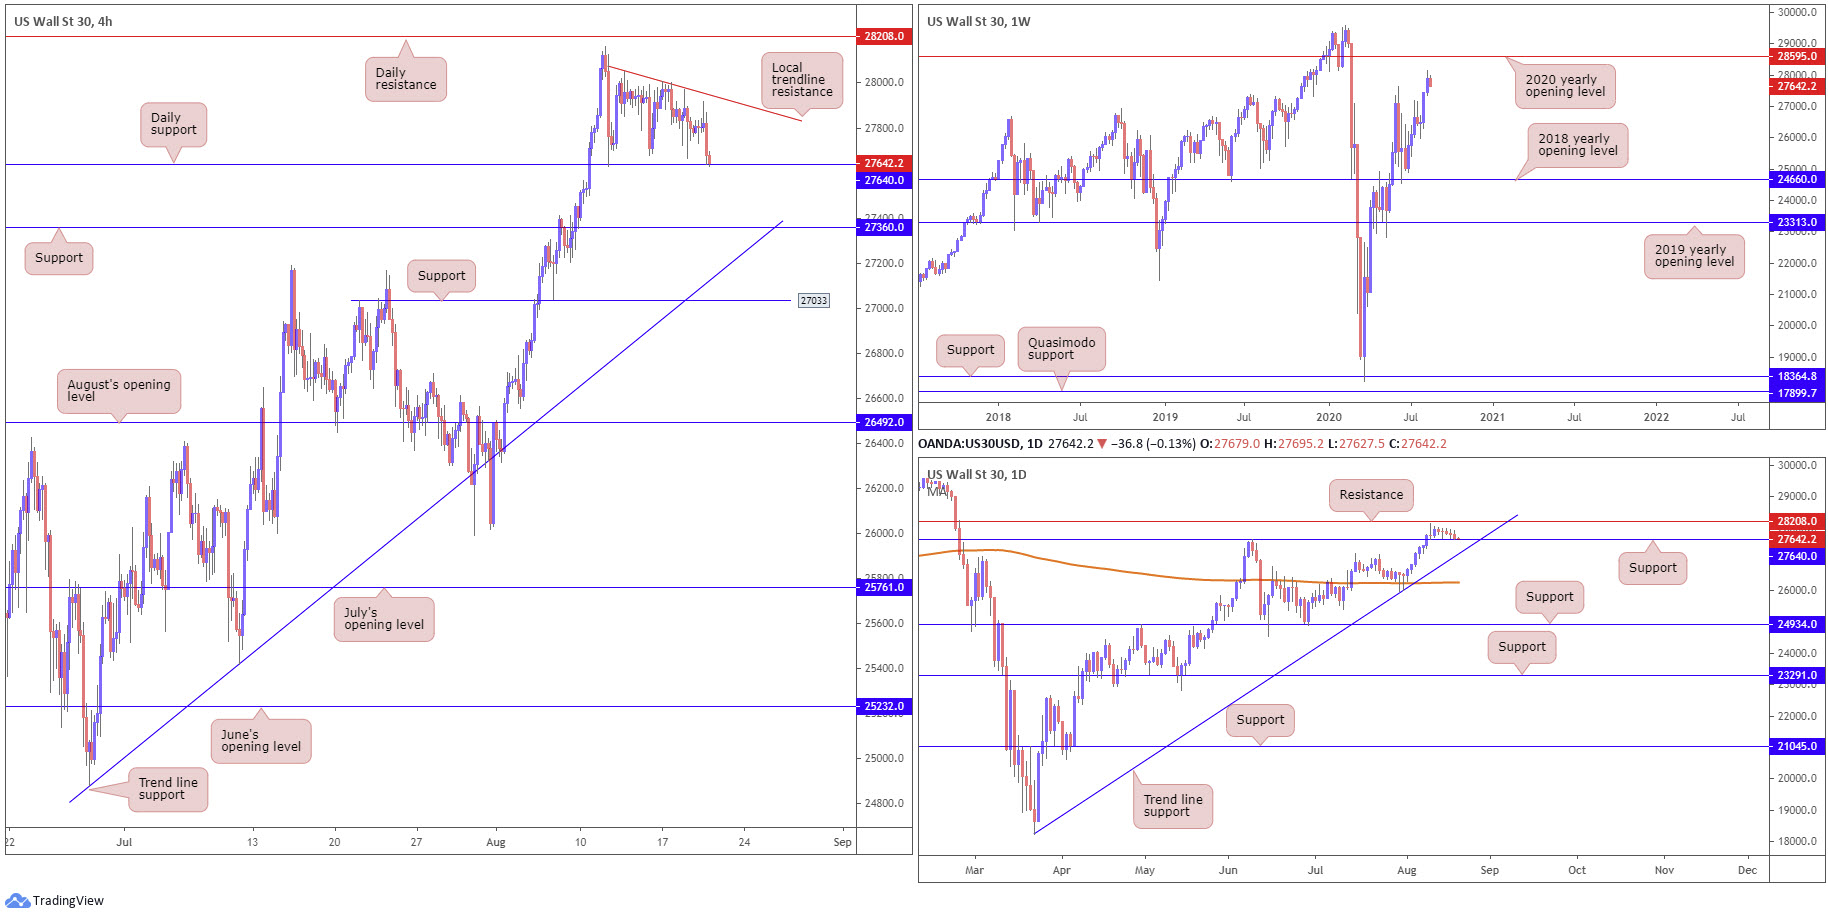
Dow Jones Industrial Average:
US equity benchmarks explored lower territory Wednesday Following the latest FOMC minutes. The Dow Jones Industrial Average declined 85.19 points, or 0.31%; the S&P 500 dropped 14.93 points, or 0.44% and the tech-heavy Nasdaq 100 traded lower by 80.39 points, or 0.71%.
H4 price, as can be seen from the chart, is retesting daily support located at 27640. H4 support at 27360 lies in wait should follow-through selling emerge today, closely positioned nearby trend line support, etched from the low 24881. It might also interest some traders to note that on the daily timeframe we also have trend line support, from the low 18213, positioned under current daily support at 27640.
Moves to the upside, a rally that engulfs local trend line resistance, from the high 28051, throws daily resistance at 28208 into the mix.
From the weekly timeframe, price traded strong last week, extending the prior week’s 3.5% advance and overthrowing the 27638 high. The unit is now poised to make a run for the 2020 yearly opening level at 28595.
Areas of consideration:
Daily support at 27640 represents a key level going into Thursday’s session. A rejection from here, one that preferably chalks up a bullish candlestick pattern, may tempt a challenge of nearby trend line resistance on the H4 timeframe (28051). A H4 close beneath daily support, on the other hand, puts forward possible bearish themes to H4 support at 27360.
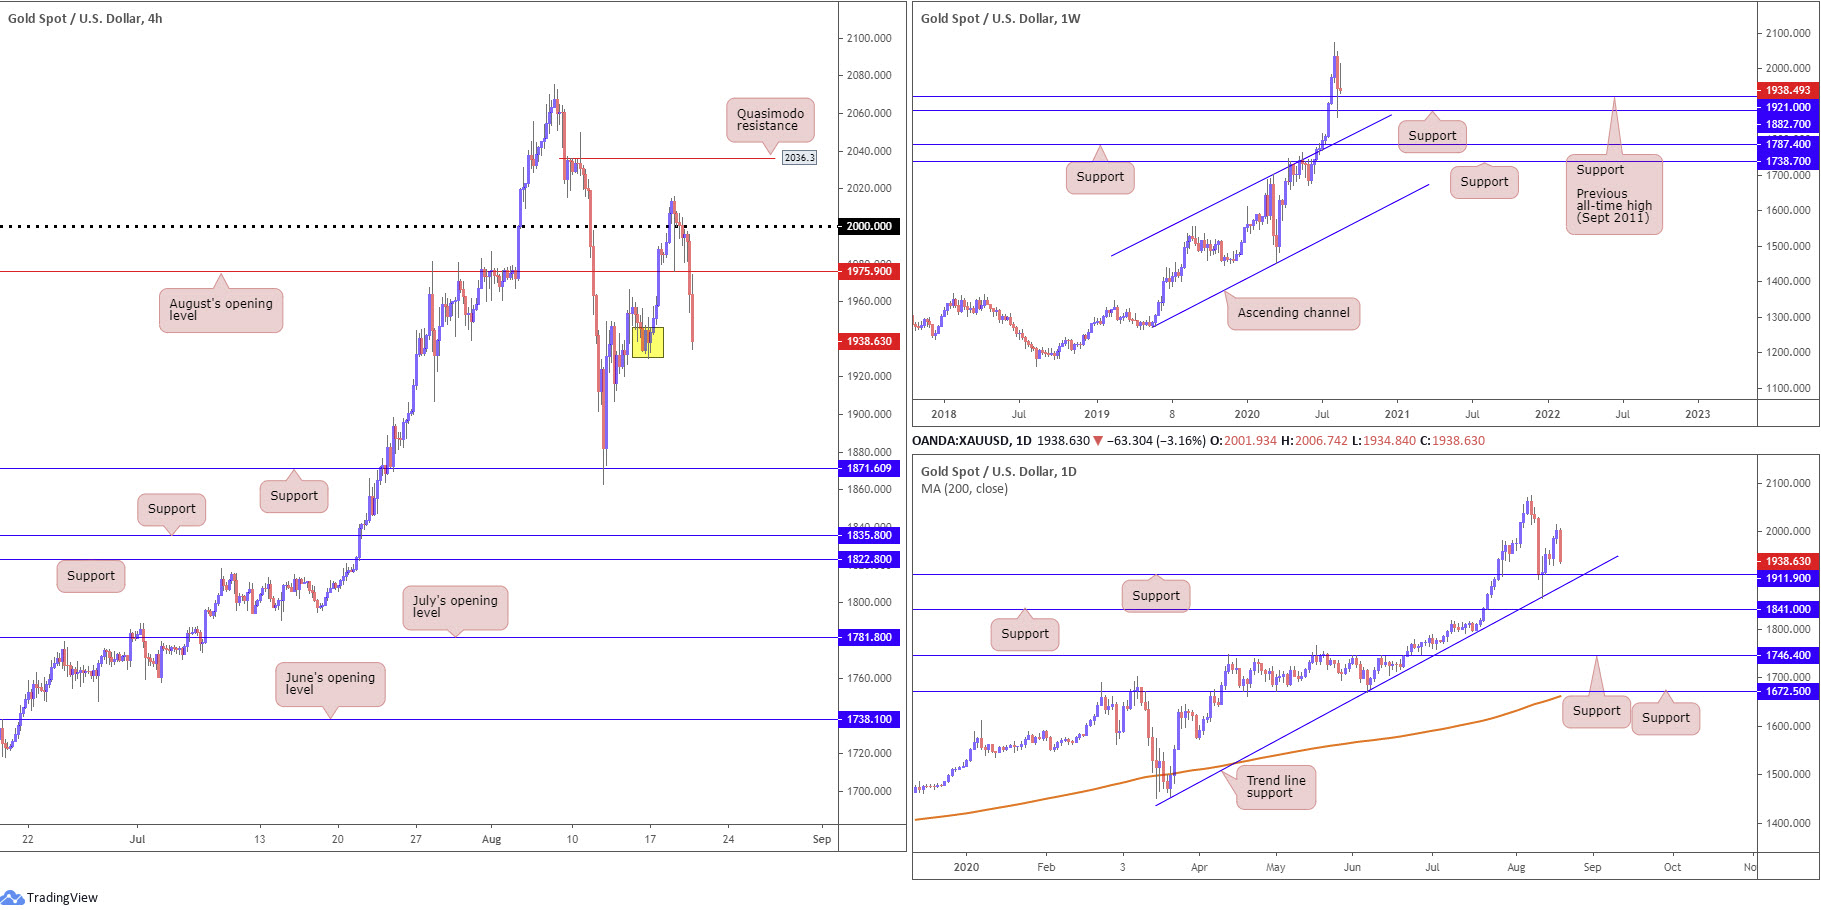
XAU/USD (GOLD):
Spot gold failed to sustain upside on Wednesday, erasing the week’s earlier gains amid rising US Treasury yields and the US dollar index establishing a footing above 92.50.
With $2,000.00 now a distant memory, and H4 price recently overthrowing August’s opening level at $1,975.90, we have possible H4 demand (yellow) at $1,930.34-$1,946.28 to contend with right now. Breaking here confirms further weakness could be in store for the yellow metal to H4 support at $1,871.60.
In spite of the recent dip, the underlying trend has remained strong since 2016. Additionally, the following support structures hover nearby:
- $1,921.00, the previous all-time high (September 2011).
- Weekly support at $1,882.70.
- Daily trend line support, extended from the low $1,455.32.
- Daily support from $1,911.90.
Areas of consideration:
Between $1,911.90 (daily support) and $1,921.00 (weekly level) is an area crosshairs will likely be fixed on should the H4 candles engulf current demand. A notable H4 bullish candlestick forming within the aforementioned higher timeframe area may see a recovery take over and perhaps a revisit at August’s opening level from $1,975.9.
The accuracy, completeness and timeliness of the information contained on this site cannot be guaranteed. IC Markets does not warranty, guarantee or make any representations, or assume any liability regarding financial results based on the use of the information in the site.
News, views, opinions, recommendations and other information obtained from sources outside of www.icmarkets.com.au, used in this site are believed to be reliable, but we cannot guarantee their accuracy or completeness. All such information is subject to change at any time without notice. IC Markets assumes no responsibility for the content of any linked site.
The fact that such links may exist does not indicate approval or endorsement of any material contained on any linked site. IC Markets is not liable for any harm caused by the transmission, through accessing the services or information on this site, of a computer virus, or other computer code or programming device that might be used to access, delete, damage, disable, disrupt or otherwise impede in any manner, the operation of the site or of any user’s software, hardware, data or property.


