
DXY:
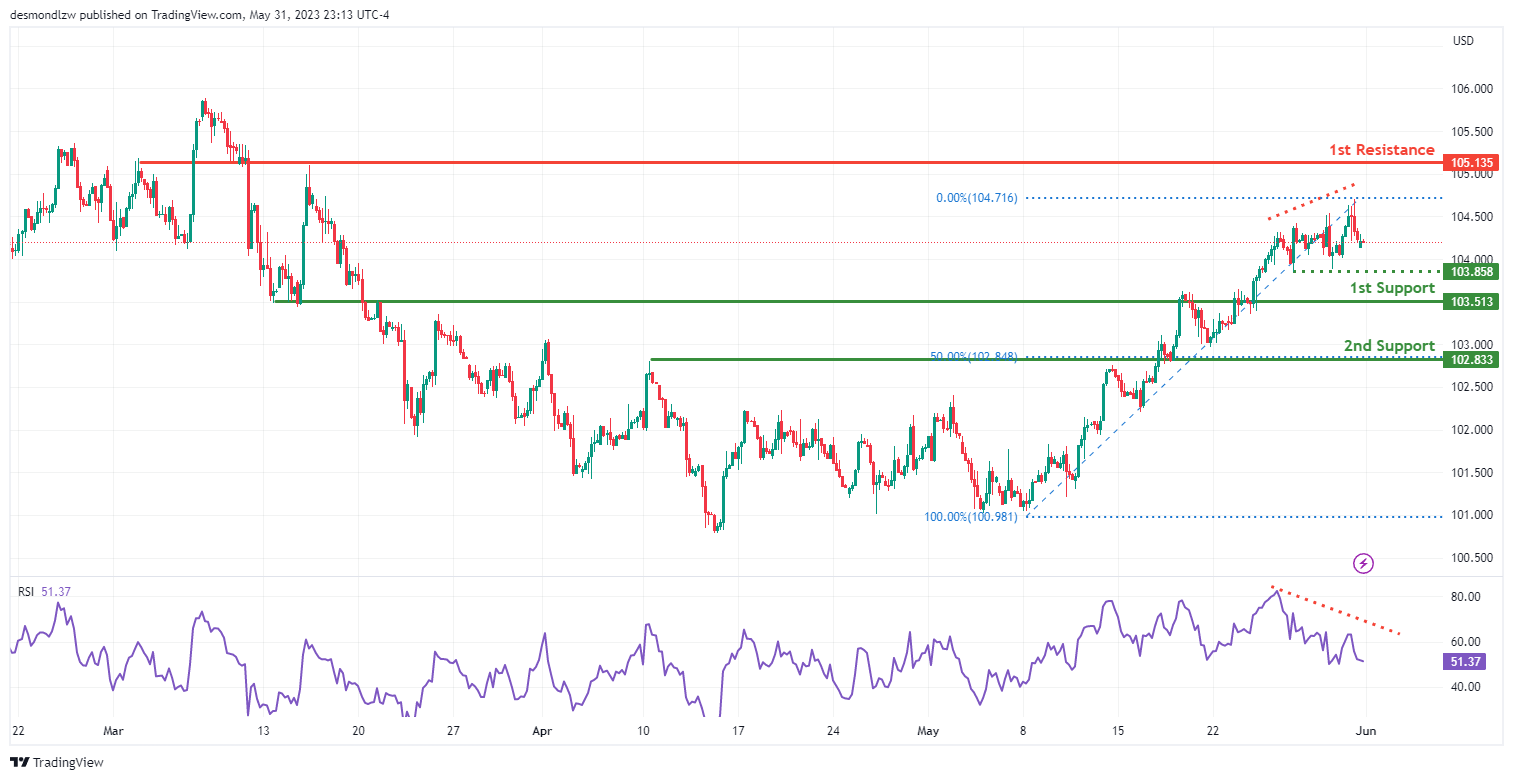
The DXY (Dollar Index) chart currently exhibits a weak bearish momentum, suggesting a potential continuation of the downward trend.
However, the confidence in this bearish sentiment is low, indicating some uncertainty in the market. The chart shows that the price could potentially experience a bearish reaction from the first resistance level and decline towards the first support level. The 103.51 level serves as a significant support area, identified as a pullback support, where buyers have previously entered the market.
Another support level at 102.83, which aligns with the 50% Fibonacci retracement, adds further credibility to its importance. On the other hand, the first resistance at 105.13 may act as a temporary barrier to upward price movements, potentially causing a pause or retracement in the bearish trend.
Additionally, the intermediate support level at 103.85, identified as a multi-swing low support, has shown its significance in attracting buyers.
Moreover, the Relative Strength Index (RSI) is testing major resistance, suggesting a potential reversal in the near future, which aligns with the possibility of a bearish reaction from the first resistance level
EUR/USD:
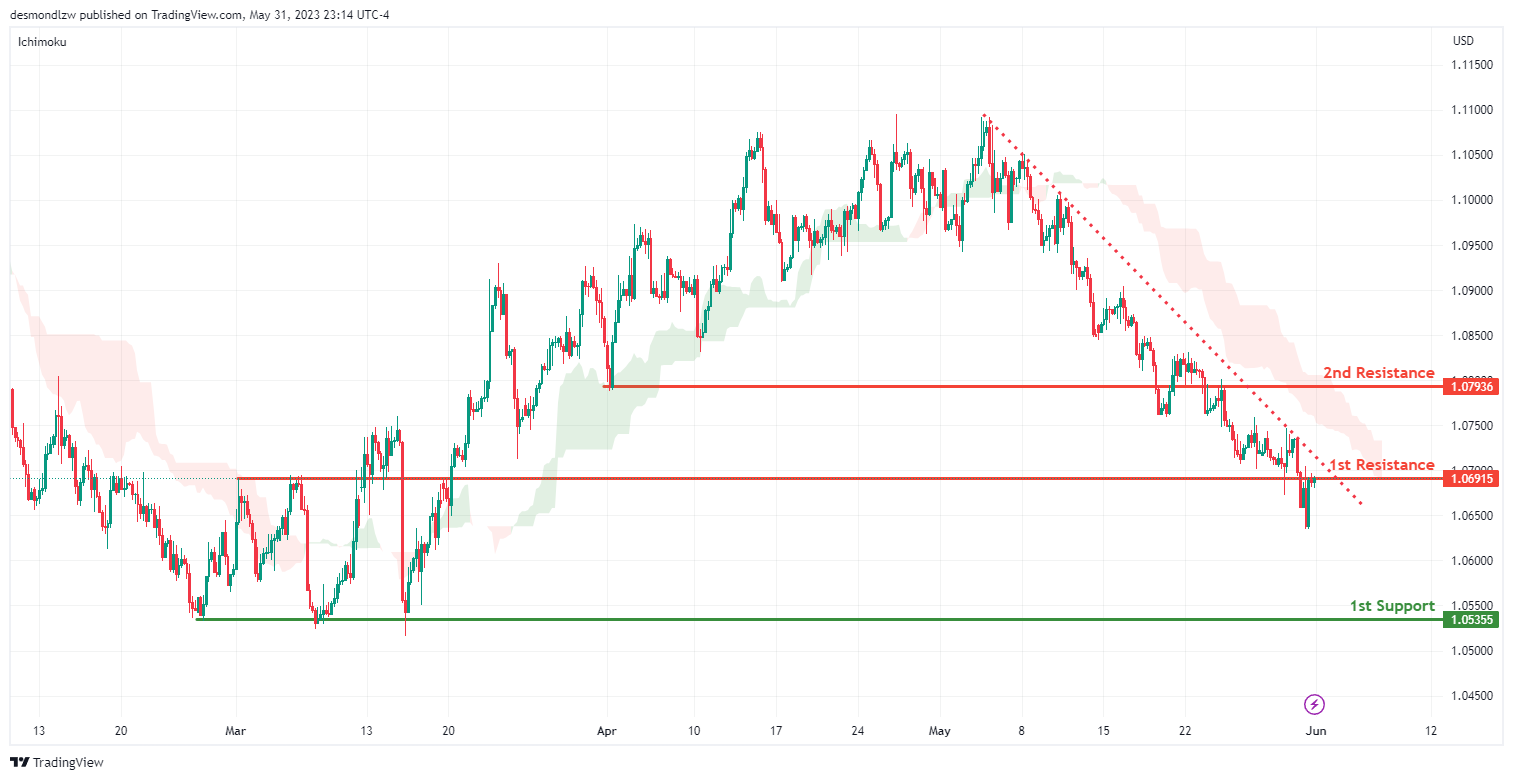
The EUR/USD chart currently exhibits a bearish momentum, supported by the fact that the price is below a major descending trend line, indicating the presence of bearish pressure. Additionally, the price is below the bearish Ichimoku cloud, further reinforcing the bearish sentiment.
Considering this bearish momentum, it is possible that the price could experience a bearish reaction from the first resistance level and decline towards the first support level. The 1.0535 level serves as a significant support area, identified as a multi-swing low support. This level has previously shown its significance as a price level where buyers have entered the market.
On the other hand, the first resistance at 1.0691 may act as a temporary barrier to upward price movements, potentially causing a pause or retracement in the bearish trend. It is identified as an overlap resistance, adding to its importance. Furthermore, the second resistance at 1.0793 is also identified as an overlap resistance.
GBP/USD:
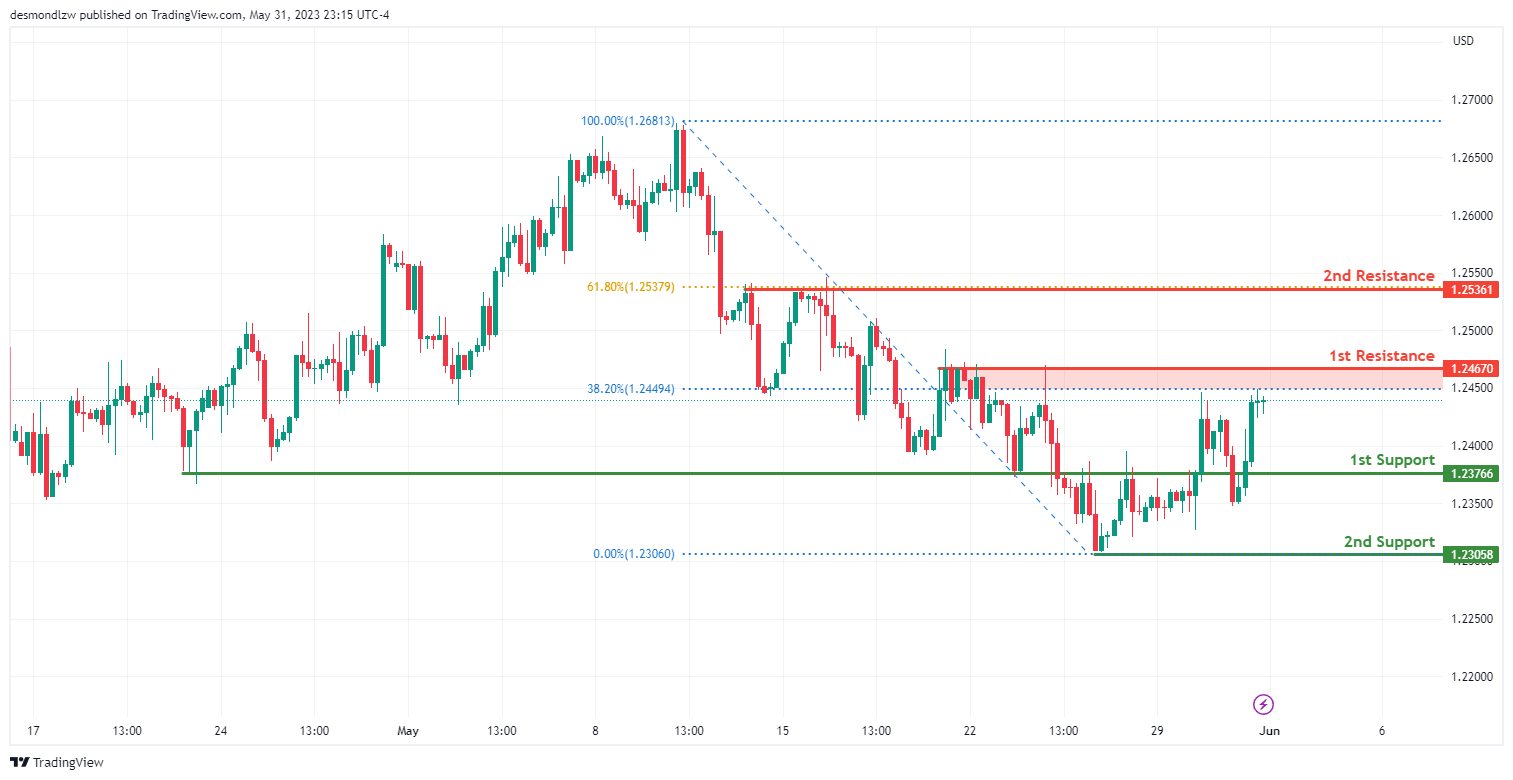
The GBP/USD chart currently exhibits a bearish momentum, indicating a downward trend in the market.
Considering this bearish momentum, it is possible that the price could experience a bearish reaction from the first resistance level and decline towards the first support level. The 1.2376 level serves as a significant support area, identified as a pullback support. This level has previously shown its importance as a price level where buyers have entered the market.
Additionally, the second support level at 1.2305 is identified as a swing low support, further strengthening its significance.
On the other hand, the first resistance at 1.2467 may act as a temporary barrier to upward price movements, potentially causing a pause or retracement in the bearish trend. This level is identified as a multi-swing high resistance and coincides with the 38.20% Fibonacci retracement level, adding to its significance.
Furthermore, the second resistance at 1.2536 is also identified as a multi-swing high resistance and aligns with the 61.80% Fibonacci retracement level, making it another notable level to watch.
USD/CHF:
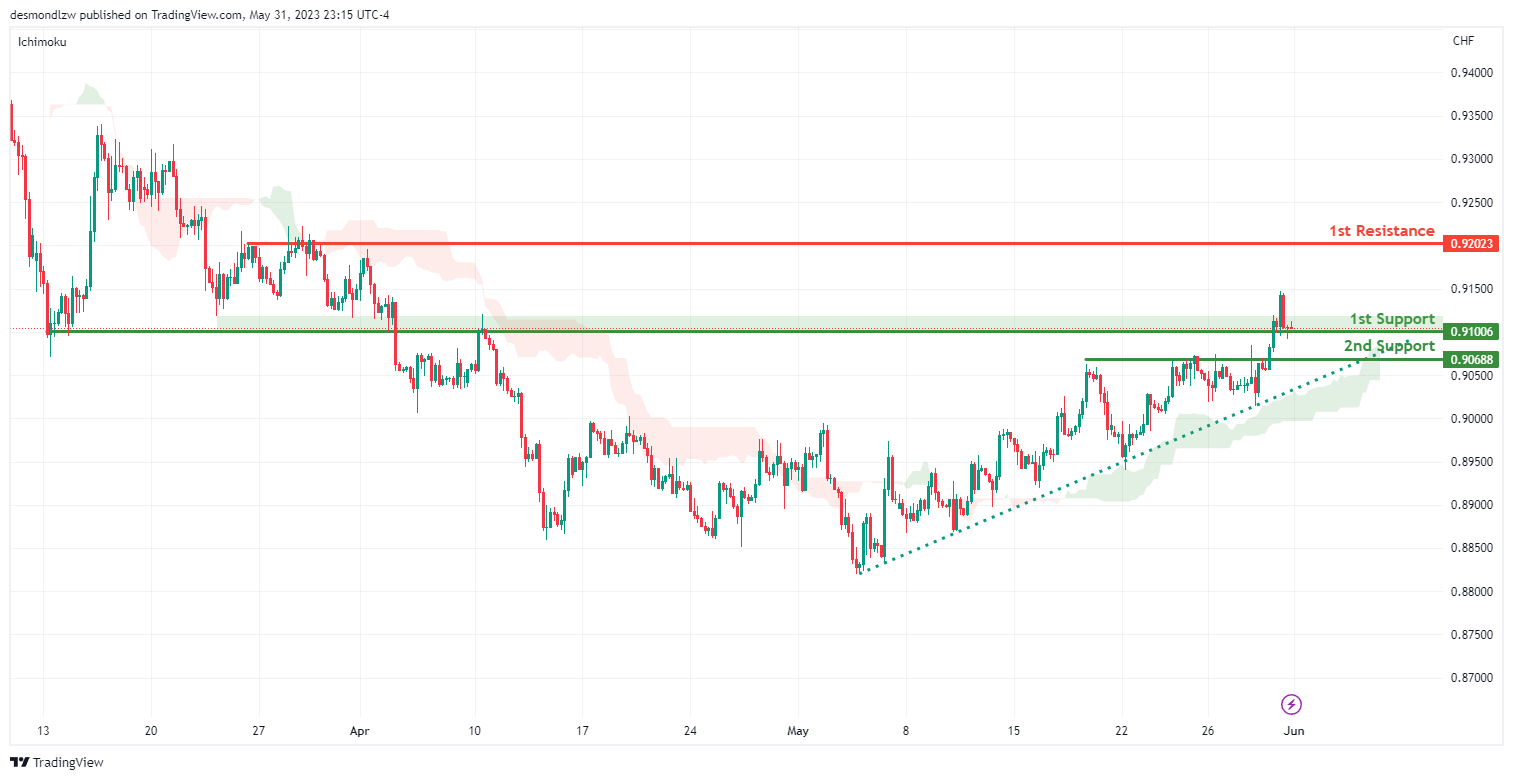
The USD/CHF chart currently exhibits a bullish momentum, indicating an upward trend in the market.
Contributing to this bullish momentum is the fact that the price is above the bullish Ichimoku cloud, which suggests positive sentiment, and it is also above a major ascending trend line, indicating further potential for bullish momentum.
Considering this bullish momentum, it is possible that the price could experience a bullish bounce off the first support level and move towards the first resistance level. The 1.2376 level serves as a significant support area, identified as an overlap support. This level has shown its importance as a price level where buyers have entered the market.
Additionally, the second support level at 0.9068 is identified as a pullback support, further adding to its significance.
On the other hand, the first resistance at 0.9202 may act as a temporary barrier to further upward price movements, potentially causing a pause or retracement in the bullish trend. This level is identified as a multi-swing high resistance and coincides with the 38.20% Fibonacci retracement, making it a notable level to watch.
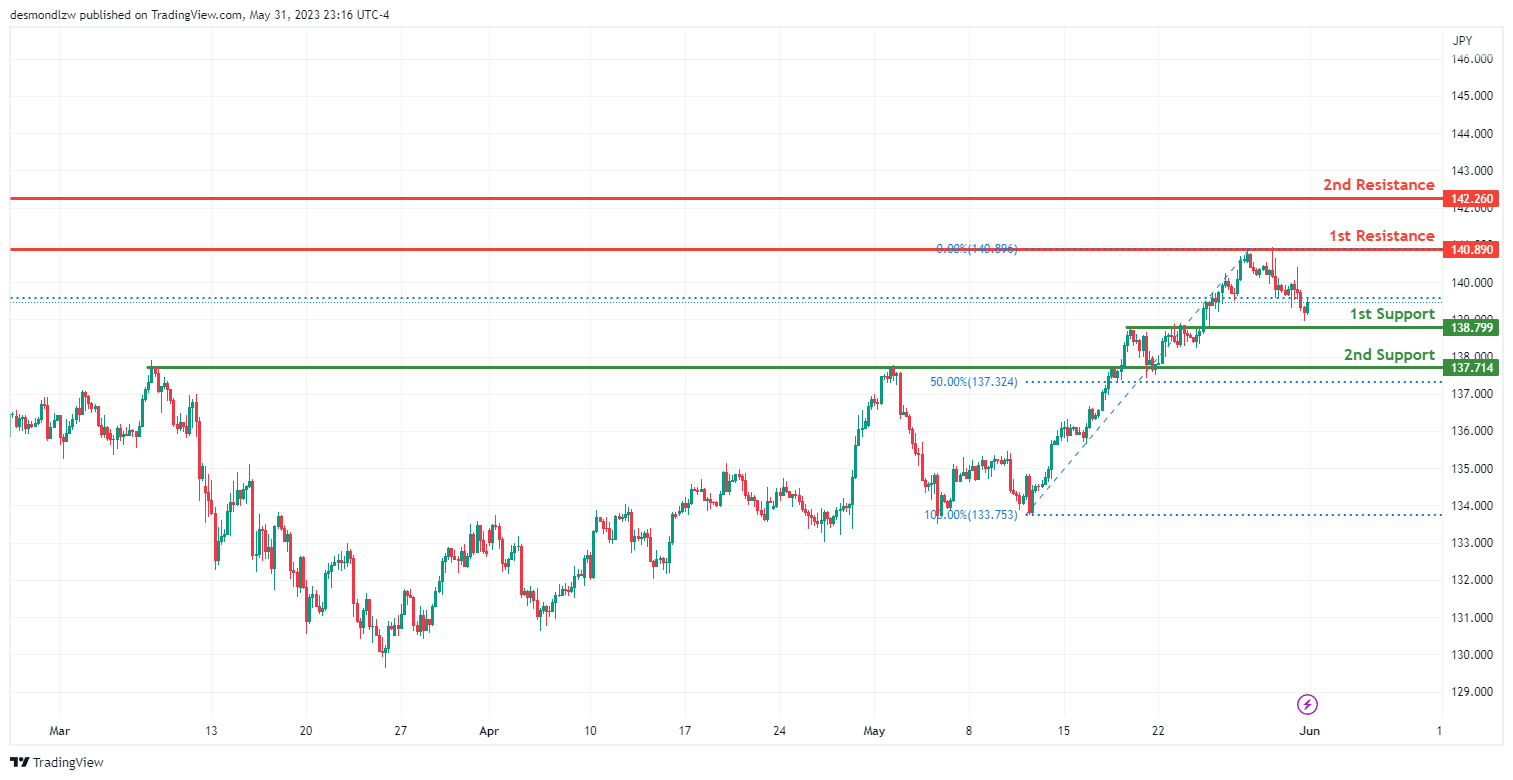
USD/JPY:
The USD/JPY chart currently exhibits a bullish momentum, indicating an upward trend in the market.
Considering this bullish momentum, it is possible that the price could experience a bullish bounce off the first support level and move towards the first resistance level. The 138.79 level serves as a significant support area, identified as an overlap support. This level has previously shown its importance as a price level where buyers have entered the market.
Additionally, the second support level at 137.71 is identified as an overlap support and aligns with the 50% Fibonacci retracement, further adding to its significance.
On the other hand, the first resistance at 140.89 may act as a temporary barrier to further upward price movements, potentially causing a pause or retracement in the bullish trend. This level is identified as a pullback resistance.
Furthermore, the second resistance at 142.26 is identified as a swing high resistance, indicating its historical significance as a price level where selling pressure has emerged.
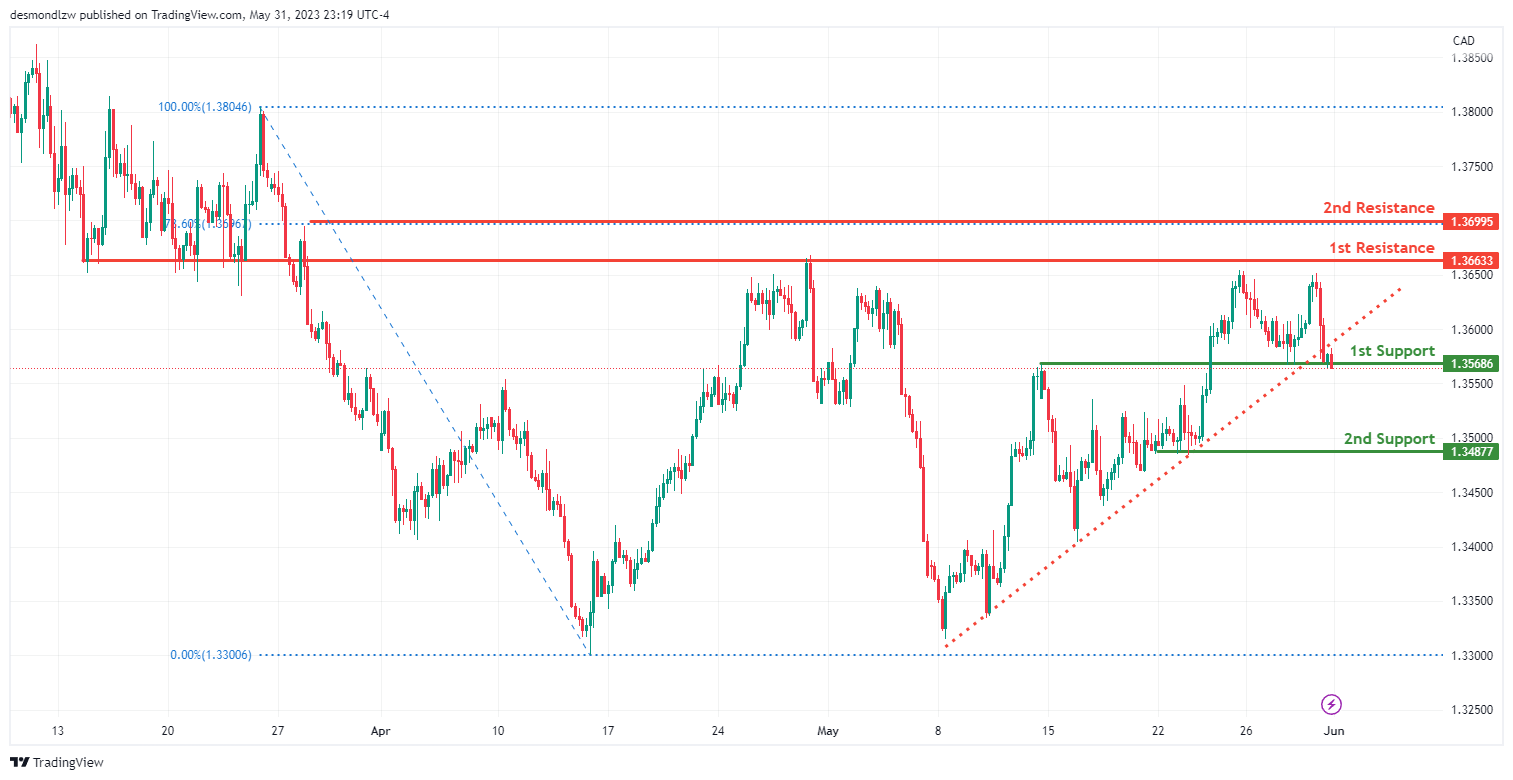
USD/CAD:
The USD/CAD chart currently exhibits a bearish momentum, indicating a downward trend in the market.
Contributing to this bearish momentum is the fact that the price has broken below an ascending support line, triggering a potential bearish move.
Considering this bearish momentum, it is possible that the price could experience a bearish break off the first support level and drop towards the second support level. The 1.3568 level serves as a significant support area, identified as an overlap support. This level has previously shown its importance as a price level where buyers have entered the market.
Additionally, the second support level at 1.3487 is identified as a multi-swing low support and aligns with the 50% Fibonacci retracement, further adding to its significance.
On the other hand, the first resistance at 1.3663 may act as a temporary barrier to upward price movements, potentially causing a pause or retracement in the bearish trend. This level is identified as a multi-swing high resistance.
Furthermore, the second resistance at 1.3699 is identified as a swing high resistance and coincides with the 78.60% Fibonacci retracement level, making it another notable level to watch.
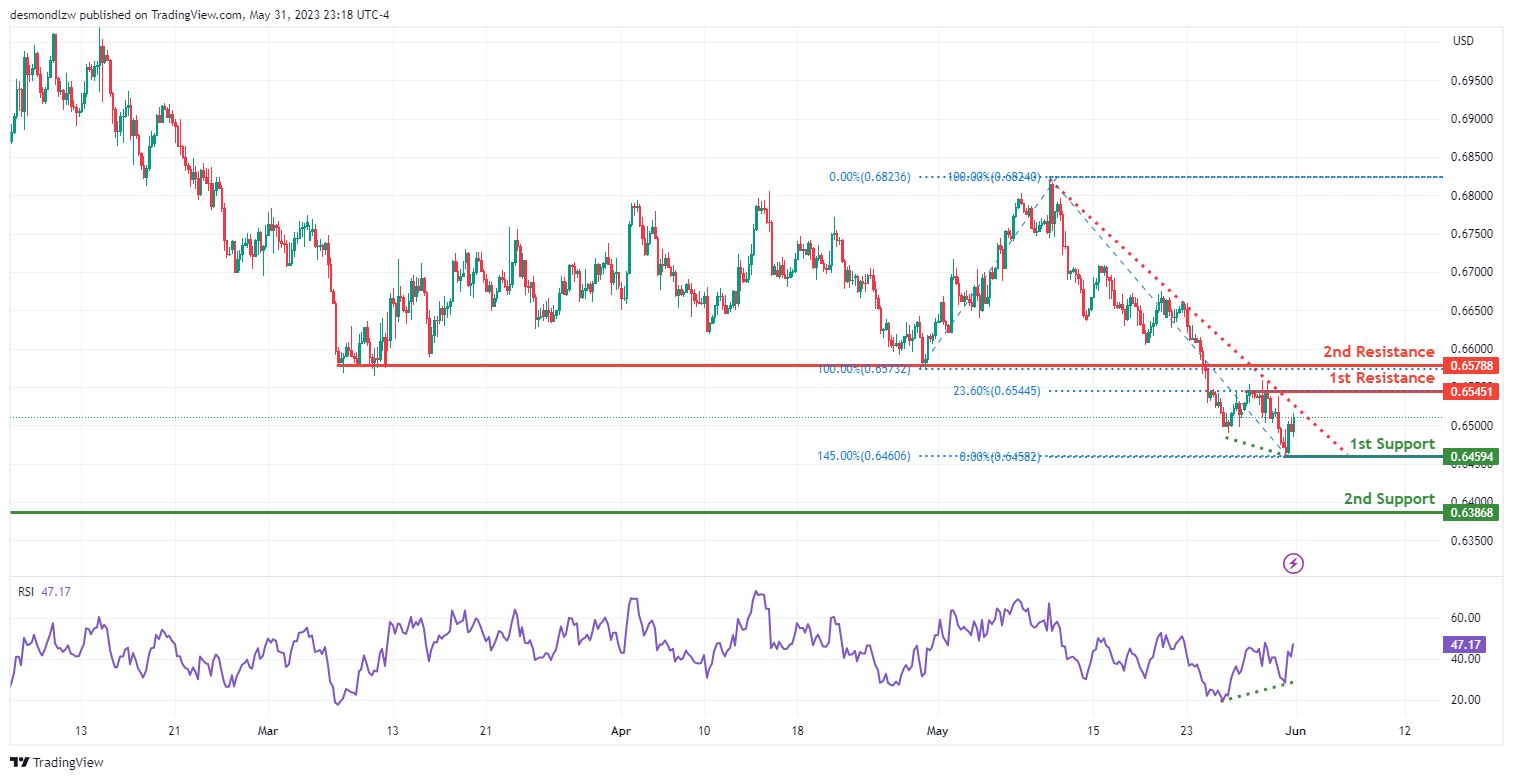
AUD/USD:
The AUD/USD chart is presently demonstrating a bullish momentum, signifying a rising trend in the market. However, to complete this upward momentum, however, the price needs to break above a major descending trend line to confirm this bullish momentum.
Given this bullish momentum, the price may potentially ascend towards the first resistance level. The 0.6459 level serves as a crucial support zone, known as an overlap support. This level has proved itself as a spot where buyers have stepped into the market. Additionally, its alignment with the 145.00% Fibonacci extension enhances its validity as a potential support area.
The second support level at 0.6386 is also notable as a pullback support, reinforcing its significance.
Conversely, the first resistance at 0.6545 may pose a temporary obstacle to further upward price movements. This level is known as a multi-swing high resistance, indicating its historical importance as a price level where selling pressure has occurred.
The second resistance at 0.6578 is also recognized as a pullback resistance.
Moreover, the RSI (Relative Strength Index) is showing bullish divergence compared to the price, indicating a potential bullish reversal in the market.
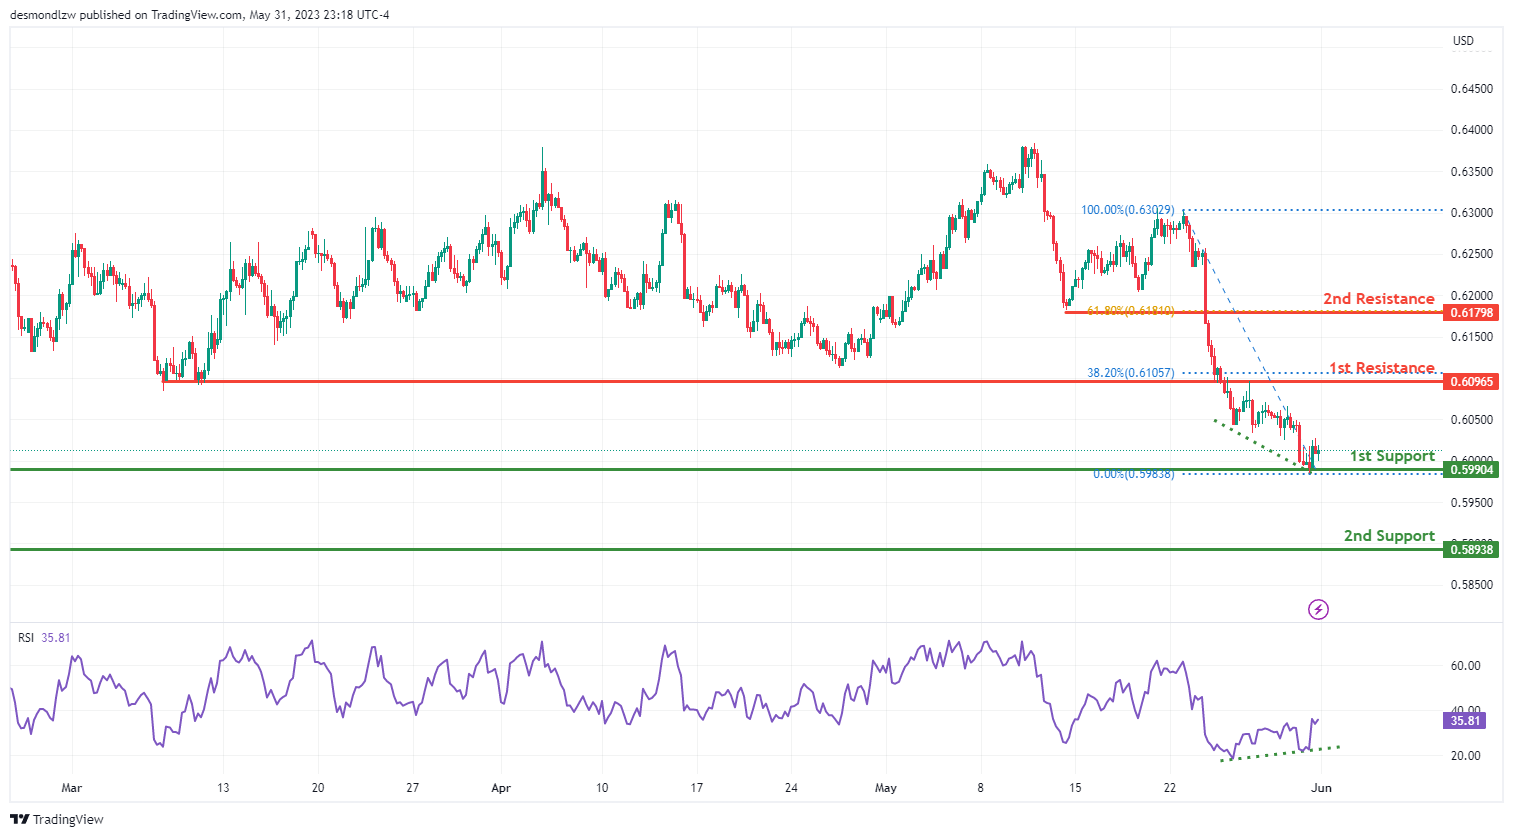
NZD/USD
The NZD/USD chart currently exhibits a bullish momentum, indicating an upward trend in the market.
Considering this bullish momentum, it is possible that the price could continue its upward movement towards the first resistance level. The 0.5990 level serves as a significant support area, identified as a swing low support. This level has shown its importance as a price level where buyers have entered the market.
Additionally, the second support level at 0.5893 is identified as a pullback support, further adding to its significance.
On the other hand, the first resistance at 0.6096 may act as a temporary barrier to further upward price movements. This level is identified as an overlap resistance and coincides with the 38.20% Fibonacci retracement, making it a notable level to watch.
Furthermore, the second resistance at 0.6179 is identified as a pullback resistance and aligns with the 61.80% Fibonacci retracement level, adding to its importance.
Moreover, the RSI (Relative Strength Index) is displaying bullish divergence versus price, suggesting a potential bullish reversal in the market.
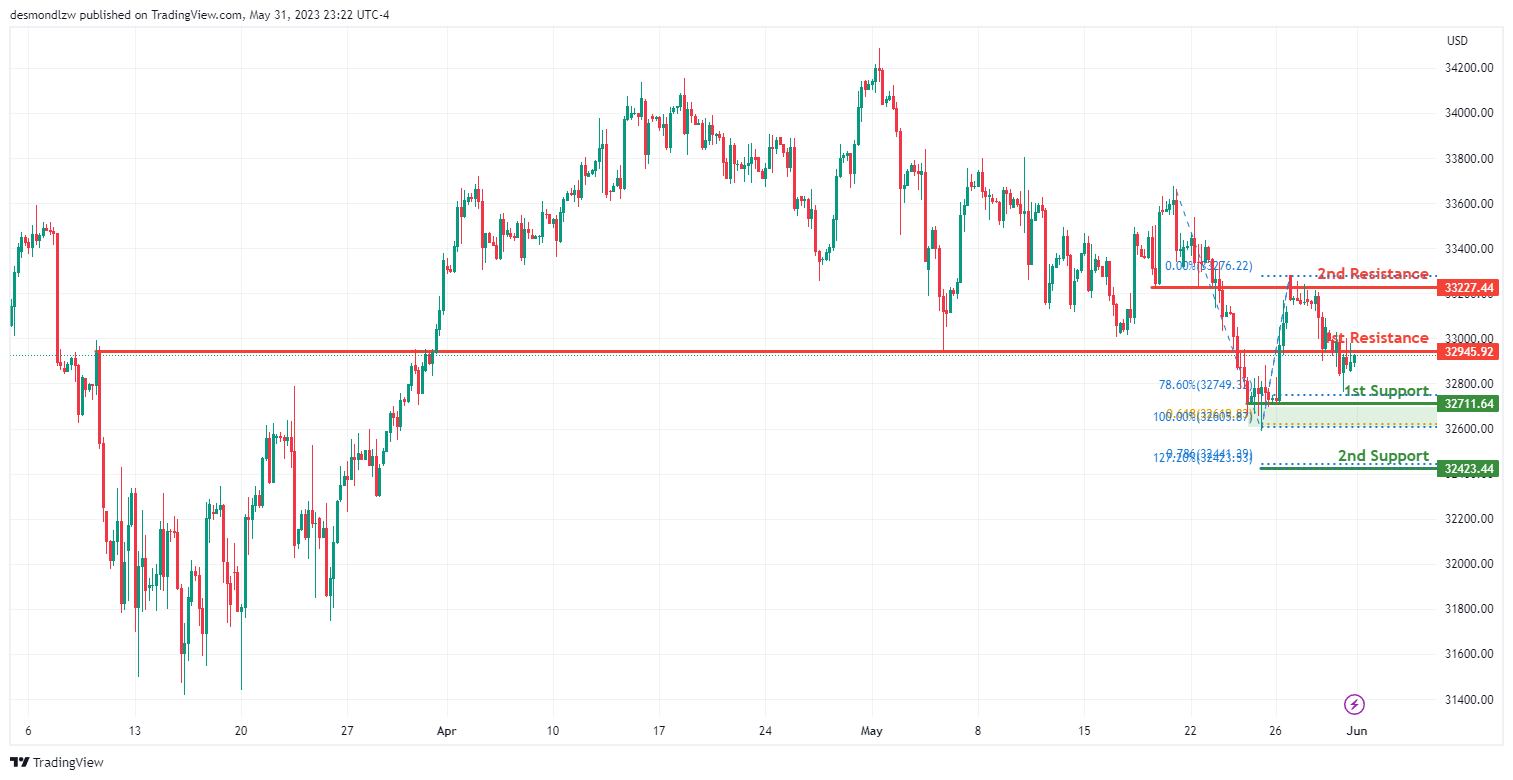
DJ30:
The DJ30 (Dow Jones Industrial Average) chart currently exhibits a weak bearish momentum with low confidence, suggesting a potential continuation of the downward trend.
Considering this bearish momentum, it is possible that the price could experience a bearish reaction off the first resistance level and drop towards the first support level. The 32,711.64 level serves as a significant support area, identified as a multi-swing low support. This level carries historical importance as a price level where buyers have previously entered the market. Additionally, it aligns with the 61.80% Fibonacci expansion and the 78.60% Fibonacci retracement, providing further credibility to its significance as a potential support area.
Furthermore, the second support level at 32,423.44 is identified as a support level based on the 78.60% Fibonacci projection and the 127.20% Fibonacci extension. These Fibonacci levels add to its importance as a potential support area.
On the other hand, the first resistance at 32,945.92 may act as a temporary barrier to further upward price movements. This level is identified as an overlap resistance.
Additionally, the second resistance at 33,227.44 is identified as an overlap resistance.
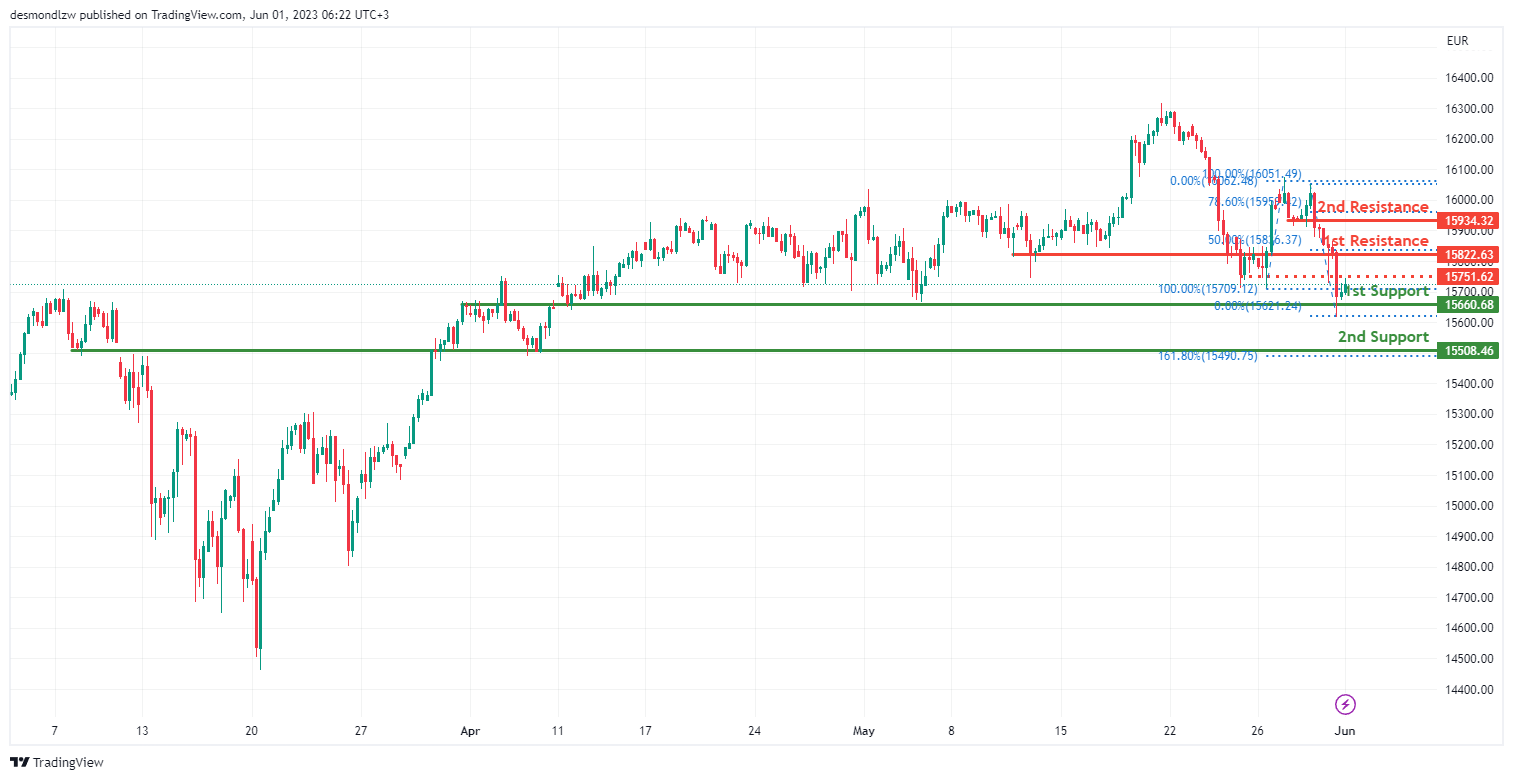
GER30:
The GER30 (Germany 30) chart currently exhibits weak bearish momentum with low confidence, suggesting a potential continuation of the downward trend.
Considering this bearish momentum, the price might continue its downward trajectory towards the first support level. The 15,660.68 level serves as a significant support area, identified as an overlap support. This level has proven its importance as a price level where buyers have entered the market.
In addition, the second support level at 15,508.46 is also identified as an overlap support, further reinforcing its significance.
On the other hand, the first resistance at 15,833.63 may act as a temporary barrier to further upward price movements. This level is identified as a pullback resistance.
Furthermore, the second resistance at 15,934.32, lining up with the 78.60% Fibonacci retracement, is identified as a potential resistance level. This level adds to its importance as a potential obstacle to upward price movements.
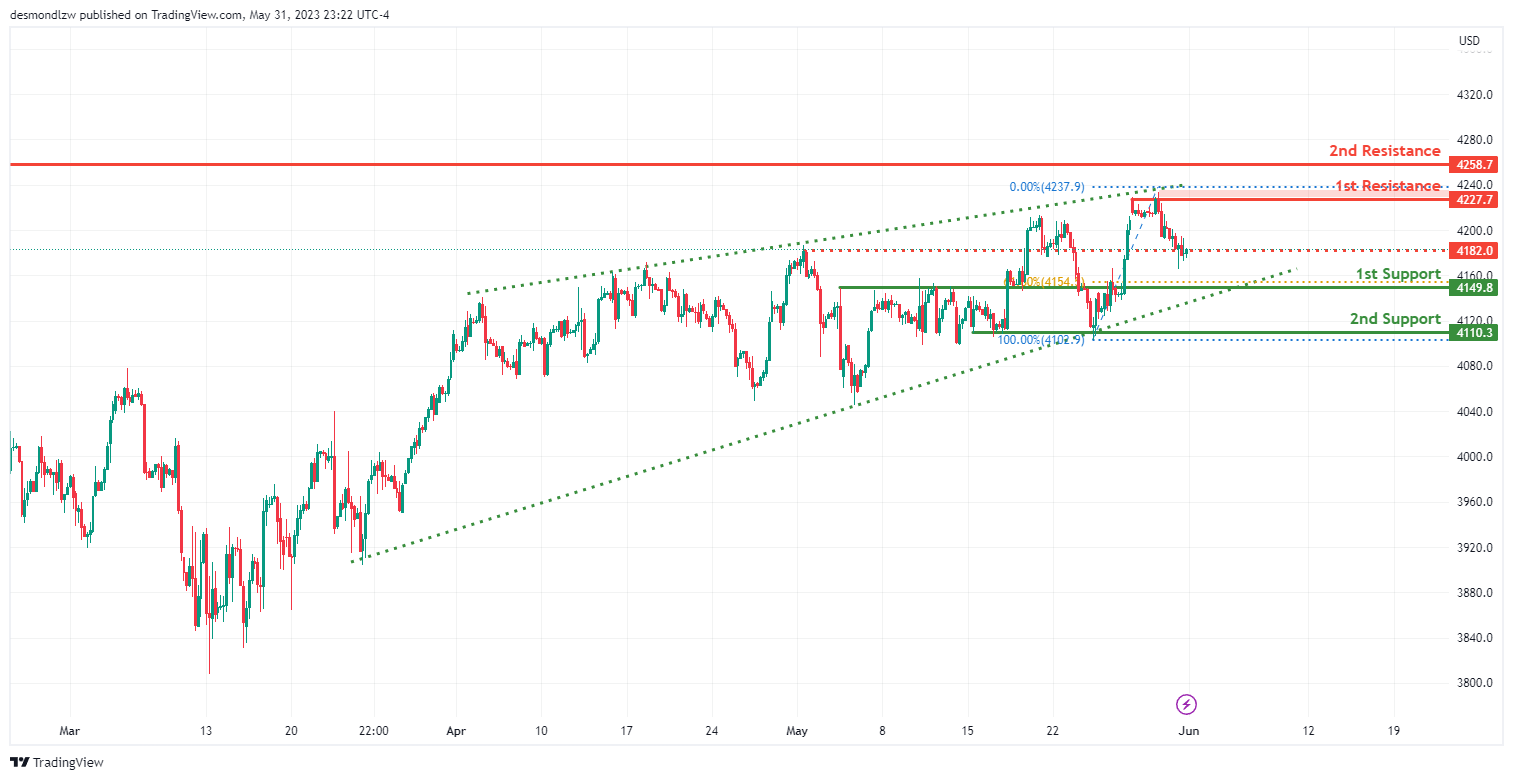
US500
The US500 (S&P 500) chart currently exhibits a bullish momentum, suggesting a potential rise in the short term. However, in the immediate term, there is a possibility of a drop towards the first support level before bouncing and rising towards the first resistance level.
The first support level at 4,149.8 serves as a significant level, identified as a pullback support. This level aligns with the 61.80% Fibonacci retracement, adding to its importance as a potential support area. Additionally, the second support level at 4,110.3 is identified as a multi-swing low support, further adding to its significance.
On the other hand, the first resistance level at 4,227.7 represents a multi-swing high resistance. This level may act as a temporary barrier to further upward price movements.
Furthermore, the second resistance level at 4,258.7 is identified as a pullback resistance, potentially causing a pause or retracement in the bullish trend.
Additionally, the intermediate resistance level at 4,180.0 is identified as a pullback resistance.
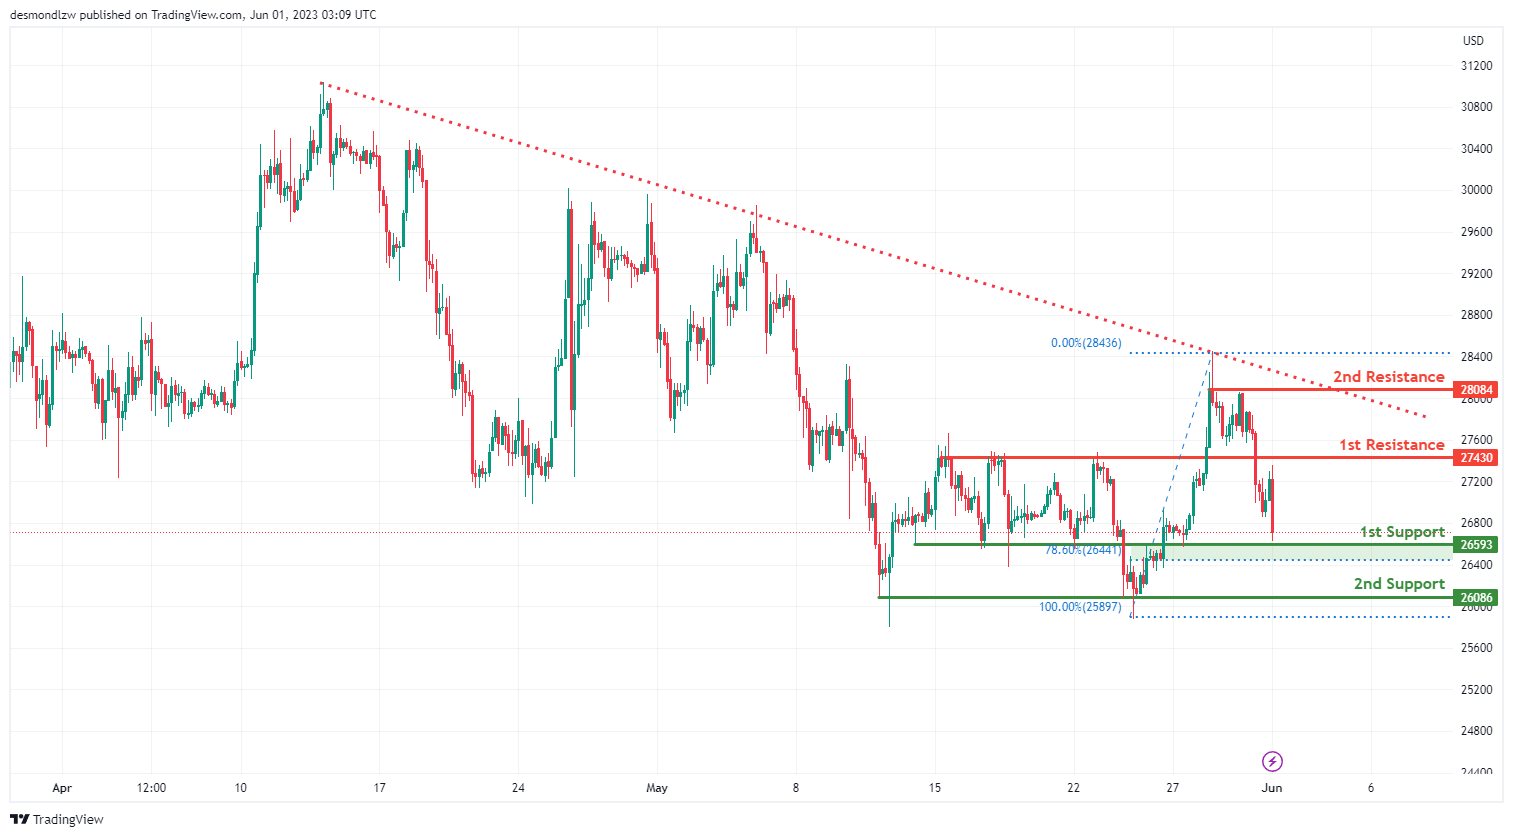
BTC/USD:
The BTC/USD (Bitcoin/US Dollar) chart currently exhibits a bearish momentum, suggesting a potential continuation of the downward trend. One of the contributing factors to this momentum is that the price is below a major descending trend line, indicating the presence of bearish pressure.
Considering this bearish momentum, it is possible that the price could experience a bearish reaction off the first resistance level and drop towards the first support level.
The first support level at 26,593 serves as a significant level, identified as an overlap support. This level also aligns with the 78.60% Fibonacci retracement, further reinforcing its importance as a potential support area. Additionally, the second support level at 26,086 is identified as a multi-swing low support, adding to its significance.
On the other hand, the first resistance level at 27,430 represents an overlap resistance. This level may act as a temporary barrier to further upward price movements.
Furthermore, the second resistance level at 28,084 is identified as a multi-swing high resistance, potentially causing a pause or retracement in the bearish trend.
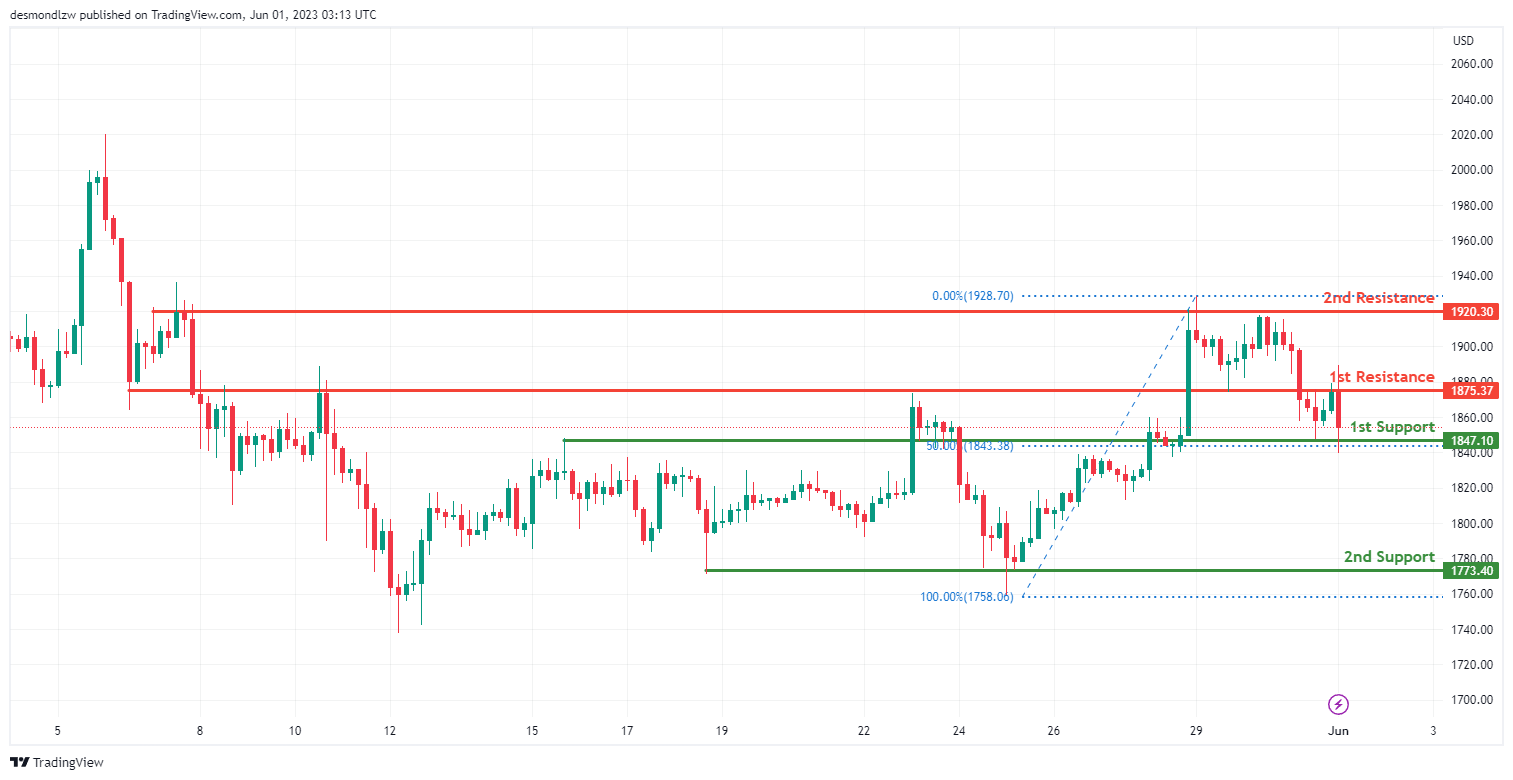
ETH/USD:
The ETH/USD (Ethereum/US Dollar) chart currently exhibits a bearish momentum, indicating a potential continuation of the downward trend.
Considering this bearish momentum, it is possible that the price could experience a bearish break off the first support level and drop towards the second support level.
The first support level at 1847.10 represents an overlap support, signifying its significance as a potential support area. Additionally, the second support level at 1773.40 is identified as a multi-swing low support, further reinforcing its importance. This level also aligns with the 50% Fibonacci retracement, providing additional credibility to its role as a potential support level.
On the other hand, the first resistance level at 1875.37 represents an overlap resistance, potentially acting as a temporary barrier to further upward price movements.
Furthermore, the second resistance level at 1920.30 is identified as a multi-swing high resistance, which could create a pause or retracement in the bearish trend.
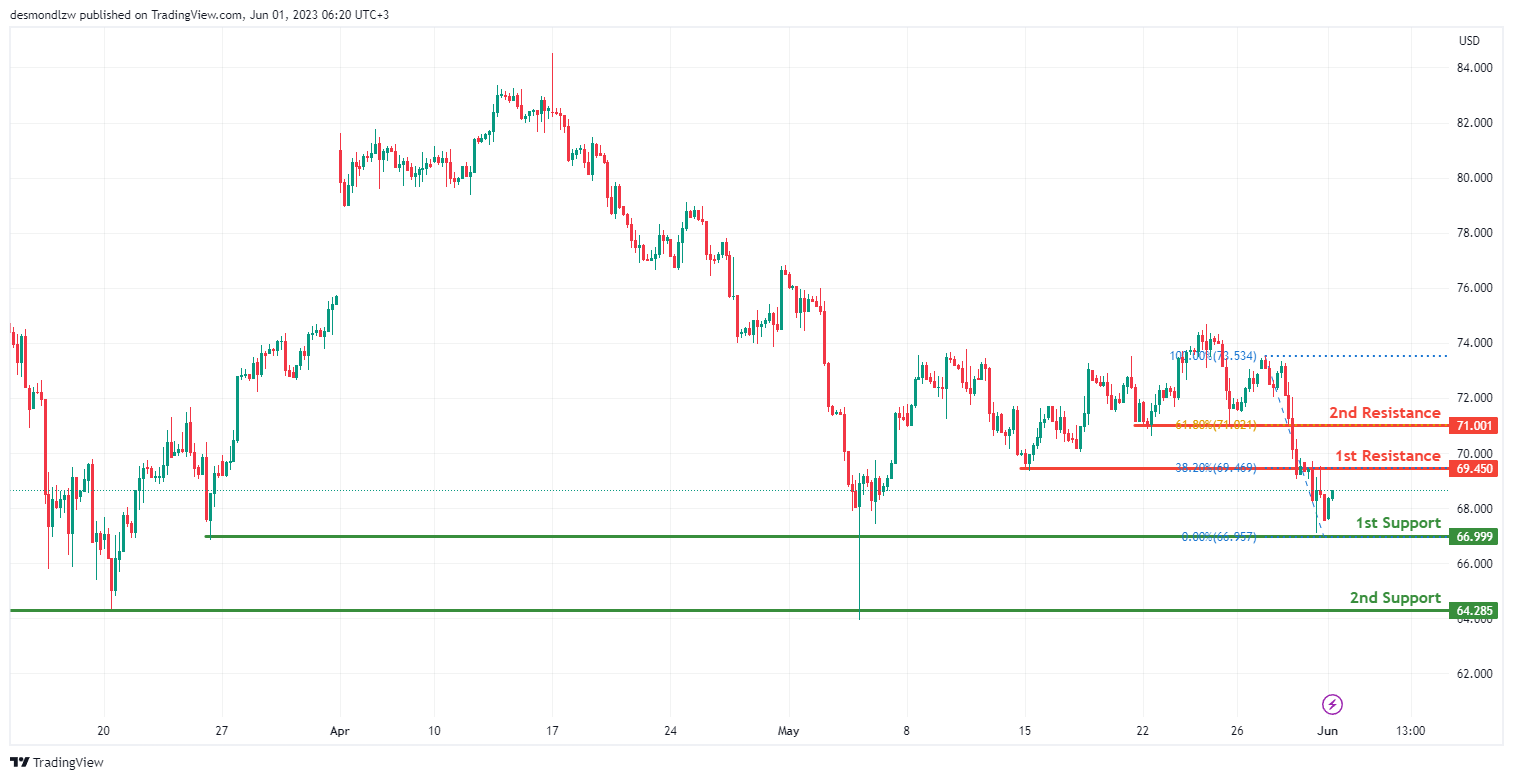
WTI/USD:
The WTI (West Texas Intermediate) chart currently exhibits a bullish momentum, indicating a potential continuation of the upward trend.
Considering this bullish momentum, it is possible that the price could experience a bullish continuation towards the first resistance level.
The first support level at 66.99 represents a multi-swing low support, highlighting its significance as a potential support area. Additionally, the second support level at 64.28 is also identified as a multi-swing low support, further reinforcing its importance.
On the upside, the first resistance level at 69.45 represents an overlap resistance. This level may act as a temporary barrier to further upward price movements. Moreover, the second resistance level at 71.00 is identified as a pullback resistance and aligns with the 61.80% Fibonacci retracement, providing additional credibility to its role as a potential resistance level.
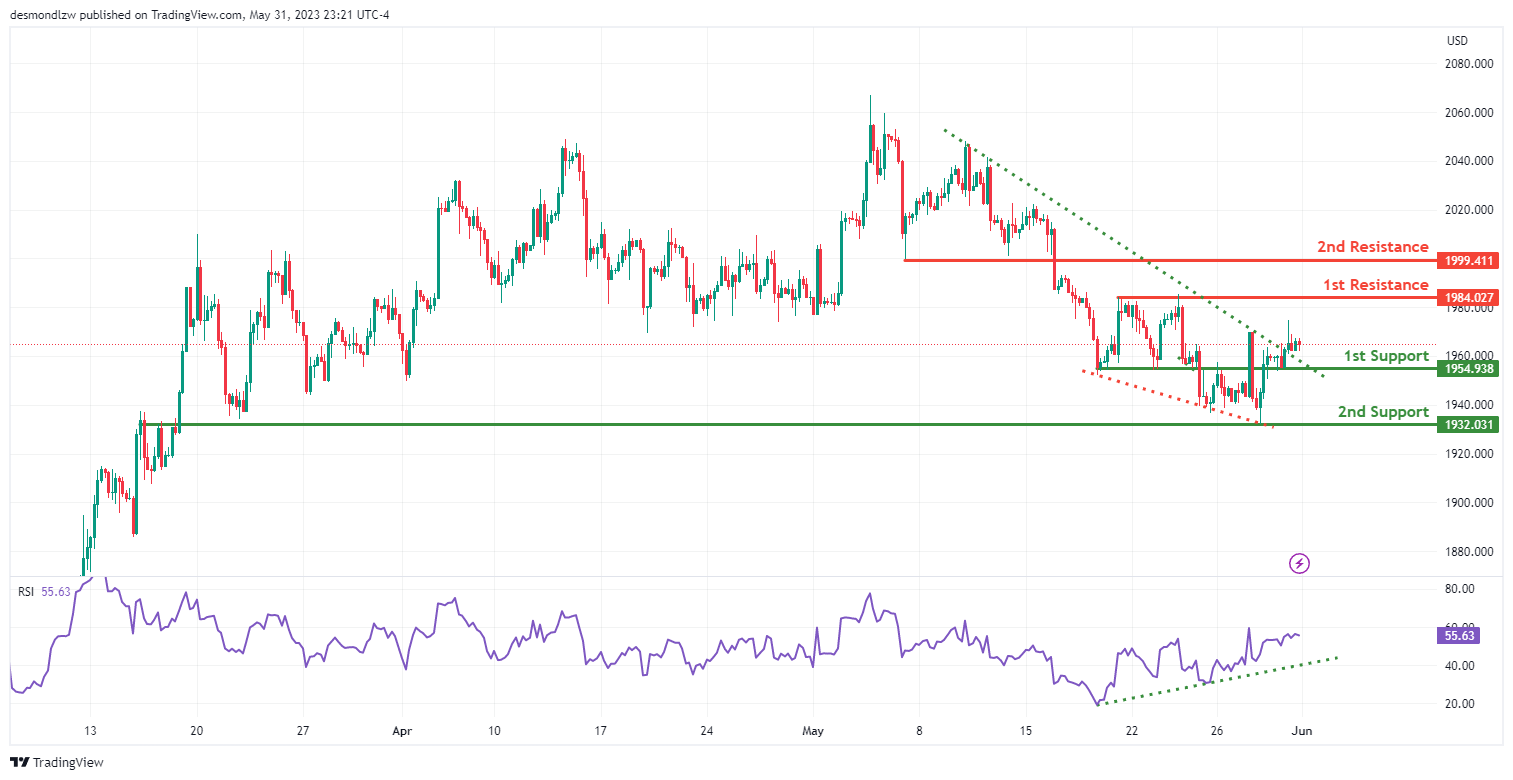
XAU/USD (GOLD):
The XAU/USD (Gold/US Dollar) chart currently shows a bullish momentum, indicating a potential continuation of the upward trend.
Despite the presence of a major descending trend line, suggesting possible bearish momentum, the overall bullish momentum in the chart suggests a potential bullish continuation towards the first resistance level.
The first support level at 1954.93 is identified as an overlap support, indicating historical significance as a price level where buyers have previously entered the market. Similarly, the second support level at 1932.03 is also an overlap support, further strengthening its importance as a potential support area.
On the upside, the first resistance level at 1984.02 represents a multi-swing high resistance and aligns with the 38.20% Fibonacci retracement. This level may act as a temporary barrier to further upward price movements. Additionally, the second resistance level at 1000.61 is identified as a pullback resistance and coincides with the 61.80% Fibonacci retracement, further supporting its significance as a potential resistance level.
Furthermore, the RSI (Relative Strength Index) displaying bullish divergence versus price suggests a potential rapid incline in price, further supporting the bullish momentum.
The accuracy, completeness and timeliness of the information contained on this site cannot be guaranteed. IC Markets does not warranty, guarantee or make any representations, or assume any liability regarding financial results based on the use of the information in the site.
News, views, opinions, recommendations and other information obtained from sources outside of www.icmarkets.com, used in this site are believed to be reliable, but we cannot guarantee their accuracy or completeness. All such information is subject to change at any time without notice. IC Markets assumes no responsibility for the content of any linked site.
The fact that such links may exist does not indicate approval or endorsement of any material contained on any linked site. IC Markets is not liable for any harm caused by the transmission, through accessing the services or information on this site, of a computer virus, or other computer code or programming device that might be used to access, delete, damage, disable, disrupt or otherwise impede in any manner, the operation of the site or of any user’s software, hardware, data or property.


