
Key risk events today:
Australia Employment Change and Unemployment Rate; BoJ Monetary Policy Statement; BoJ Press Conference; SNB Monetary Policy Assessment and Policy Rate; UK Retail Sales m/m; MPC Official Bank Rate Votes; BoE Monetary Policy Summary; BoE Official Bank Rate; BoE Asset Purchase Facility; Philly Fed Manufacturing Index.
EUR/USD:
The Federal Reserve, as expected, cut rates by 25bps to 1.75-2.00% Wednesday. The decision saw hawkish opposition from Rosengren and George, while Bullard made the case for a 50bps rate cut. During his presser, Fed’s Powell suggested the rate cut was a continuation of the insurance rate cuts. Powell also retained an upbeat view of the economy, stating the baseline scenario was still positive.
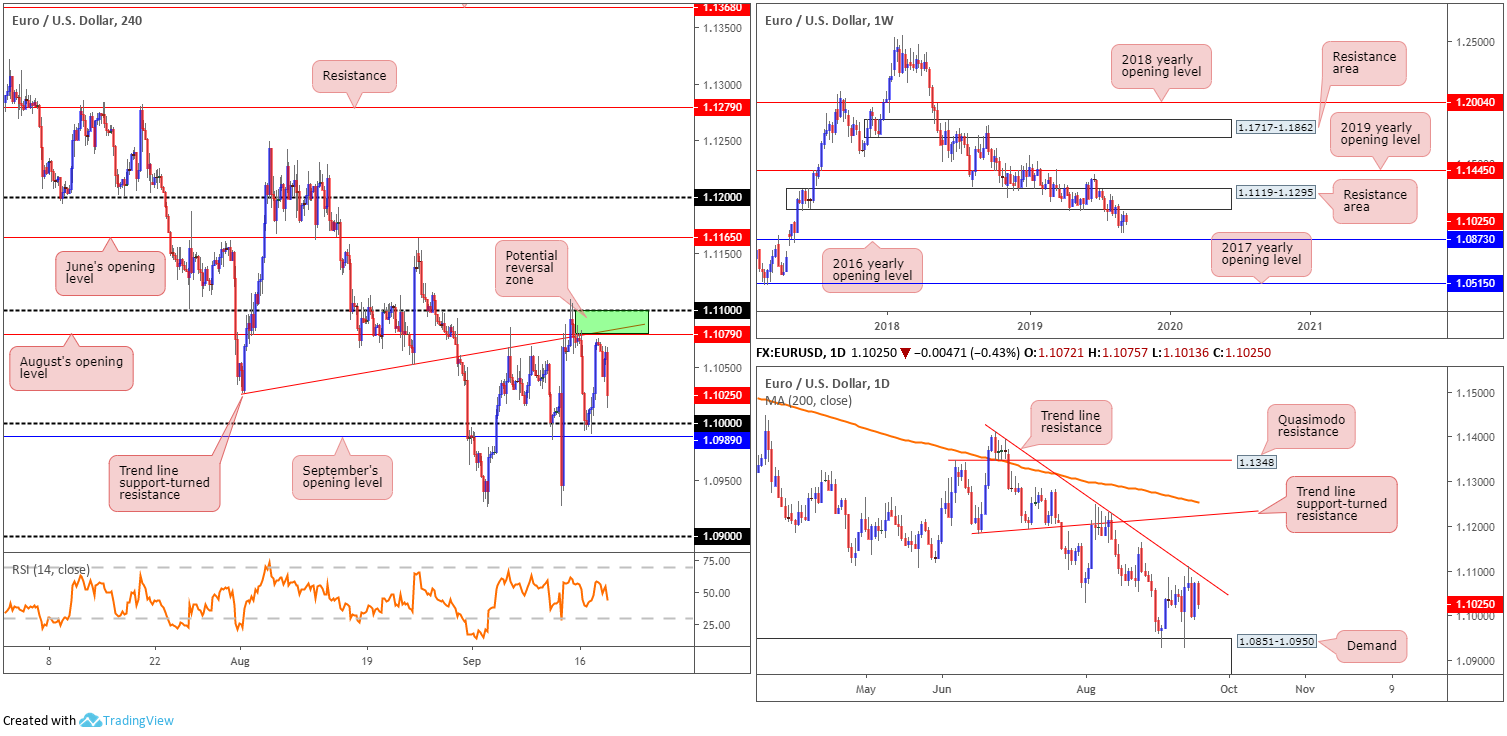
The EUR/USD bottomed during Powell’s press conference at 1.1013, consequently paring a portion of recent losses. The next port of call in terms of support remains set at the key figure 1.10 on the H4 timeframe, closely trailed by September’s opening level priced in at 1.0989. To the upside, August’s opening level resides at 1.1079 (resistance), which happens to intersect closely with a familiar trend line support-turned resistance (extended from the low 1.1032). Resistance beyond here falls in at the 1.11 handle, followed by June’s opening level at 1.1165. RSI momentum crossed beneath its 50.0 value thanks to yesterday’s decline.
Higher-timeframe structure has weekly price languishing south of a demand-turned resistance area at 1.1119-1.1295, with the 2016 yearly opening level at 1.0873 set as the next support target. Concerning overall trend direction, since topping in early 2018 at 1.2555, the long-term trend remains pointing in a southerly bearing. According to daily structure, the unit turned south ahead of trend line resistance taken from the high 1.1412, poised to possibly revisit demand coming in at 1.0851-1.0950 (area holds the 2016 yearly opening level within its lower boundary).
Areas of consideration:
Outlook unchanged.
The green zone on the H4 timeframe between the 1.11 handle, trend line support-turned resistance and August’s opening level at 1.1079 remains a likely area of interest for possible shorting opportunities. In addition to this, the current daily trend line resistance highlighted above merges closely with the said H4 zone. For those looking to press this bearish theme, the research team recommends waiting for additional H4 candlestick structure to form before pulling the trigger for two reasons (entry/risk can be determined according to this pattern). Firstly, the top edge of the H4 zone, the round number 1.11, is prone to stop runs and could unnecessarily liquidate a position. Secondly, the underside of the weekly resistance area mentioned above at 1.1119-1.1295 is set just 20 points above 1.11, which could act as a magnet for price, therefore igniting a fakeout higher to run orders at 1.11.
Adding to the current outlook, 1.10 is likely a support on the radar for some traders today. This remains a chancy long, though, given both weekly and daily price suggest a move beyond here to at least daily demand carved from 1.0851-1.0950.
GBP/USD:
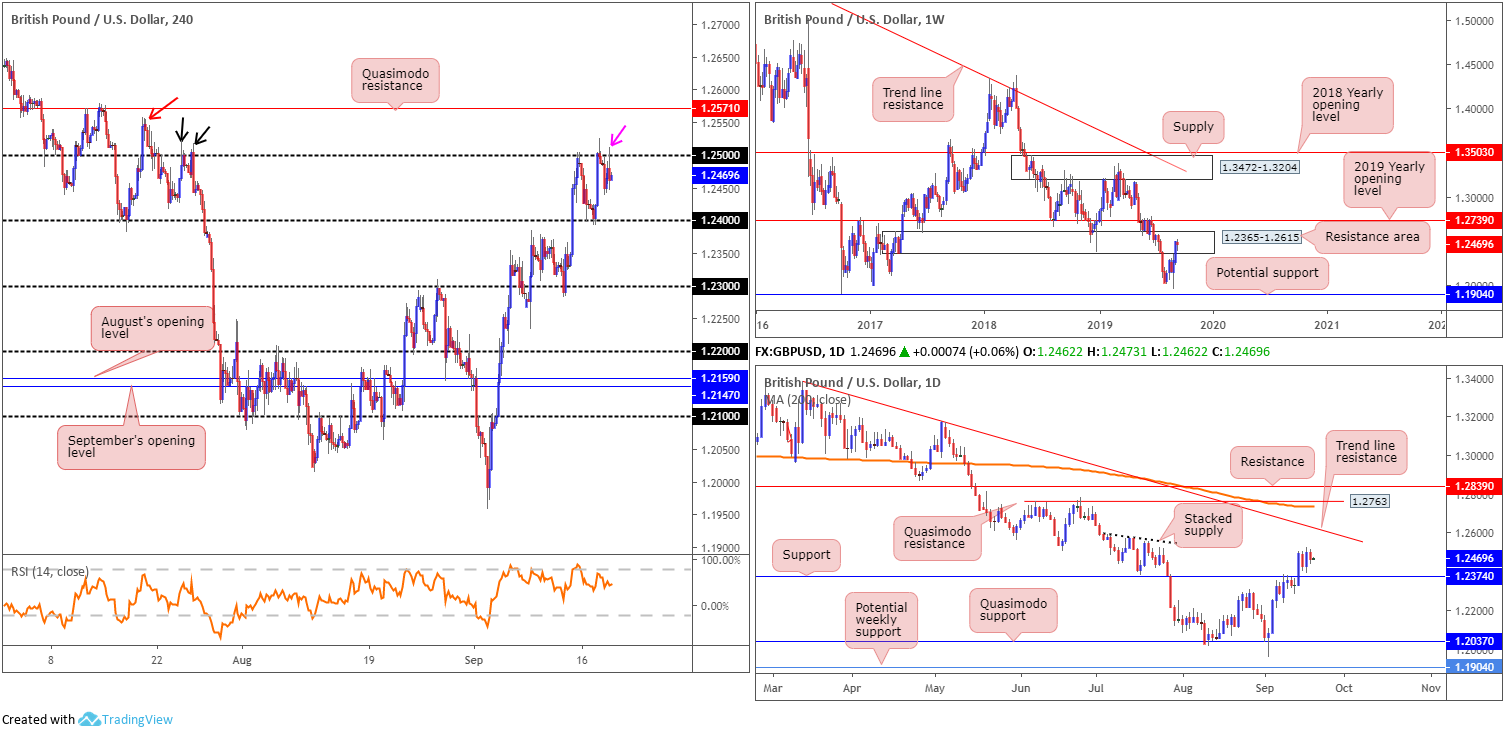
Wednesday had the British pound a shade lower against its US counterpart, weighed by less-than-stellar inflation data (headline, core and services all falling) and the Federal Reserve slashing rates by 25bps to 1.75-2.00%.
Technically, the H4 candles are contained by the 1.25 handle, capping upside on three separate occasions this month. With buy stops likely triggered above 1.25, this may eventually set the stage for a run towards Quasimodo resistance at 1.2571. Interestingly, as aired in Wednesday’s briefing, the high 1.2558 (red arrow), and the highs set beneath it (black arrows) at 1.2522ish, likely have buy stops plotted above. This may help provide liquidity to sell the said Quasimodo resistance.
Higher-timeframe analysis remains unchanged, with the following piece extracted from yesterday’s technical report:
Higher-timeframe structure on the weekly timeframe continues to toy with a long-term resistance area coming in at 1.2365-1.2615, though has so far failed to register much in the way of downside intent. Daily flow, on the other hand, has a stacked supply to the left, with a break of this structure unlocking the door to trend line resistance extended from the high 1.3380.
Areas of consideration:
With H4 activity recently chalking up a bearish outside setting off 1.25 (pink arrow), a run to 1.24 is certainly a possibility today. This is bolstered by weekly price contained within a large resistance area and daily candles testing an area of stacked supply (see above). Traders interested in the sell, basing entry and risk on the back of the H4 outside candle formation is an idea, targeting 1.24 as the initial port of call, followed by daily support at 1.2374.
In the event we overthrow 1.25, buying is possible, at least until reaching H4 Quasimodo resistance at 1.2571. For those who want to press this bullish scenario, waiting for a retest at 1.25 as support to develop is suggested (entry and risk can be found on the back of the rejecting candle’s structure).
Not only is the H4 Quasimodo an upside target, it is also considered a sell zone given it is located within the walls of the said weekly resistance area/stacked supply and has H4 liquidity pockets (set above highs on approach) below it in the form of buy stops to sell into.
AUD/USD:
The Australian dollar witnessed reasonably weighty downside in wake of the Federal Reserve’s hawkish cut Wednesday, placing the AUD/USD decisively south of August’s opening level at 0.6848 on the H4 timeframe. Demand marked at 0.6807-0.6824 is likely of interest to many traders this morning, formed on the break of 0.6822, a notable high to the left of current price. It might also interest some traders to note the current H4 demand holds a 38.2% Fibonacci ratio within at 0.6816.
What’s also interesting is higher-timeframe structure’s connection to the said H4 demand. Daily support comes in at 0.6833 and weekly support priced in at 0.6828, both sited just north of the demand area. Despite appealing confluence, traders are still urged to tread with caution. The round number 0.68 could act as a magnet to price and trip sell stops below the H4 demand.
Areas of consideration:
A long from the current H4 demand area is certainly worthy of consideration. Unfortunately, though, entering without additional candlestick confirmation (be it on the H1 or H4 – entry and risk can be determined according to this structure) opens one up to the possibility of being whipsawed out of a position on a fakeout to 0.68. As for upside targets, August’s opening level at 0.6848 is a logical starting block, with a break of this structure exposing tops set around 0.6884.
USD/JPY:
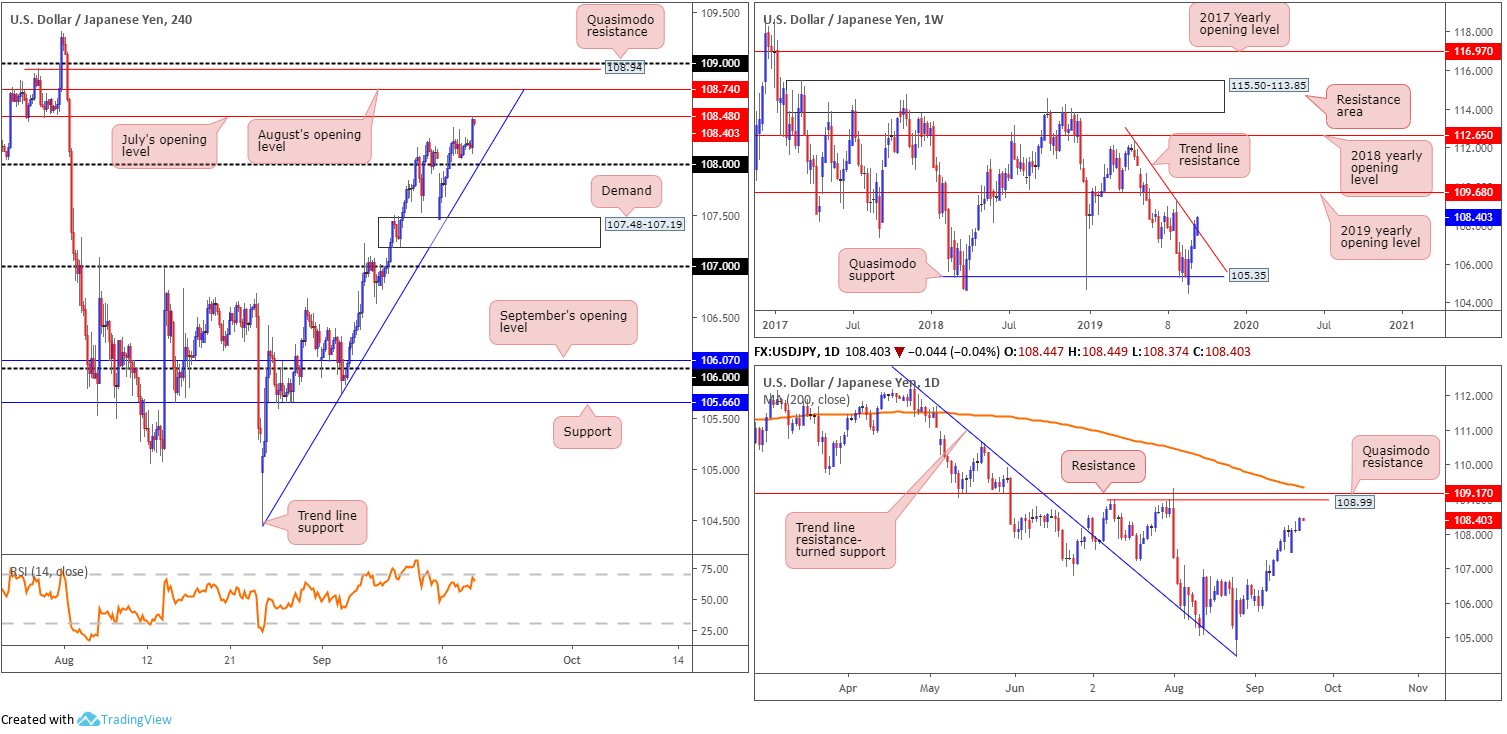
The Japanese yen traded relatively rangebound Wednesday, though the hawkish cut witnessed USD/JPY strength push the pair to seven-week highs, testing 108.50. Following the rate decision US yields rose, thus rate differentials also likely played a part.
Technical research has weekly price crossing trend line resistance extended from the high 112.40, following a healthy recovery off Quasimodo support at 105.35. Additional upside could see the 2019 yearly opening level at 109.68 enter the mix, though a reaction off the 109.31 high could also occur.
In conjunction with weekly direction, daily price also exhibits space to manoeuvre as far north as Quasimodo resistance plotted at 108.99, closely shadowed by resistance at 109.17 and the 200-day SMA closing in on the level (orange – currently stands at 109.34).
H4 flow, on the other hand, is challenging the underside of July’s opening level at 108.48, having formed a floor of support north of 108 and well and truly wiped out any remaining sellers attempting to fade the psychological mark. Beyond 108.48, August’s opening level at 108.74 is seen, followed by Quasimodo resistance at 108.94 and the round number 109.
Areas of consideration:
Having seen the next upside target on the higher timeframes not enter the fold until reaching 108.99, the Quasimodo resistance, further buying is likely in store. A retreat to the steep H4 trend line support (taken from the low 104.44) or even the 108 handle, therefore, may open the door for buying opportunities today.
The ultimate upside target is set at the H4 Quasimodo resistance drawn from 108.94/109 handle. Noting its connection with daily Quasimodo resistance at 108.99 and daily resistance at 109.17, the 109 region denotes a strong sell zone, with stops best sited above either the daily resistance or the 200-day SMA seen nearby, whichever is highest at the time of trade execution.
USD/CAD:
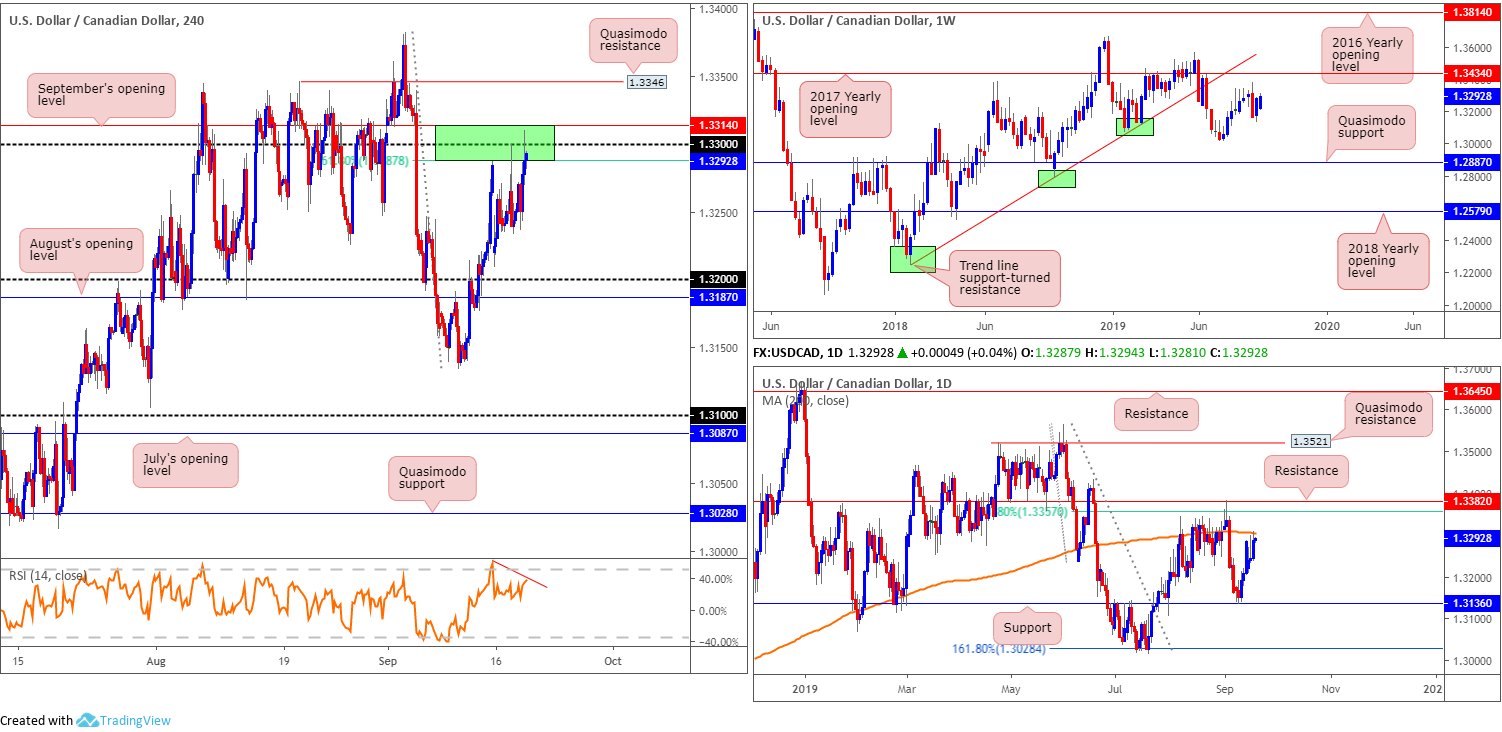
A follow-through pullback in WTI prices along with the US dollar exploring higher ground on the back of recent Fed movement: cutting rates by 25bps to 1.75-2.00%, provided fresh impetus to the USD/CAD market Wednesday. A portion of buy stops were likely filled above 1.33 in recent hours, though this is unlikely to attract many buyers into the market, given we still remain within the walls of a prominent sell zone (green) on the H4 timeframe: the area between September’s opening level at 1.3314, the round number 1.33 and the 61.8% Fibonacci ratio at 1.3287 (1.3314/1.3287). In addition to the H4 sell zone, the research team notes RSI movement currently chalking up negative divergence (red line) and daily price rejecting the 200-day SMA value at 1.3304 (orange).
Areas of consideration:
Although the H4 sell zone mentioned above at 1.3314/1.3287 is being tested a second time, a H4 bearish candlestick formation printed from here (entry/risk can be set according to this pattern) will likely be enough to entice sellers into the market, with an initial downside target set at the 1.32 handle.
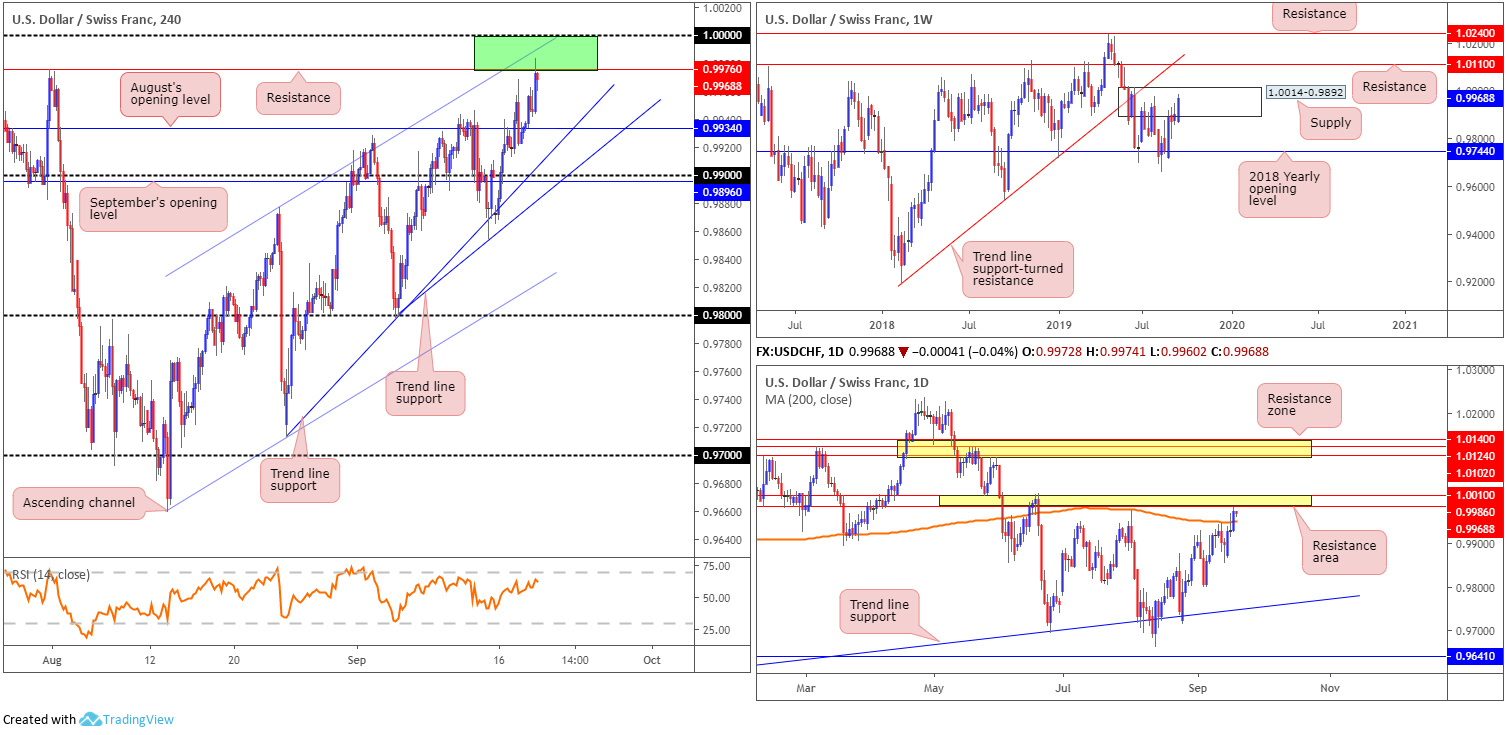
USD/CHF:
Kicking things off from the weekly timeframe, the research team notes price action driving higher into the parapets of supply coming in at 1.0014-0.9892. As underscored in Wednesday’s technical briefing, this is the second time back to the area, meaning it may struggle to hold price action lower. A rotation lower from here, nevertheless, has the 2018 yearly opening level at 0.9744 in sight. In the event buyers brush aside the said supply, resistance at 1.0110 is in view, as is long-term trend line support-turned resistance taken from the low 0.9187.
A closer reading of price action on the daily timeframe has the unit sited just north of its 200-day SMA (orange – 0.9744), though now faces immediate resistance at 1.0010/0.9986. A break beyond here could land the candles as far north as another resistance zone coming in between 1.0140/1.0102.
Across the page on the H4 timeframe, price action is seen rejecting resistance at 0.9976, a notable high formed at the end of July. Overhead, however, resistance resides close by in the form of a channel formation extended from the high 0.9877, followed by 1.0000 (parity).
Areas of consideration:
Although the immediate trend faces north, weekly price trades within supply at 1.0014-0.9892, albeit weakening somewhat, daily price recently crossed swords with a resistance area at 1.0010/0.9986 and H4 action carved a resistance area out of 1.0000/0.9976. Therefore, the idea going forward is to watch H4 action for signs of seller intent around the current H4 sell zone, preferably in the shape of a shooting star pattern or bearish engulfing formation. This helps avoid an unnecessary loss in the event of a whipsaw above 1.0000 (common viewing around psychological levels) and provides entry/risk levels to work with.
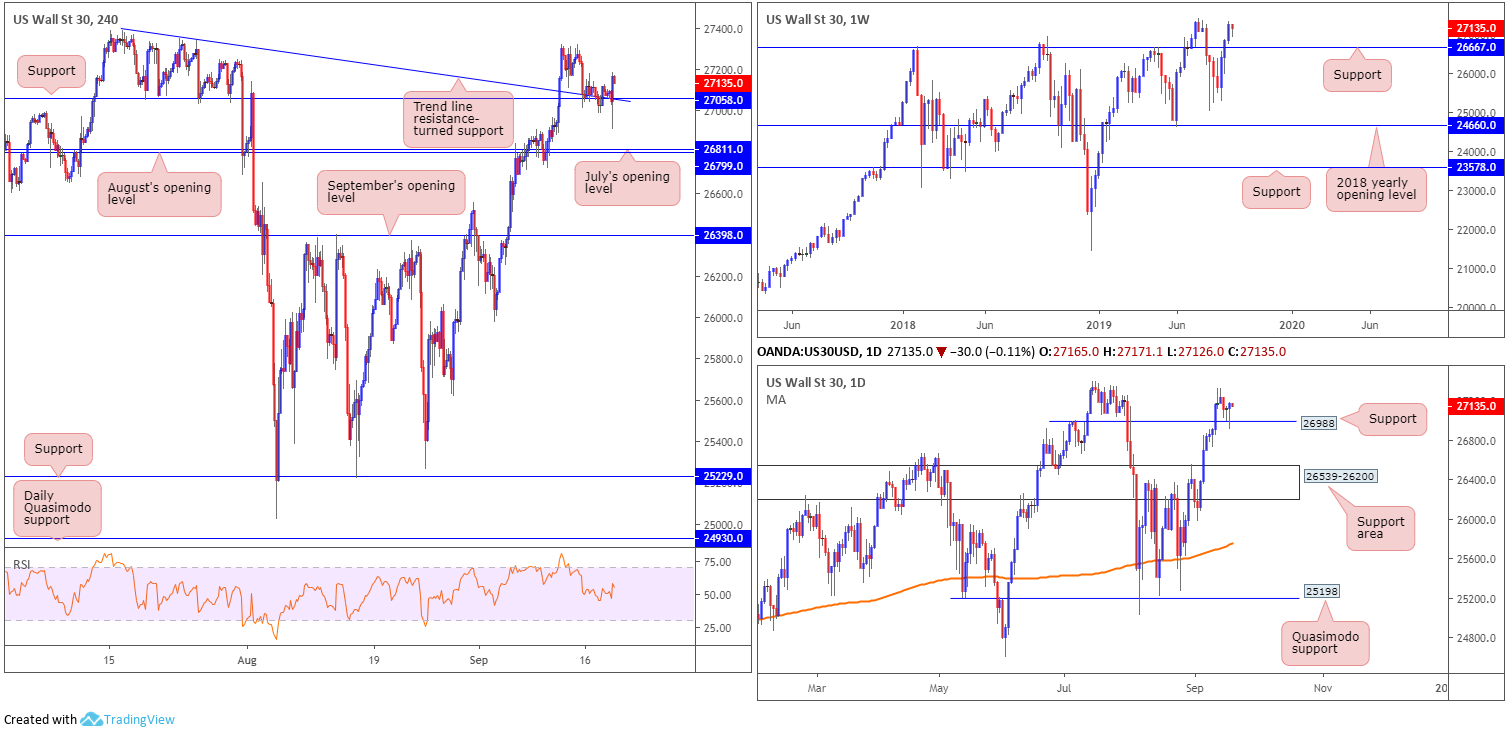
Dow Jones Industrial Average:
US equities clawed their way back into positive terrain Wednesday following the Federal Reserve’s decision to cut interest rates by 25bps, as the market digested remarks from Fed Chairman Powell and a more hawkish outlook than anticipated. The Dow Jones Industrial Average added 36.28 points, or 0.13%; the S&P 500 gained 1.03 points, or 0.03% while the tech-heavy Nasdaq 100 concluded flat.
A robust H4 bullish outside formation formed off support coming in at 27058 and a converging trend line resistance-turned support yesterday (taken from the all-time high 27388), engulfing several previous candles. By and of itself, buyers will potentially view this as a bullish indicator, targeting tops set around 27321, followed by the all-time high mentioned above at 27388.
On more of a broader perspective, weekly price holds strong north of support at 26667 and is currently sited a short walk from the all-time high 27388. Daily price, however, retested support at 26988 for a second time yesterday, forming back-to-back hammer candlestick formations, considered a bullish signal. Continued buying has the all-time highs as its next target.
Areas of consideration:
On account of the above, longs remain in favour. An entry at current price with a protective stop-loss order set below 26908 is an option, thanks to the recently closed H4 bullish candle off support at 27058, and connecting daily support registered at 26988. Upside targets, as underlined above, fall in around H4 tops at 27321, followed by the all-time high set at 27388.
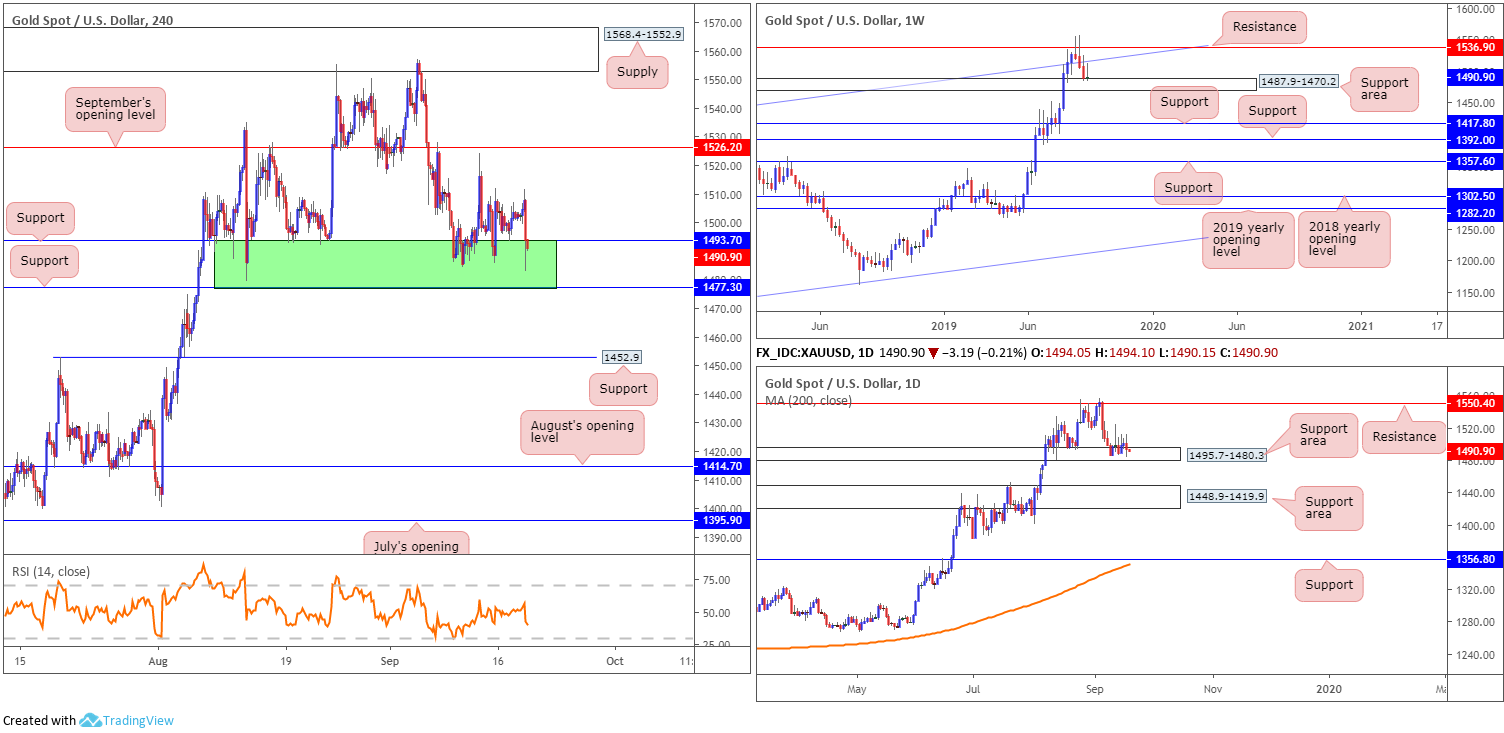
XAU/USD (GOLD):
Following the Federal Reserve’s decision to cut interest rates by 25bps, as the market digested remarks from Fed Chairman Powell and a more hawkish outlook than anticipated, the price of gold fell sharply vs. the buck Wednesday. Despite the decline, H4 support formed between 1477.3/1493.7 remains in the fight. Buyers, particularly on the H4 timeframe, likely still eye higher prices all the time the current support zone remains intact. A break of this area has support at 1452.9 to target.
Viewing price action from the higher timeframes, weekly price, following a three-week bearish phase off resistance at 1536.9, is still seen tackling a support area drawn from 1487.9-1470.2. By the same token on the daily timeframe, we can see price rejected resistance at 1550.4 and is shaking hands with a support area at 1495.7-1480.3 (glued to the top edge of the current weekly support area). Note yesterday’s action produced a bearish outside day candlestick pattern.
Areas of consideration:
Though it appears H4 action is likely to break through its H4 support area at 1477.3/1493.7, this remains an area of interest for possible buying opportunities today. Waiting for a strong H4 bullish candlestick formation to develop here is recommended before considering a position, signalling buyer intent and providing entry and risk levels to work with. The initial upside target falls in around tops set at 1512.3.
The accuracy, completeness and timeliness of the information contained on this site cannot be guaranteed. IC Markets does not warranty, guarantee or make any representations, or assume any liability regarding financial results based on the use of the information in the site.
News, views, opinions, recommendations and other information obtained from sources outside of www.icmarkets.com.au, used in this site are believed to be reliable, but we cannot guarantee their accuracy or completeness. All such information is subject to change at any time without notice. IC Markets assumes no responsibility for the content of any linked site.
The fact that such links may exist does not indicate approval or endorsement of any material contained on any linked site. IC Markets is not liable for any harm caused by the transmission, through accessing the services or information on this site, of a computer virus, or other computer code or programming device that might be used to access, delete, damage, disable, disrupt or otherwise impede in any manner, the operation of the site or of any user’s software, hardware, data or property.


