
Key risk events today:
Canada ADP Non-Farm Employment Change; Philly Fed Manufacturing Index; US Unemployment Claims; ECB President Lagarde to speak; US CB Leading Index m/m.
(Previous analysis as well as outside sources – italics).
EUR/USD:
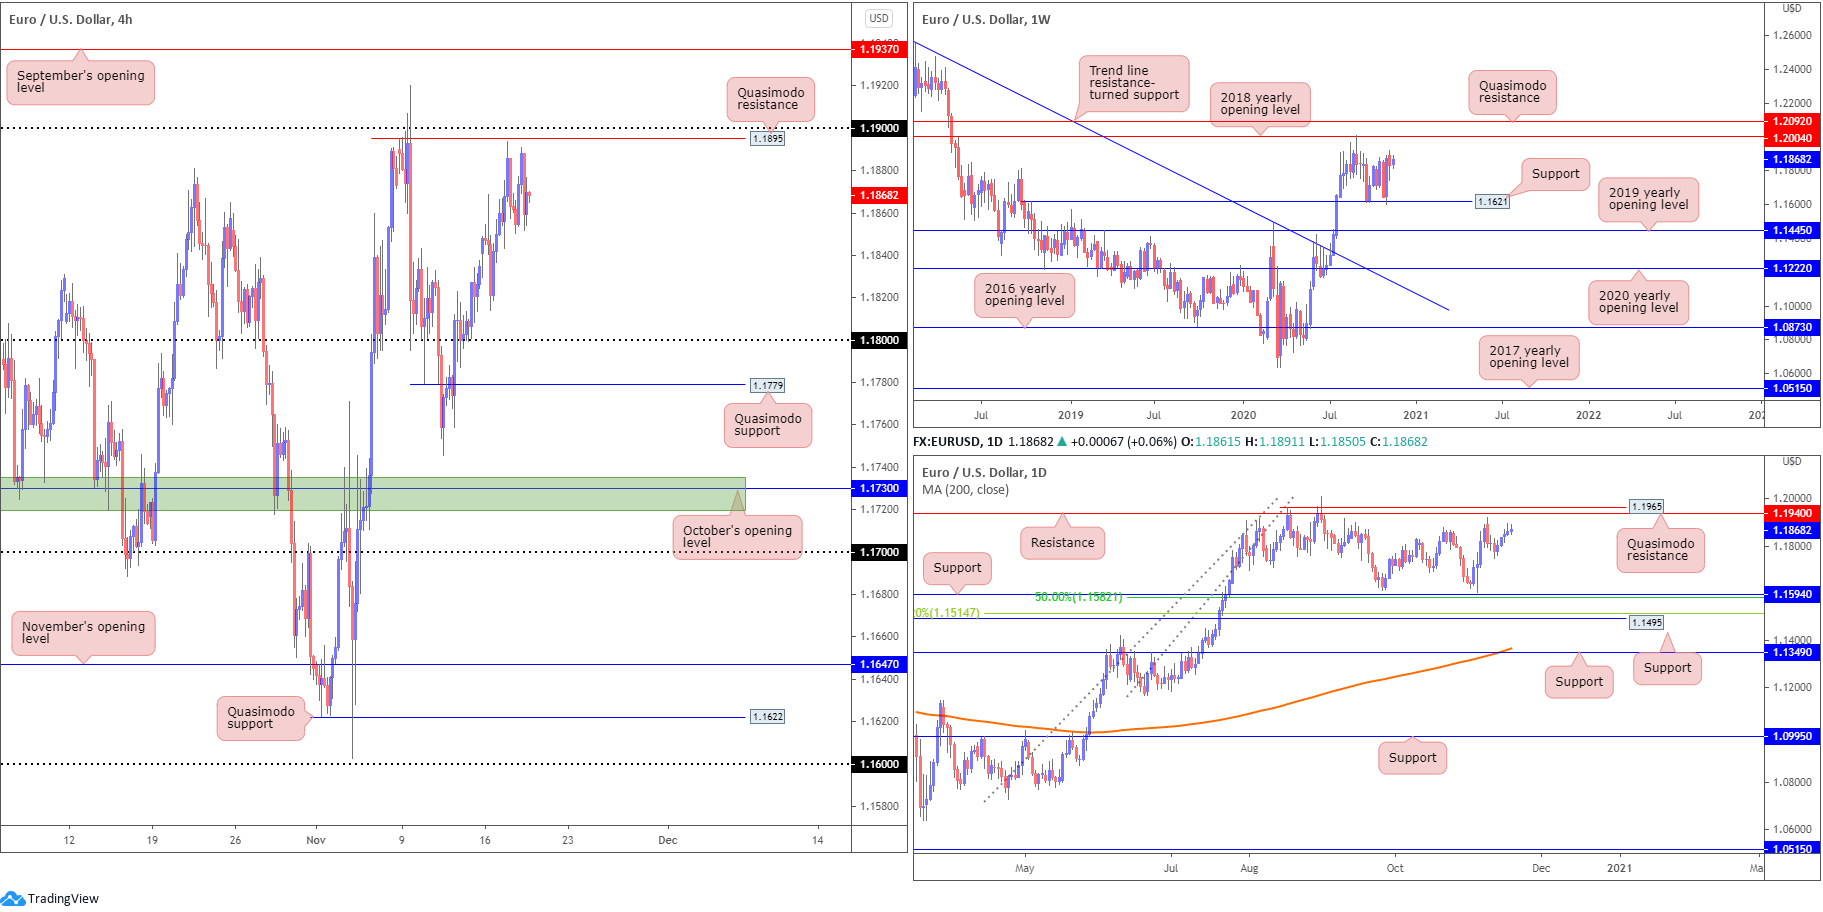
Overall, it was a somewhat muted session Wednesday, ranging between 1.1891/1.1850, despite the DXY elbowing in the direction of daily Quasimodo support coming in at 92.15.
Based on the H4 timeframe, the technical picture reveals resistance resides close by in the shape of a Quasimodo formation at 1.1895 and the 1.19 handle. Any sustained move beyond these levels potentially positions September’s opening value at 1.1937 in the spotlight, a level that converges closely with daily resistance at 1.1940, followed by daily Quasimodo resistance at 1.1965.
From the weekly timeframe, however, following healthy demand off support at 1.1621 early November, buyers appear poised to approach the 2018 yearly opening value from 1.2004, closely shadowed by Quasimodo resistance at 1.2092.
Note that the overall trend in this market appears north right now.
Areas of consideration:
- 19 and H4 Quasimodo resistance at 1.1895 may come forward today. Though this area will have pending sell orders, higher timeframe resistance is not observed.
- Breakout buying may form north of 1.19 on the H4, targeting September’s opening value at 1.1937.
- September’s opening value on the H4 and daily resistance at 1.1940 marks healthy confluence to work with if a breach of 1.19 occurs.
GBP/USD:
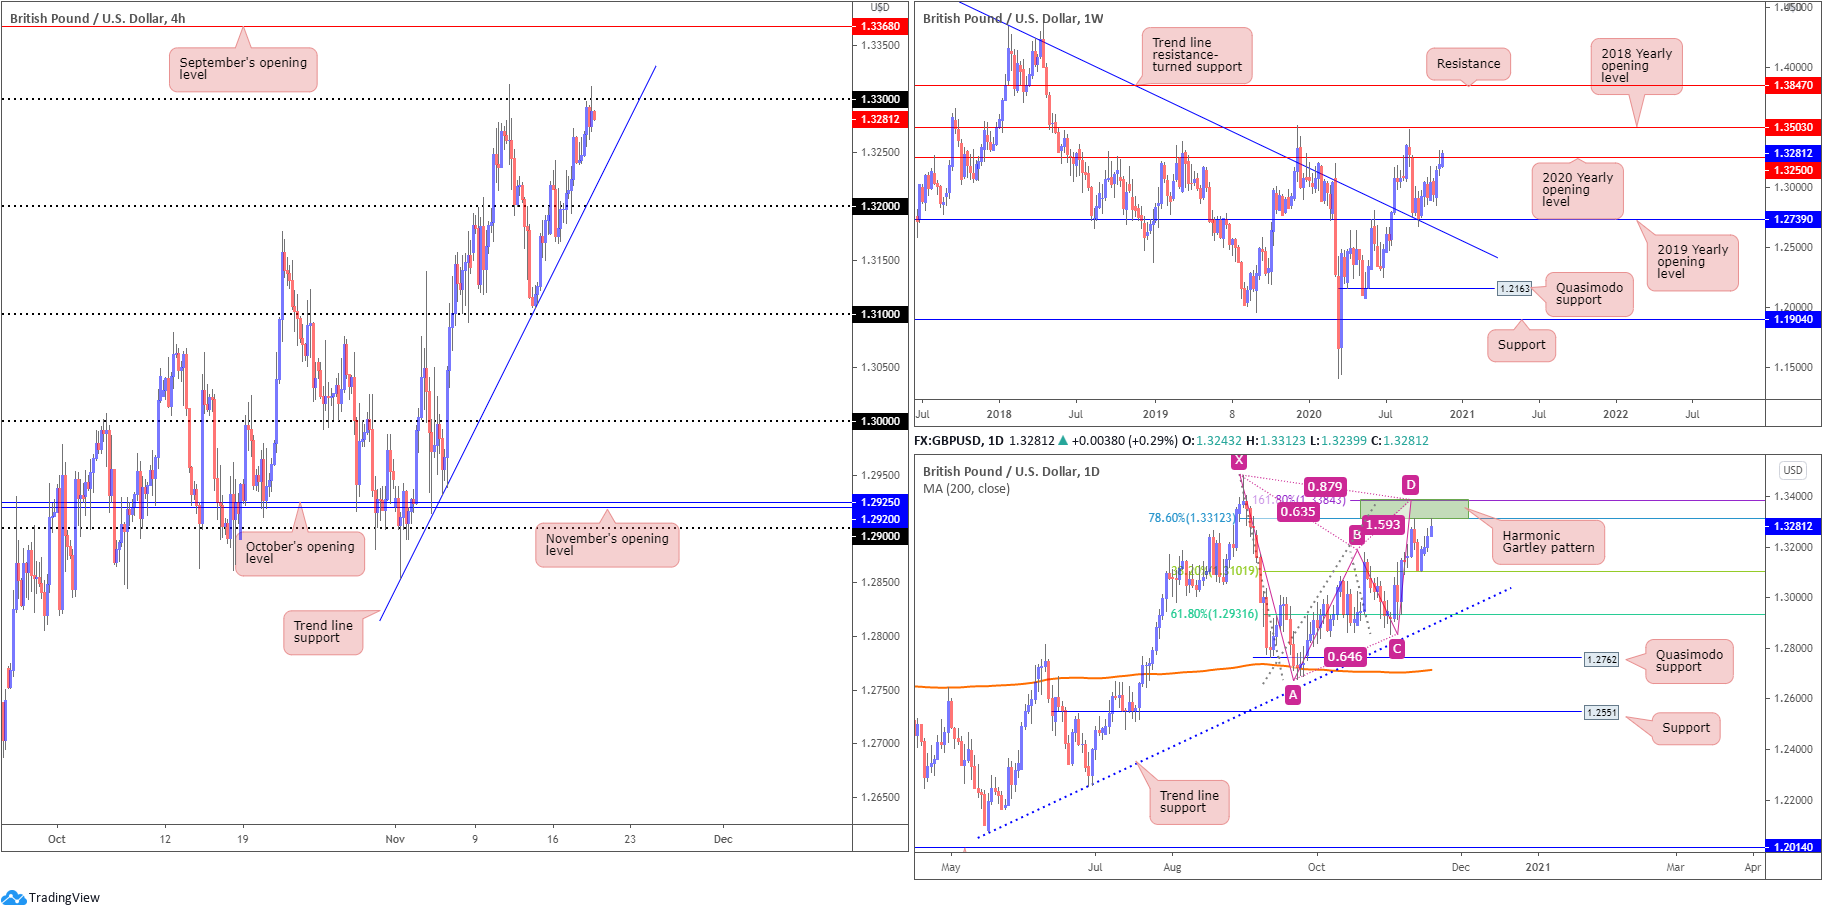
Underpinned amidst Brexit hopes, the British pound inscribed a fourth consecutive daily gain against a broadly softer greenback on Wednesday. This delivered H4 candles to the 1.33 handle, modestly fading highs at 1.3312. Rejecting this level today shines the spotlight on steep trend line support, extended from the low 1.2853, with a break exposing 1.32. Pursuing territory above 1.33, on the other hand, places September’s opening value at 1.3368 in the firing range.
The 2020 yearly opening value at 1.3250 is under attack on the weekly timeframe, with follow-through strength to potentially see the unit knock on the door of the 2018 yearly opening value from 1.3503. In line with resistance on the H4 timeframe at 1.33, however, daily price recently shook hands with a bearish harmonic Gartley pattern’s PRZ at 1.3384/1.3312, following a recovery just north of the 38.2% Fibonacci retracement ratio at 1.3101.
Areas of consideration:
- Sellers from 1.33 appear cautious. This could be due to weekly price attempting to overthrow the 2020 yearly opening value at 1.3250. Yet, supporting sellers, traders will acknowledge the recent reconnection with the daily bearish harmonic Gartley pattern’s PRZ at 1.3384/1.3312.
- While 1.33 on the H4 and the daily harmonic structure might be sufficient for some sellers to pull the trigger, more conservative players may seek a H4 close beyond trend line support (1.2853) before taking action.
AUD/USD:
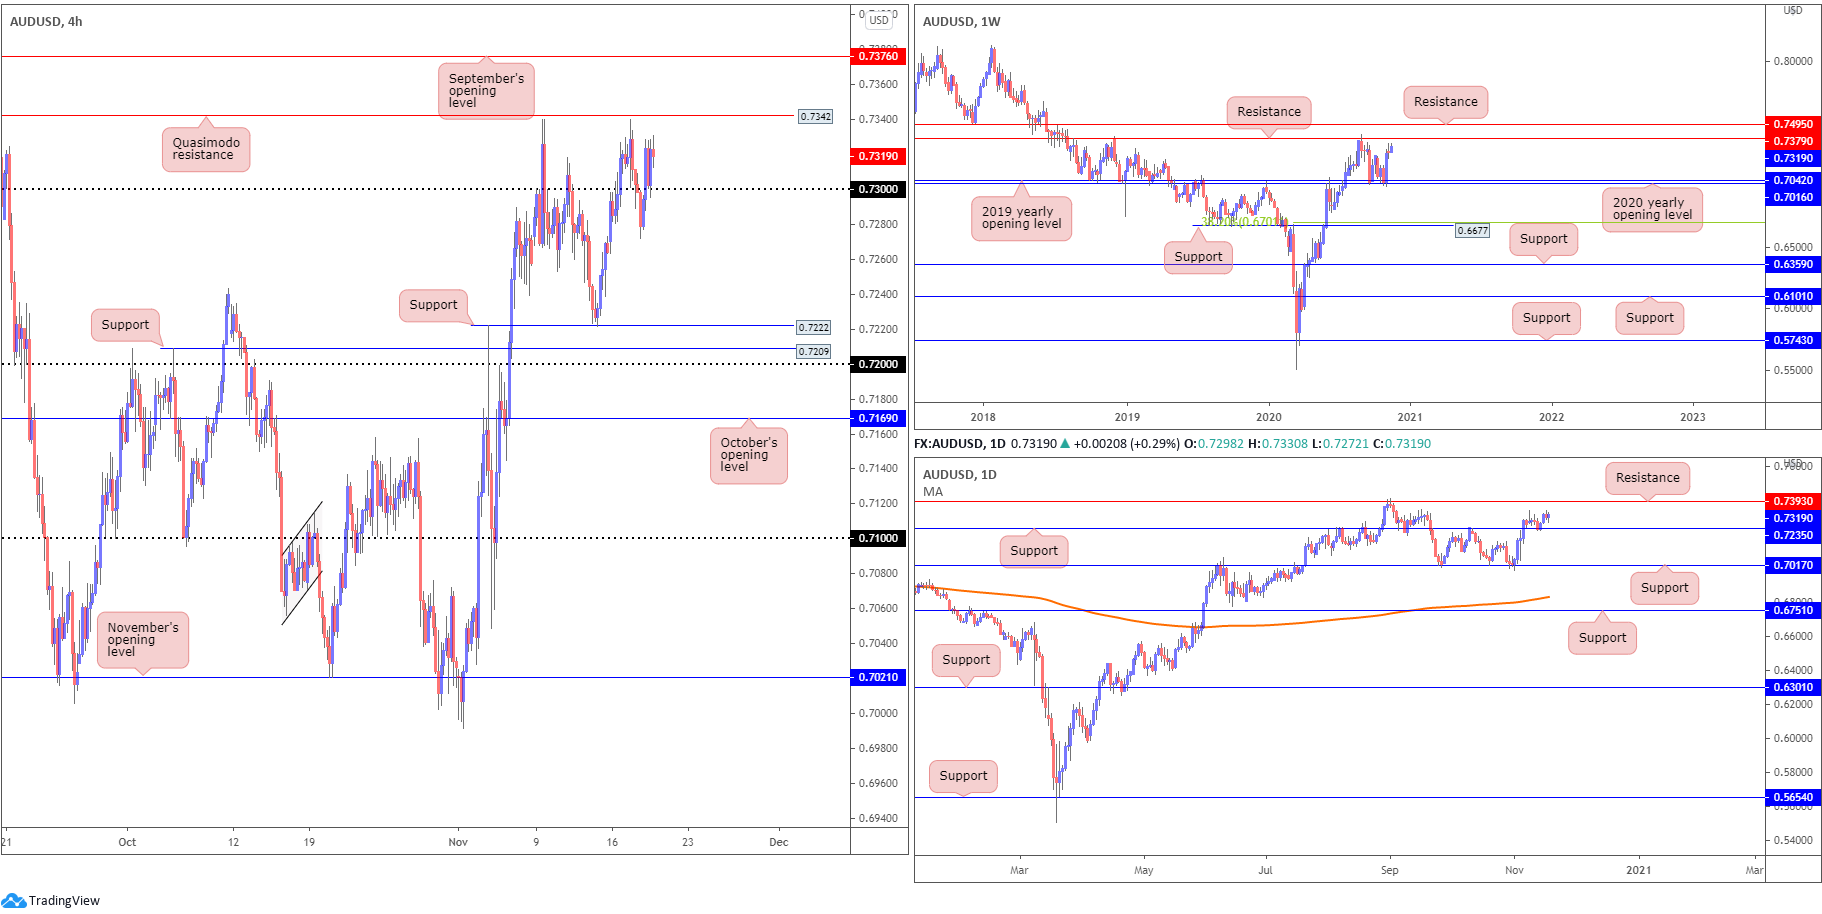
Despite deep moves south of the 0.73 handle on the H4 timeframe, AUD/USD managed to conclude Wednesday on the front foot and reclaim 0.73 on soft USD conditions. Quasimodo resistance at 0.7342 is seen as a possible upside target, in addition to September’s opening value at 0.7376.
From the weekly timeframe, the recent rebound off the 2020 (0.7016) and 2019 (0.7042) yearly opening values (supports) was extended in recent trading. In view of this market trending higher since early 2020, buyers may still have eyes for resistance priced in at 0.7379, and neighbouring resistance at 0.7495.
The possibility of additional bullish flow is reinforced by the retest of support from 0.7235 last week on the daily timeframe. This could sweet-talk buyers to attempt to take a run at resistance from 0.7393 (positioned above weekly resistance).
Areas of consideration:
- The retest at 0.73 on the H4 has so far impressed buyers. Weekly and daily timeframes pointing to a push towards at least weekly resistance at 0.7379 could see buyers extend recent gains through H4 Quasimodo resistance at 0.7342 to September’s opening value at 0.7376 (connects with weekly resistance).
- Longer-term resistance to be aware of falls in between weekly resistance at 0.7379 and daily resistance from 0.7393.
USD/JPY:
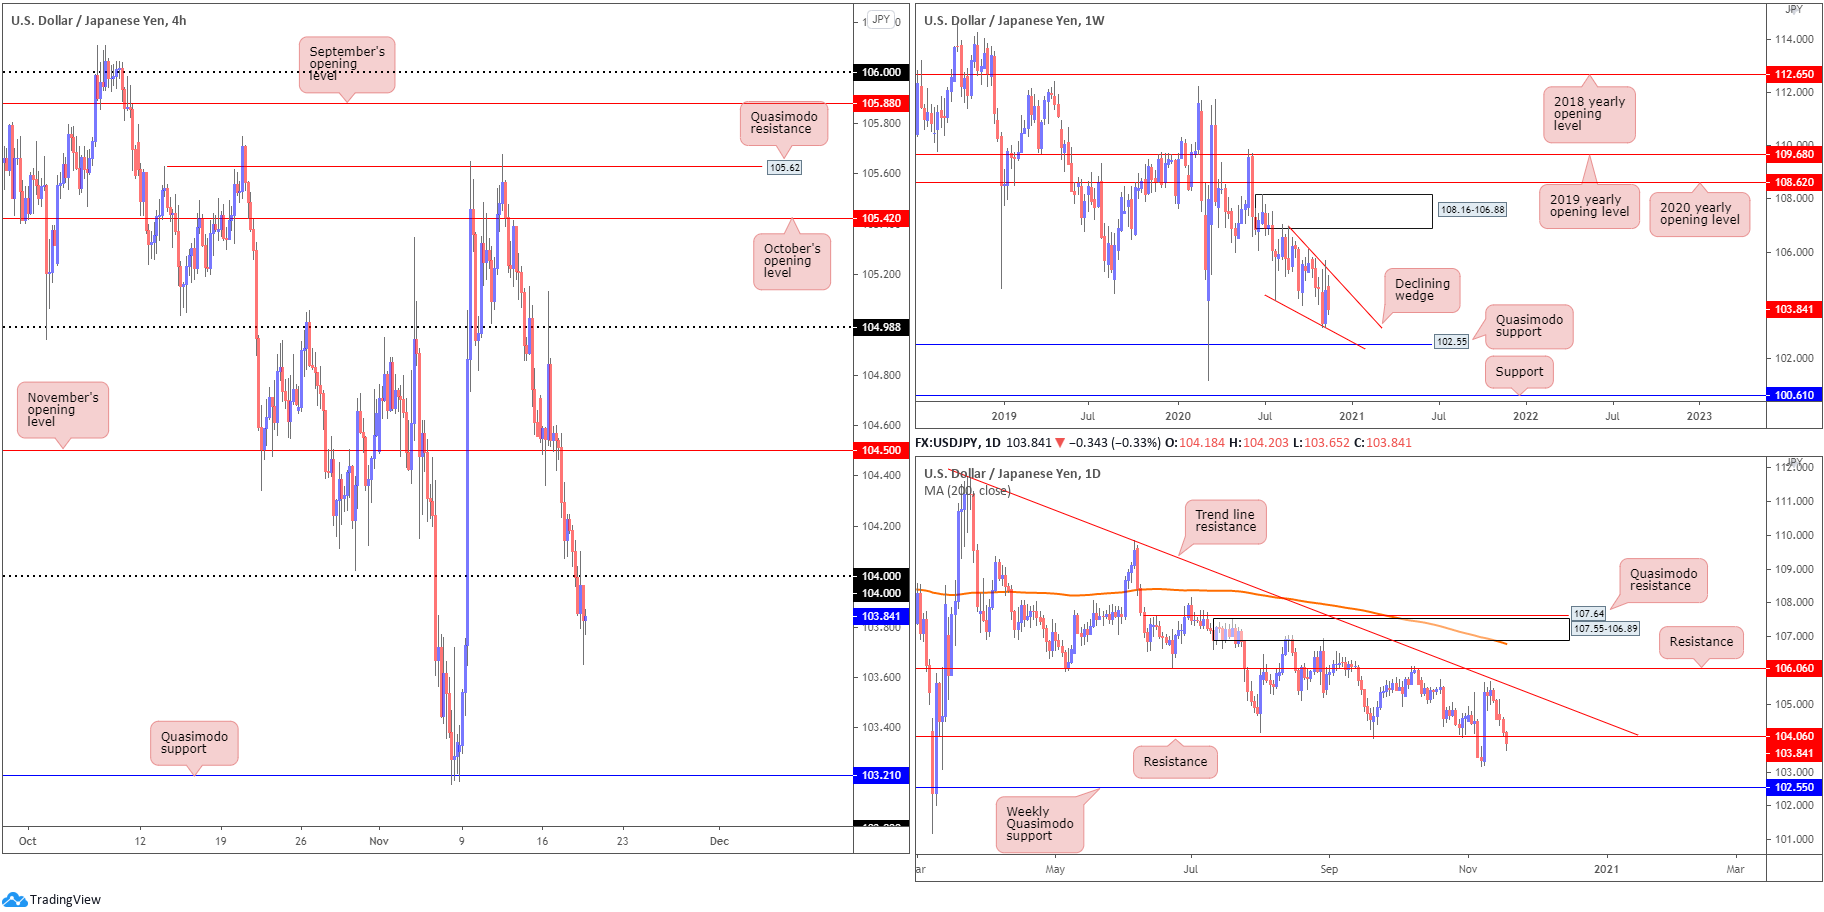
USD/JPY continued to navigate lower terrain Wednesday, chalking up a fifth consecutive daily bearish close. As evident from the H4 timeframe, bids took a hammering at 104 with price swiftly returning to the round number to collect any unfilled sell orders. With 104 representing resistance, moves to Quasimodo support at 103.21 will likely be eyed by sellers today.
The bearish landscape on the H4 timeframe is also echoed on the daily chart, following Wednesday’s break of support at 104.06. Burrowing through this level is interesting, shining the headlights on weekly Quasimodo support at 102.55.
From the weekly timeframe, since reconnecting with the underside of supply at 108.16-106.88 in August, weekly candles have slowly grinded lower, forming a declining wedge (106.94/104.18). Quasimodo support mentioned above at 102.55 is in view, with a break exposing support plotted at 100.61. A strong bounce from 102.55 may provide enough impetus for buyers to attempt a breakout above the current declining wedge.
Areas of consideration:
- Bearish scenarios south of 104 are likely on the watchlists today, with some sellers possibly already short the 104 retest. H4 Quasimodo support at 103.21 calls for attention as an initial target, according to chart structure.
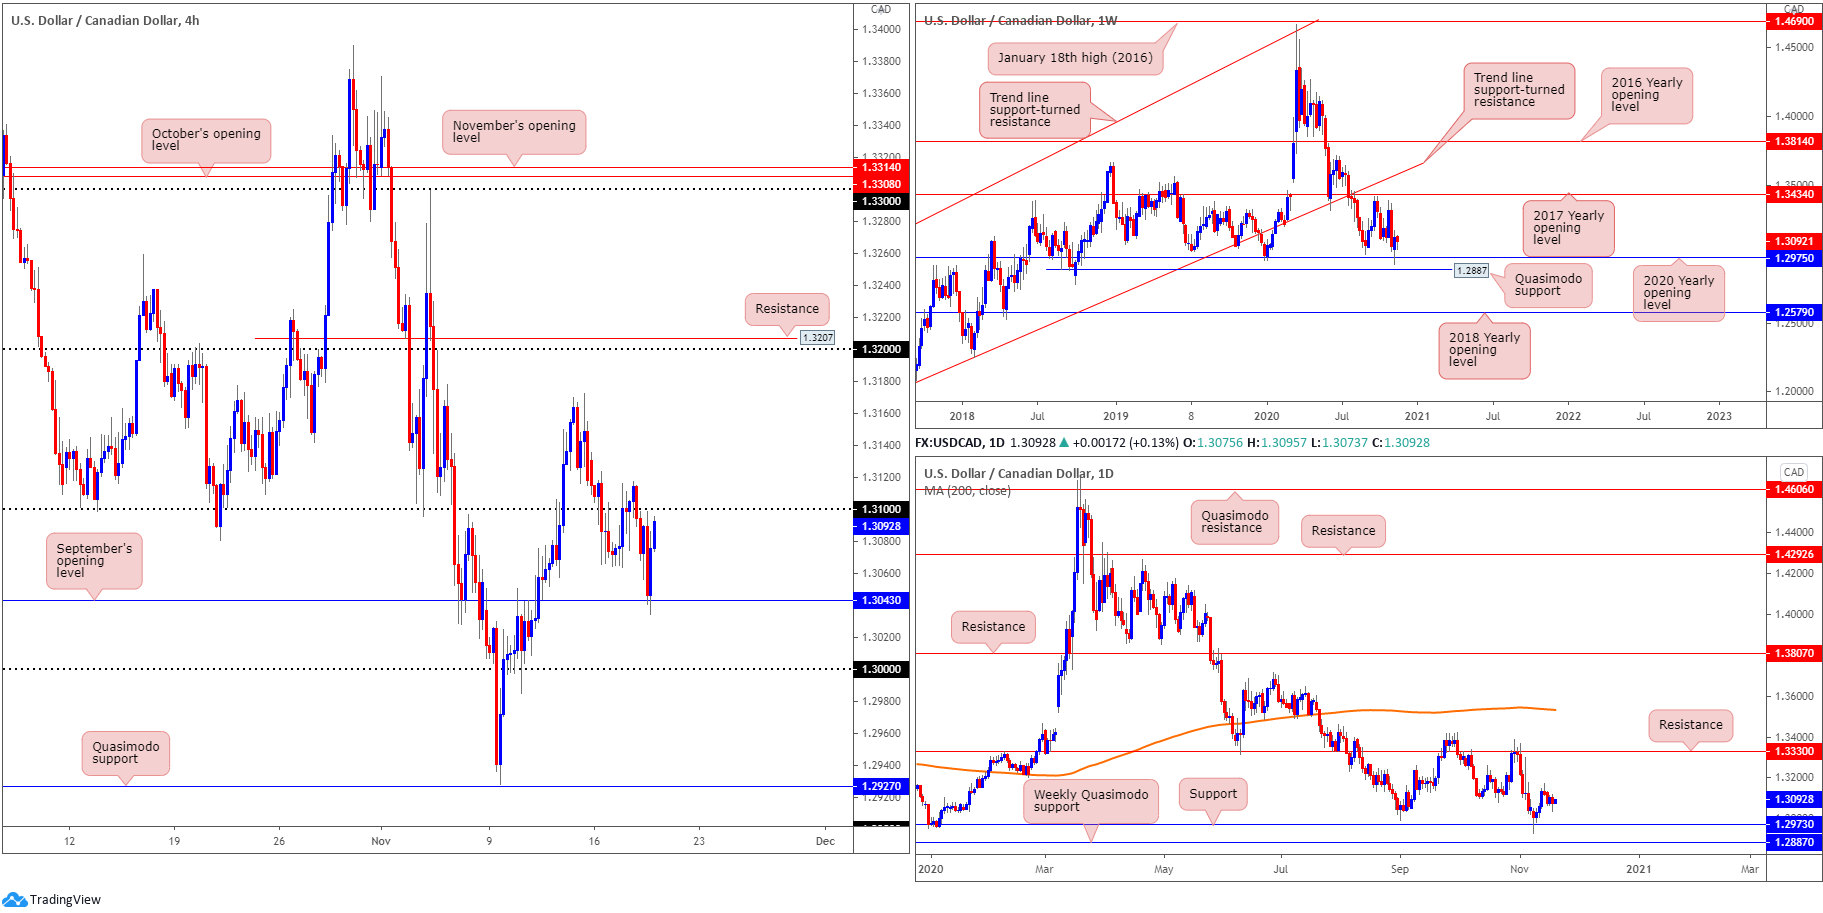
USD/CAD:
Early hours Wednesday attempted to find acceptance north of 1.31 on the H4 scale, yet swiftly failed and delivered a bearish assault throughout the European morning session. Following a rapid (near) retest at 1.31 (seen clearer on the H1), US hours dropped to test the mettle of September’s opening value at 1.3043, which has served well as support early this morning.
The 2020 yearly opening value at 1.2975 on the weekly timeframe, arranged north of a Quasimodo support priced in at 1.2887, triggered a wave of buying last week, closing modestly off best levels. Given this market has traded lower since topping at 1.4667 in early 2020, breaking the aforementioned supports also remains an option, consequently swinging the pendulum in favour of further weakness towards the 2018 yearly opening value at 1.2579. Additional interest to the upside, nevertheless, could eventually fuel a test of the 2017 yearly opening value at 1.3434, covered under trend line support-turned resistance, taken from the low 1.2061.
With weekly price rebounding from support at 1.2975 as well as daily price also recently coming off support at 1.2973 (essentially marking the same area), flow on the daily chart reveals room to rally as far north as 1.3330.
Areas of consideration:
- A H4 close north of 1.31 may interest breakout buyers. Reinforced on the back of higher timeframe supports, buyers may look to lift the pair towards the 1.3172 November 13 high, followed by 1.32. Conservative traders may seek a 1.31 retest before pulling the trigger.
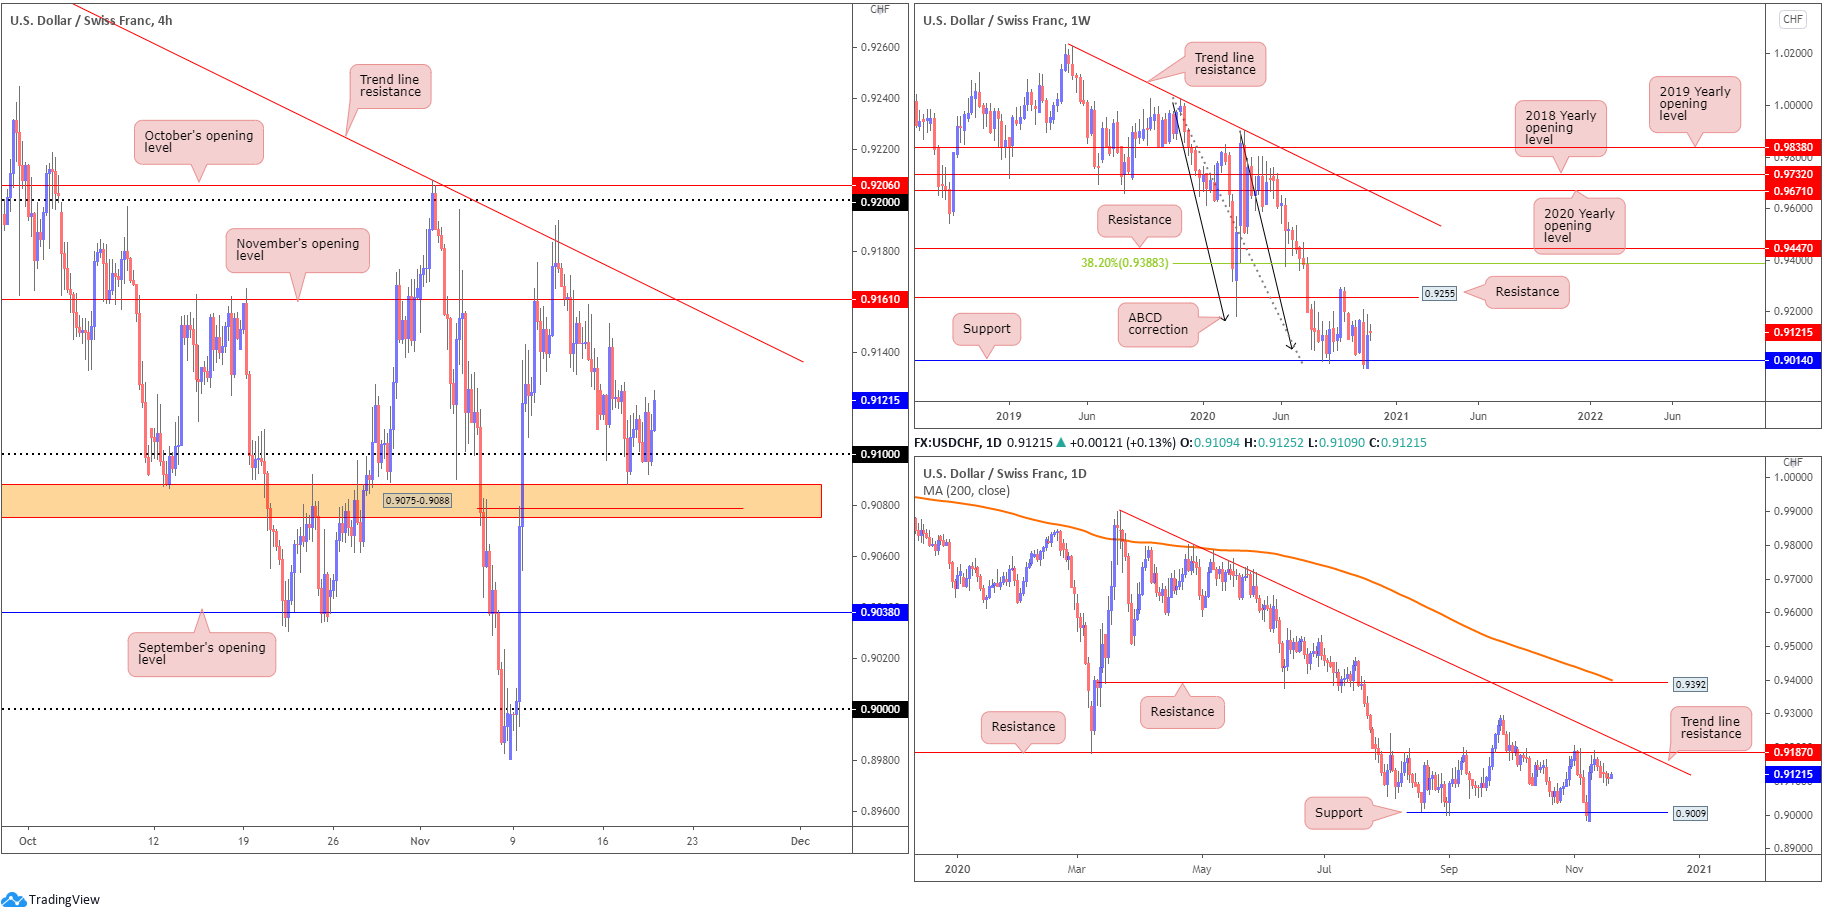
USD/CHF:
Following a whipsaw through 0.91 on the H4 into an area of support at 0.9075-0.9088, buyers are seen making headway north of 0.91 in early trading this morning. With upside reasonably clear (supply appears consumed) until reaching trend line resistance, taken from the high 0.9295, and November’s opening value at 0.9161, buyers may strive to address higher levels today.
The weekly timeframe reveals buyers entered a reasonably heavy bid off support at 0.9014 last week, a level dovetailing closely with ABCD support at 0.9051 (black arrows). 0.9255 resistance (a prior Quasimodo support) is next in the firing range should buyers continue to support this market, with a 38.2% Fibonacci retracement ratio forged at 0.9388 to target should further buying emerge (an initial take-profit target associated with the ABCD support mentioned above). It should also be noted that this market has been trending lower since April 2019.
From the daily timeframe, however, we are, following a decisive recovery off Quasimodo support at 0.9009, now grinding lower from resistance at 0.9187. Beyond the latter, assuming weekly players eventually push higher, traders may recognise nearby trend line resistance, taken from the high 0.9901, which happens to merge closely with weekly resistance mentioned above at 0.9255.
Areas of consideration:
- Traders long 0.91/H4 support at 0.9075-0.9088 (a noted area to watch for in Monday’s technical briefing) have likely reduced risk to breakeven. As stated above, upside appears reasonably resistance-free, therefore, buyers may, having seen where we’re coming from on the weekly timeframe, attempt to take charge and push for November’s opening value at 0.9161 on the H4.
- Weekly resistance at 0.9255 offers a longer-term ceiling, strengthened on the back of daily trend line resistance (0.9901).
The accuracy, completeness and timeliness of the information contained on this site cannot be guaranteed. IC Markets does not warranty, guarantee or make any representations, or assume any liability regarding financial results based on the use of the information in the site.
News, views, opinions, recommendations and other information obtained from sources outside of www.icmarkets.com.au, used in this site are believed to be reliable, but we cannot guarantee their accuracy or completeness. All such information is subject to change at any time without notice. IC Markets assumes no responsibility for the content of any linked site.
The fact that such links may exist does not indicate approval or endorsement of any material contained on any linked site. IC Markets is not liable for any harm caused by the transmission, through accessing the services or information on this site, of a computer virus, or other computer code or programming device that might be used to access, delete, damage, disable, disrupt or otherwise impede in any manner, the operation of the site or of any user’s software, hardware, data or property


