
Key risk events today:
Australia Employment Data; SNB Monetary Policy Assessment, Press Conference and Policy Rate; UK Asset Purchase Facility, MPC Asset Purchase Facility Votes, MPC Official Bank Rate Votes, Monetary Policy Summary and Official Bank Rate; Philly Fed Manufacturing Index; US Unemployment Claims; US CB Leading Index m/m.
(Previous analysis as well as outside sources – italics).
EUR/USD:
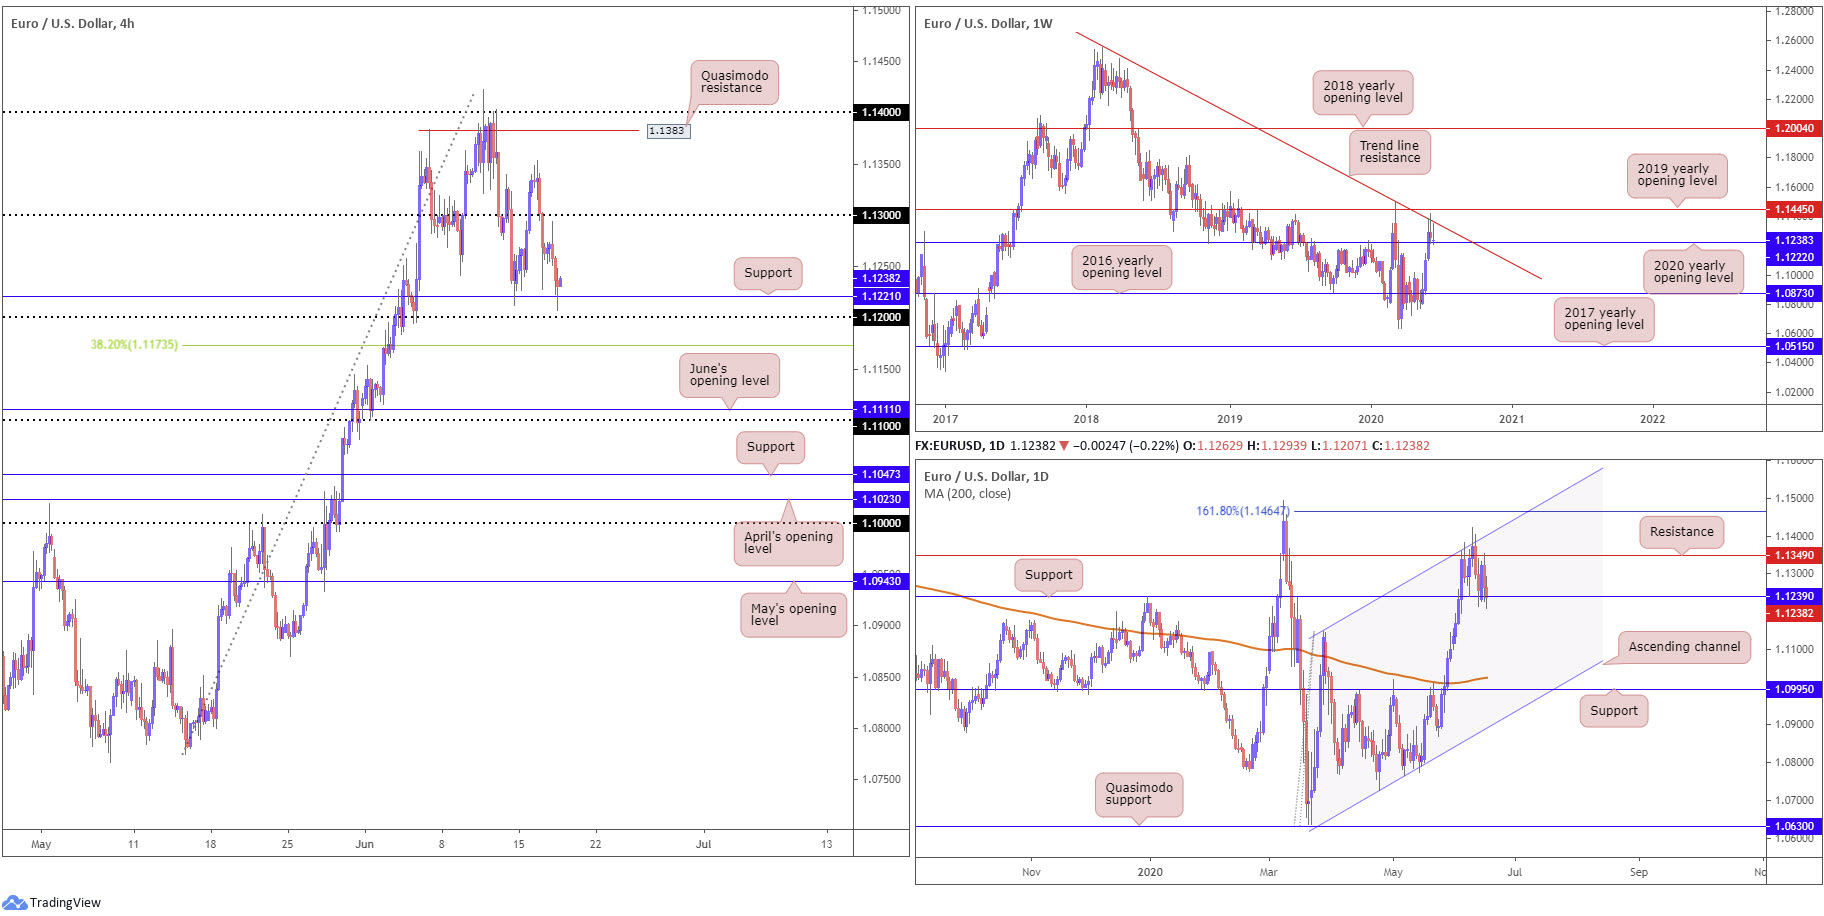
Although US housing data failed to meet consensus Wednesday, the US dollar index managed to maintain position north of the 97.00 handle. Leaving 1.13 unchallenged on the H4 timeframe, the candles dipped to support at 1.1221 (a prior Quasimodo resistance). This level joins closely with the 1.12 handle and a 38.2% Fibonacci retracement ratio at 1.1173.
Technical studies based on the weekly timeframe have buyers and sellers battling for position at the 2020 yearly opening level from 1.1222. Upside, as you can see, is capped by long-standing trend line resistance, extended from the high 1.2555. A strong bid could override the aforementioned trend line resistance for the 2019 yearly opening level at 1.1445, while beneath 1.1222 we have the 2016 yearly opening level at 1.0873 noted as support. In view of the long-term trend, the pair has remained under pressure since topping in early February 2018.
Buyers and sellers are also going toe to toe at support from 1.1239, after fading the underside of resistance at 1.1349. A break of this support would be quite significant, perhaps exposing downside to the 200-day SMA (orange – 1.1025), which is on the point of turning higher after drifting south for several months.
Areas of consideration:
For those who read Wednesday’s technical briefing you may recall the following (italics):
The combination of H4 support at 1.1221, the round number 1.12 and 38.2% Fibonacci retracement ratio at 1.1173 offers a frame to base some form of support today. This area also benefits from weekly convergence at 1.1222 and daily support a touch above at 1.1239.
Conservative traders will look for at least a H4 bullish candlestick signal to form within the said zone before pulling the trigger. Not only does this help identify buyer intent, it provides entry and risk levels to work with.
Owing to the market recently shaking hands with 1.1173/1.1221, the above analysis remains valid going into Thursday’s session. Based on the overall technical picture, 1.13 stands as a valid upside target out of the H4 support zone.
GBP/USD:
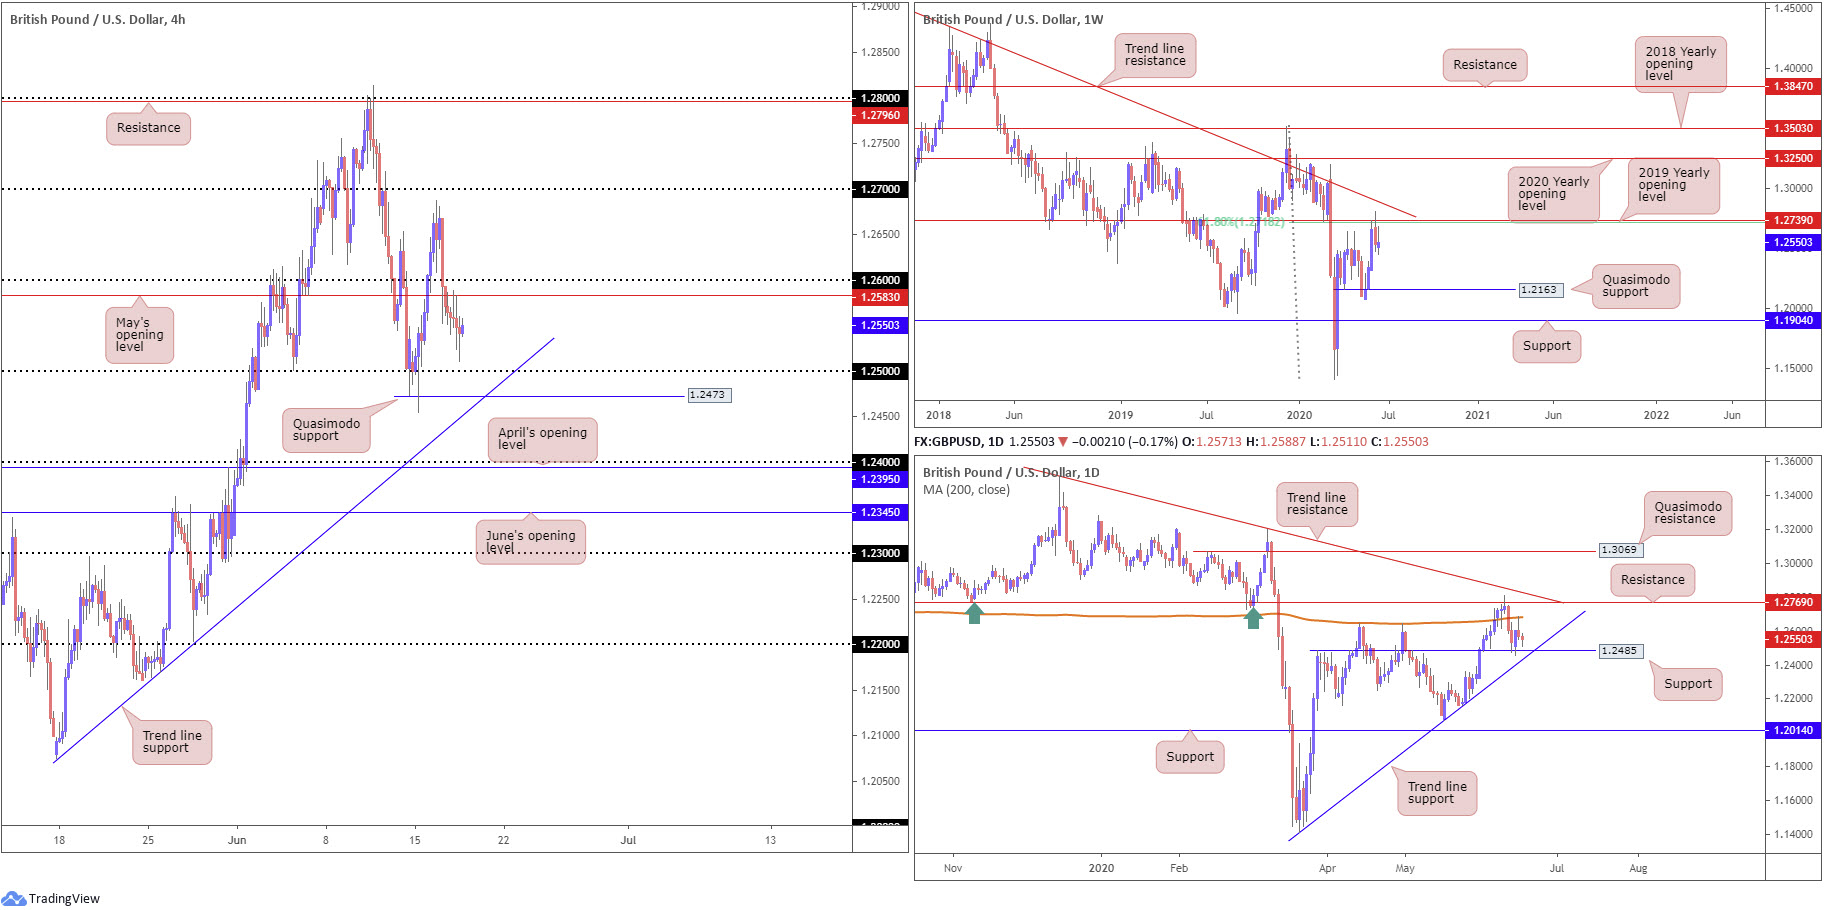
The British pound gradually softened against the stronger dollar Wednesday as DXY continued to work with levels above 97.00. Falling short of 1.26, May’s opening level at 1.2583, located on the H4 timeframe, did a superb job of capping upside, forcing lows at 1.2511 before marginally recoiling into the later stages of the session. The 1.25 handle rests as the next downside target, closely merging with trend line support, taken from the low 1.2075, and Quasimodo support coming in at 1.2473.
In terms of the weekly timeframe, price action continues to languish under the 61.8% Fibonacci retracement ratio at 1.2718 and 2019 yearly opening level at 1.2739. It should also be emphasised these levels are positioned beneath a long-term trend line resistance, extended from the high 1.5930. Increased selling from here, in line with the overall trend, throws Quasimodo support at 1.2163 in the pot as a feasible downside target on this timeframe.
The story on the daily timeframe has the unit bouncing between support at 1.2485, a level that comes with trend line support (1.1409) and the 200-day SMA (orange – 1.2682). Traders will also note resistance at 1.2769, followed by trend line resistance, extended from the high 1.3514.
Areas of consideration:
H4 price closing under 1.26 has clearly garnered the interest of sellers, particularly off May’s opening level at 1.2583.
A scenario worthy of the watchlist, underlined in Wednesday’s technical briefing, is a mild fakeout through the 1.25 handle. This would potentially trip stops and draw in daily buyers from support at 1.2485/H4 Quasimodo support at 1.2473. A H4 close back above 1.25 will likely be considered a strong buy signal.
AUD/USD:
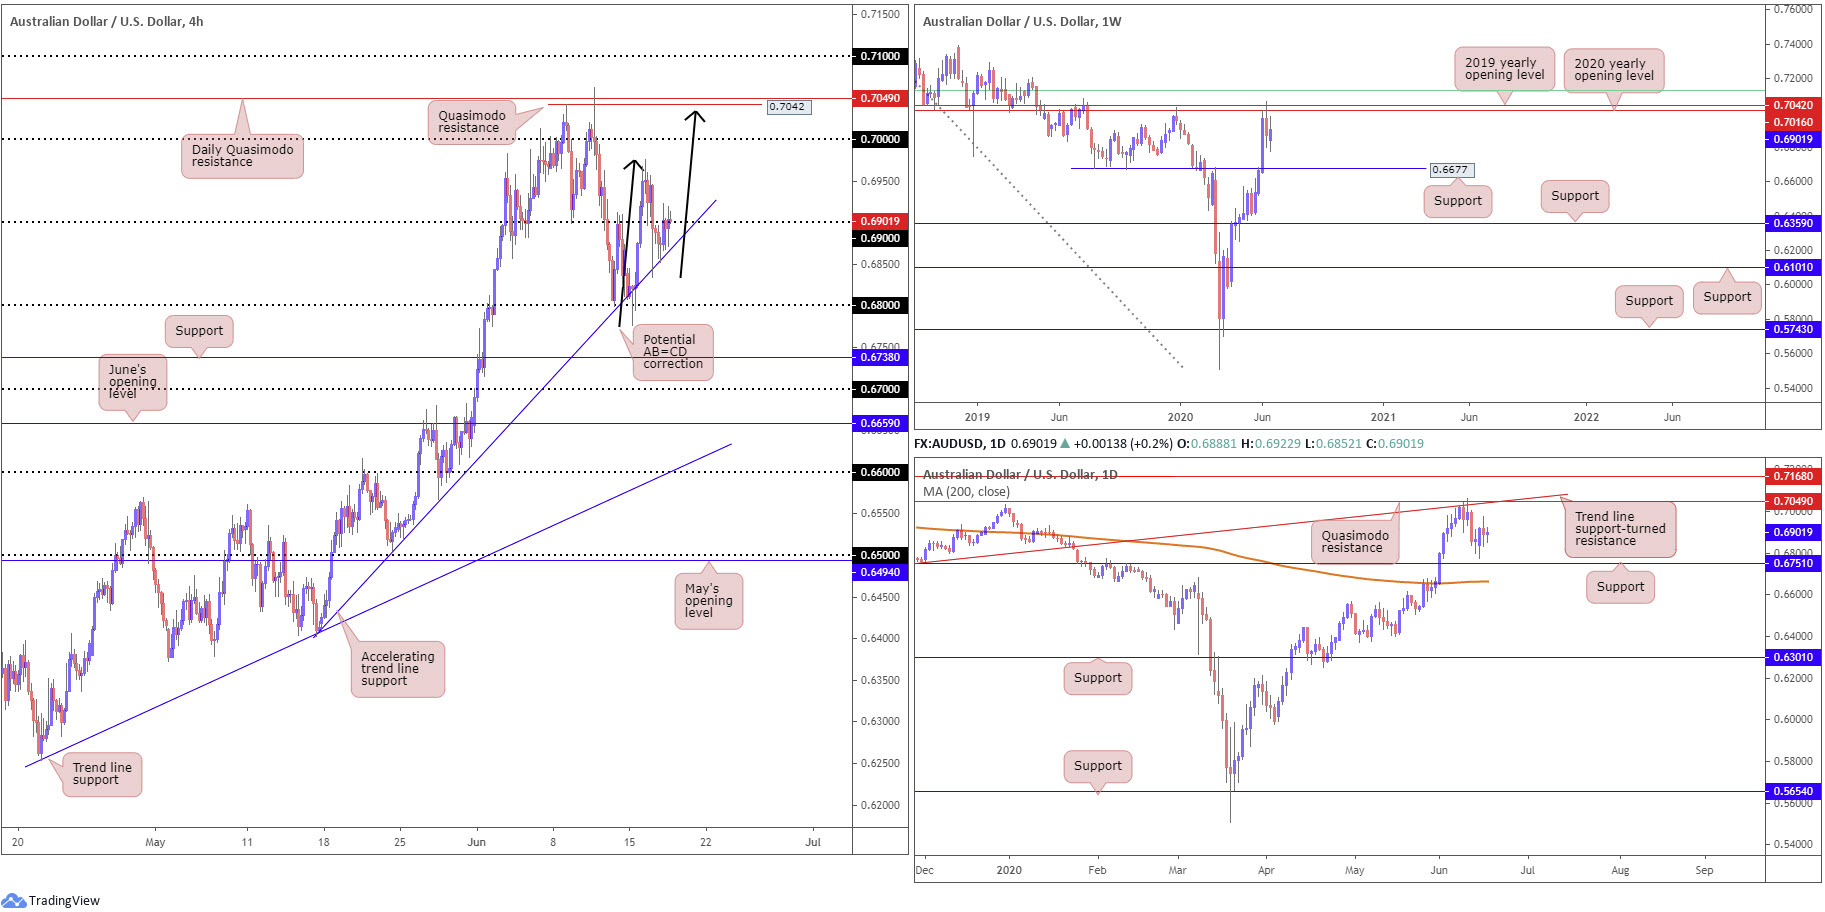
Upbeat risk sentiment bolstered AUD/USD in recent trading, with 0.69 coming under fire. Intraday action, however, found thin air above the aforementioned round number, though at the same time H4 candles have provided little indication of intention to move lower. Reclaiming the round number to the upside today could eventually put forward an AB=CD bearish configuration (black arrows) that terminates ahead of H4 Quasimodo resistance at 0.7042, listed just under daily Quasimodo resistance at 0.7049.
Resistance, forged in the shape of the 2020 yearly opening level and the 2019 yearly opening level at 0.7016 and 0.7042, respectively, challenged buyers on the weekly timeframe in recent movement. It might also interest traders to note that just above the said resistances we have a 61.8% Fibonacci retracement ratio stationed at 0.7128 (green). While we cannot rule out the possibility of upside attempts on this timeframe, support could eventually spin into sight at 0.6677.
With respect to technical structure on the daily timeframe, Quasimodo resistance is in view at 0.7049, closely merging with trend line support-turned resistance, taken from the low 0.6670. Attention on this timeframe also remains at support coming in from 0.6751, placed above the 200-day SMA (orange – 0.6664) which appears poised to turn higher.
Areas of consideration:
Although it may not materialise today, H4 Quasimodo resistance at 0.7042 is a level of note. Not only does it come with a possible H4 AB=CD pattern, the level benefits from a close connection to daily Quasimodo resistance at 0.7049. Collectively, this forms formidable resistance, despite positioned against the immediate trend (though overall we have been lower since June 2011).
A decisive H4 close above 0.69 may also refresh buyer interest, particularly if we retest the latter as support. Intraday targets from here can be found at Tuesday’s high 0.6976, the 0.70 handle and finally our watched resistances around 0.7040ish.
USD/JPY:
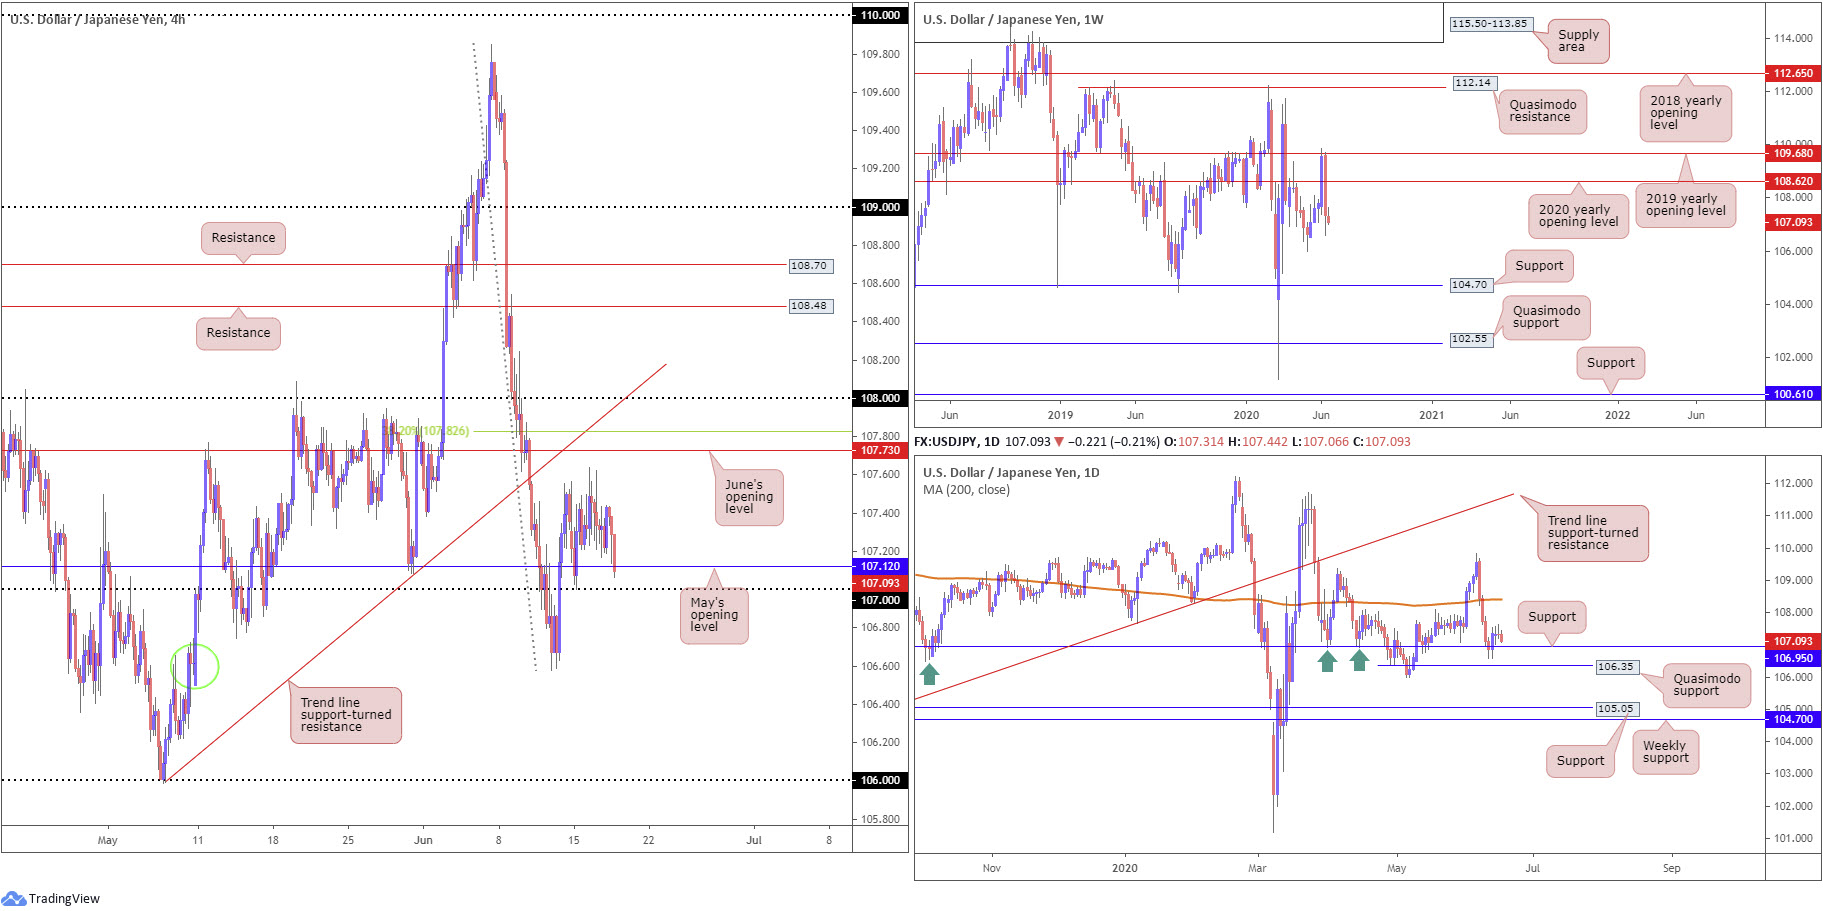
Recent hours witnessed USD/JPY test territory south of May’s opening level at 107.12 on the H4 timeframe, highlighting the 107 handle as possible support. Holding out of 107/107.12 airs the possibility of a climb to 107.63, Tuesday’s high, closely followed by June’s opening level at 107.73 and the 38.2% Fibonacci retracement ratio at 107.82.
From the weekly timeframe, after firmly rejecting the 2019 yearly opening level at 109.68 and cruising through the 2020 yearly opening level at 108.62, this shifts focus to the 105.98 6th May low as the next downside target on this scale.
Contrary to the weekly timeframe’s position, daily support at 106.95 is on the radar, as is daily Quasimodo support at 106.35. A swing higher from here could find price action crossing swords with the 200-day SMA (orange – 108.41). So, while weekly price suggests sellers govern action, daily price indicates buyers could still have a hand in this fight. It might also be worth pointing out the 105.98 6th May low underlined on the weekly timeframe forms the low to the aforementioned daily Quasimodo support.
Areas of consideration:
Combined, May’s opening level at 107.12, the 107 handle and daily support at 106.95 provides an appealing floor to work with this morning. Two cautionary points to consider here, however, is round numbers are prone to fakeouts, given the number of orders these levels attract. In addition, entering long from 106.95/107.12 places you against weekly flow, therefore, this may force many traders to wait and see if H4 price prints anything meaningful to the upside before committing.
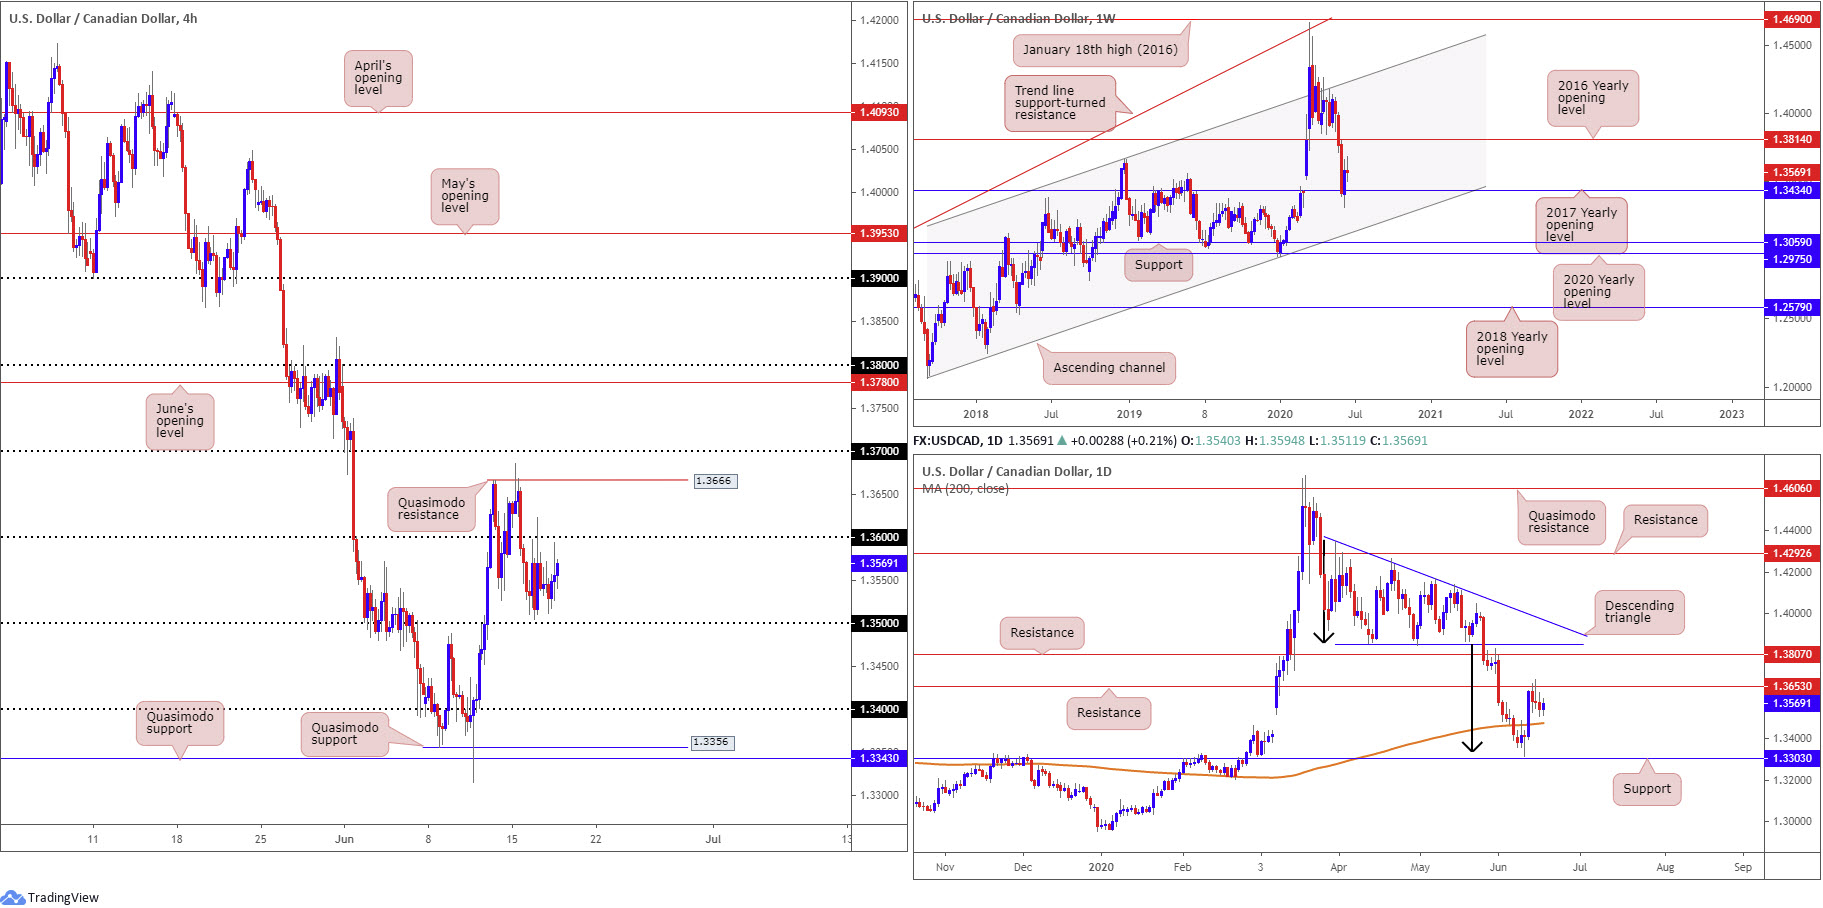
USD/CAD:
The US dollar eked out marginal gains against the Canadian dollar on Wednesday, snapping a three-day bearish phase. WTI price echoed a subdued tone around $37.80/bbl, while the DXY maintained a presence above 97.00.
The 1.36 handle remains in the spotlight on the H4 timeframe as near-term resistance. 1.35 is also stationed nearby, though price appears to be cycling off local support just ahead of the figure around 1.3515. H4 shows Quasimodo resistance could make an appearance at 1.3666 should 1.36 relinquish control. South of 1.35, on the other hand, 1.34 will likely call for attention, closely followed by Quasimodo support at 1.3356.
Given weekly price trades unchanged on the week so far, the weekly technical briefing remains valid (italics):
USD/CAD bulls, following three consecutive weeks of losses, went on the offensive last week, drawing impetus from the 2017 yearly opening level at 1.3434.
Theoretically, this promotes the possibility of additional bullish sentiment, targeting resistance by way of the 2016 yearly opening level at 1.3814. Clearing 1.3434 places channel support, taken from the low 1.2061, into the limelight.
From the daily timeframe, price continues to mingle in between resistance at 1.3653 and the 200-day SMA (orange – 1.3474). Above current resistance, another layer of resistance at 1.3807 is seen, whereas a spin lower could have sellers take aim at support coming in at 1.3303.
Areas of consideration:
As highlighted in the weekly analysis, higher-timeframe buyers are unlikely to commit to the weekly timeframe’s push off support at 1.3434 until we crack daily resistance from 1.3653.
With the H4 candles approaching the underside of 1.36, it’s unlikely this level will offer much more resistance owing to the lack of confluence. Bullish scenarios above the round number could be an option, targeting daily resistance at 1.3653, followed by H4 Quasimodo resistance at 1.3666.
Having noted weekly price threatening a move higher, another potential scenario worth keeping on the books involves a fakeout through 1.35 into the 200-day SMA (1.3474). A H4 close back above 1.35 from the SMA will likely be a welcomed sight for buyers.
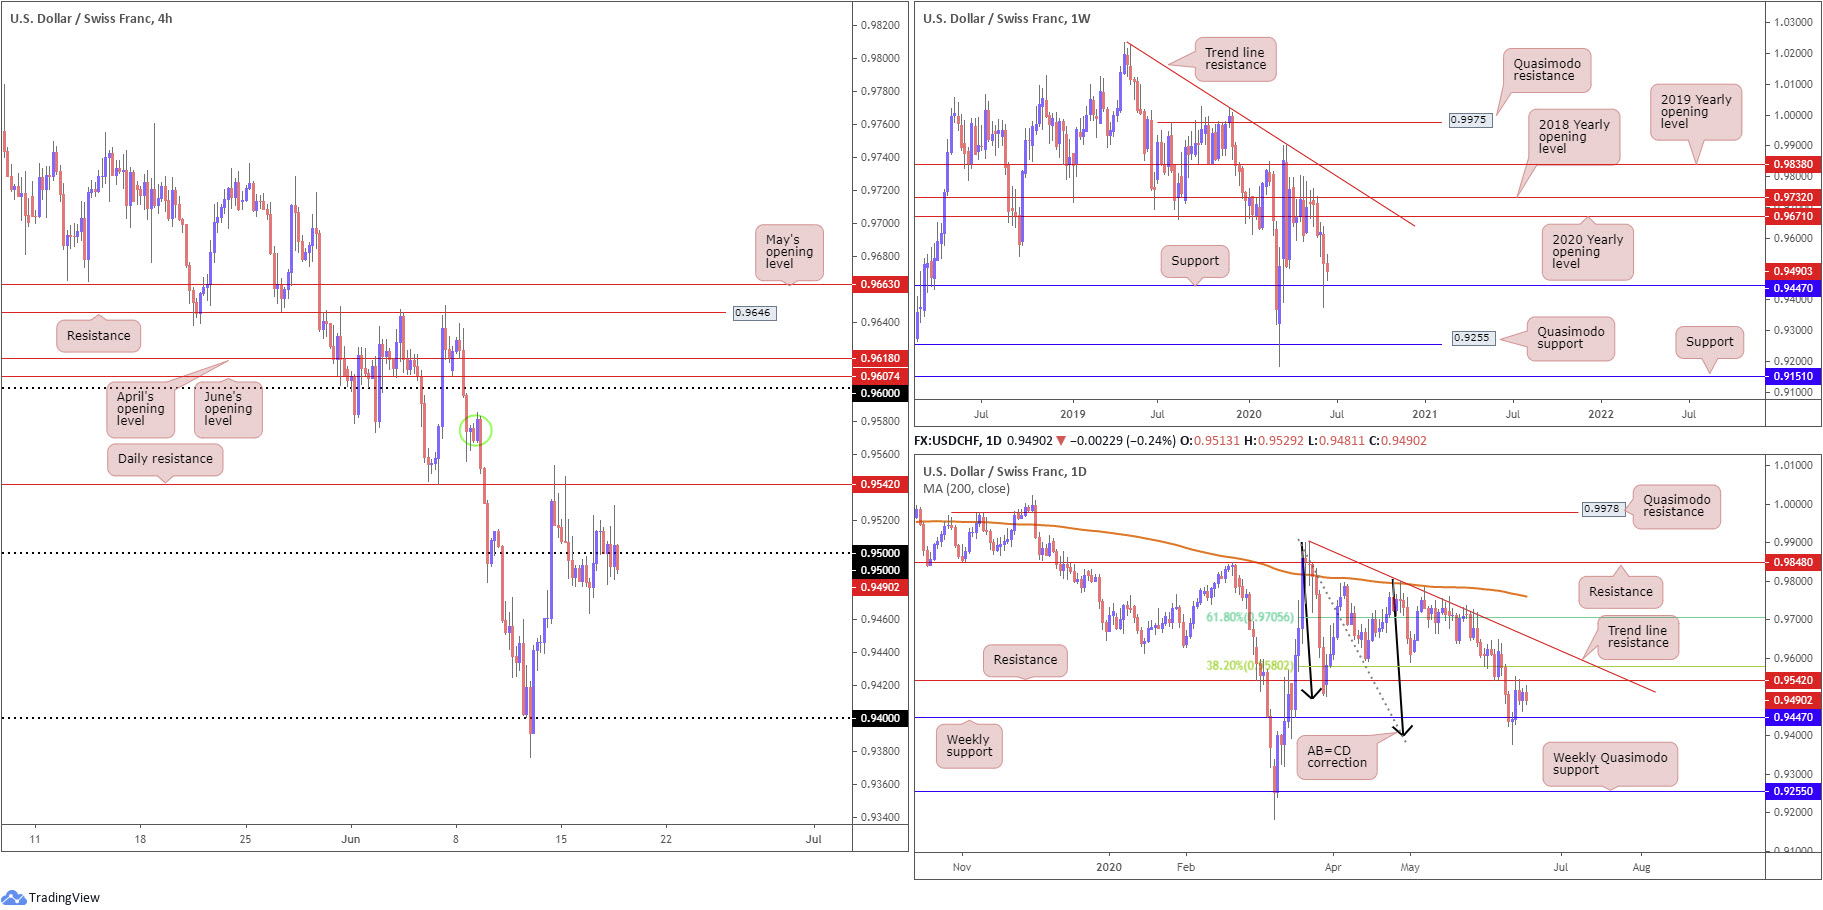
USD/CHF:
0.95, based on the H4 timeframe, has been slaughtered so far this week, chopping through intraday orders in the process. It’s difficult to judge direction at this point.
Downside from 0.95 has weekly support at 0.9447 to contend with, with a break here exposing the 0.94 handle on the H4 chart. Above 0.95, daily resistance resides close by at 0.9542; violating this base shines the spotlight on H4 supply around 0.9580 (green circle), and the 0.96 handle, as well as June and April’s opening levels at 0.9607 and 0.9618, respectively.
It is also worth reminding ourselves of the daily timeframe’s overall picture, suggesting a possible move above daily resistance (italics):
The break of weekly support at 0.9447 threw breakout sellers into a bear trap as daily buyers vigorously defended AB=CD structure (black arrows) at 0.9395. The initial upside target out of the daily AB=CD pattern, traditionally speaking, can be found at the 38.2% Fibonacci retracement ratio at 0.9580 (derived from legs A-D), positioned above resistance plotted at 0.9542. It is possible, according to traditional measures, the final AB=CD target might also be met at 0.9705, the 61.8% Fibonacci retracement ratio from legs A-D. This implies a push above trend line resistance, taken from the high 0.9901.
Areas of consideration:
Executing trades around 0.95 is precarious at this stage, owing to the lack of clear support/resistance offered in recent action.
According to the AB=CD daily take-profit projections we may eventually head above the noted daily resistance (0.9542) for 0.9580ish, perhaps enough to draw in bearish themes off 0.9618/0.96 (April and June’s opening levels and the round number 0.96) on the H4 before heading lower. With this being the case, intraday bullish scenarios above current daily resistance could also be something to watch for.
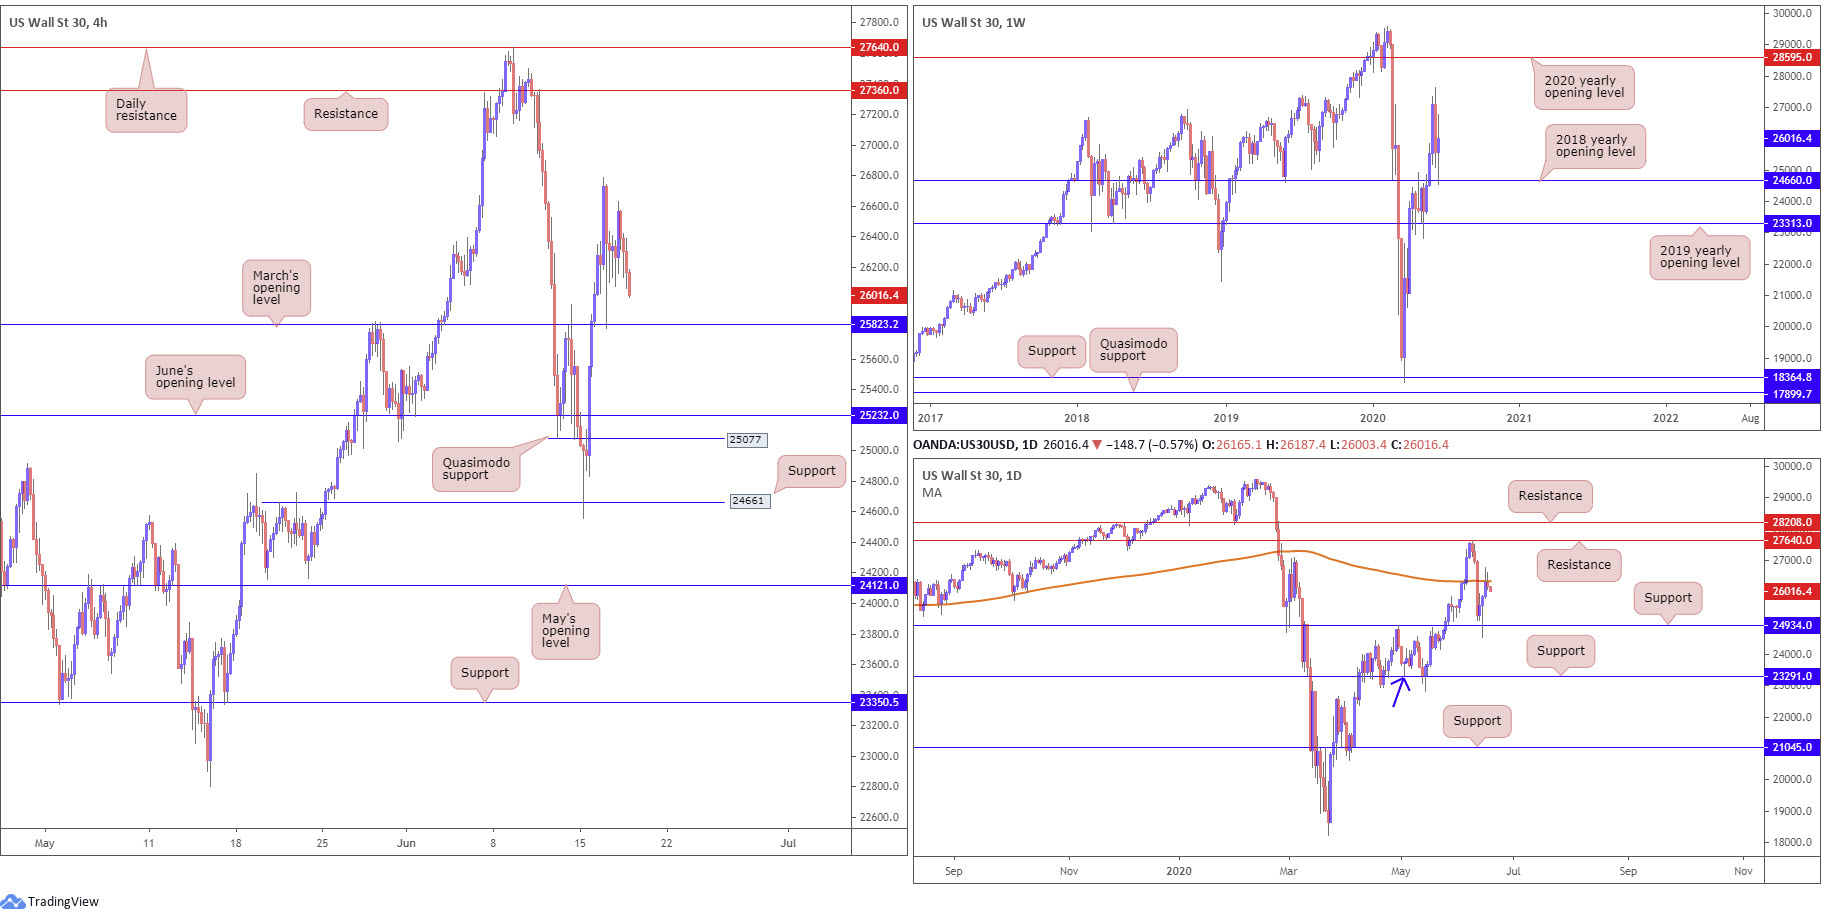
Dow Jones Industrial Average:
Global equities finished mixed Wednesday as investors digested the impact of rising Covid-19 infections. The Dow Jones Industrial Average dipped 170.37 points, or 0.65%; the S&P 500 dropped 11.25 points, or 0.36%, while the tech-heavy Nasdaq 100 concluded higher by 33.11 points, or 0.33%.
Recent activity on the daily timeframe greeted the underside of the 200-day SMA (orange – 26337), enough to snap a three-day bullish phase. Daily support falls in at 24934, suggesting scope for extended losses over the coming days.
Meanwhile, weekly flow delivers support in the form of the 2018 yearly opening level at 24660. The current weekly candle trades higher for now, albeit off best levels. Further extension lands flow at the 27638 high, followed by room to bring in the 2020 yearly opening level at 28595. Moves lower, on the other hand, throws the 2019 yearly opening level at 23313 in sight.
Against the backdrop of the higher timeframes, the H4 candles appear poised to knock on the door of March’s opening level at 25823, a level with an attractive history as support/resistance. Dropping under the aforementioned support today shifts crosshairs towards June’s opening level at 25232 and Quasimodo support at 25077 (located just above daily support at 24934).
Areas of consideration:
Intraday traders may hone in on March’s opening level at 25823 today in search of supportive structure. Conservative traders will likely seek additional confirmation from this base before engaging, given daily price fading its 200-day SMA. In fact, a H4 close below 25823 could take things towards 25232 on the H4. This, combined with H4 Quasimodo support at 25077 and daily support at 24934, not only sends across an ideal take-profit target for shorts, it provides a stage to consider bullish themes from.
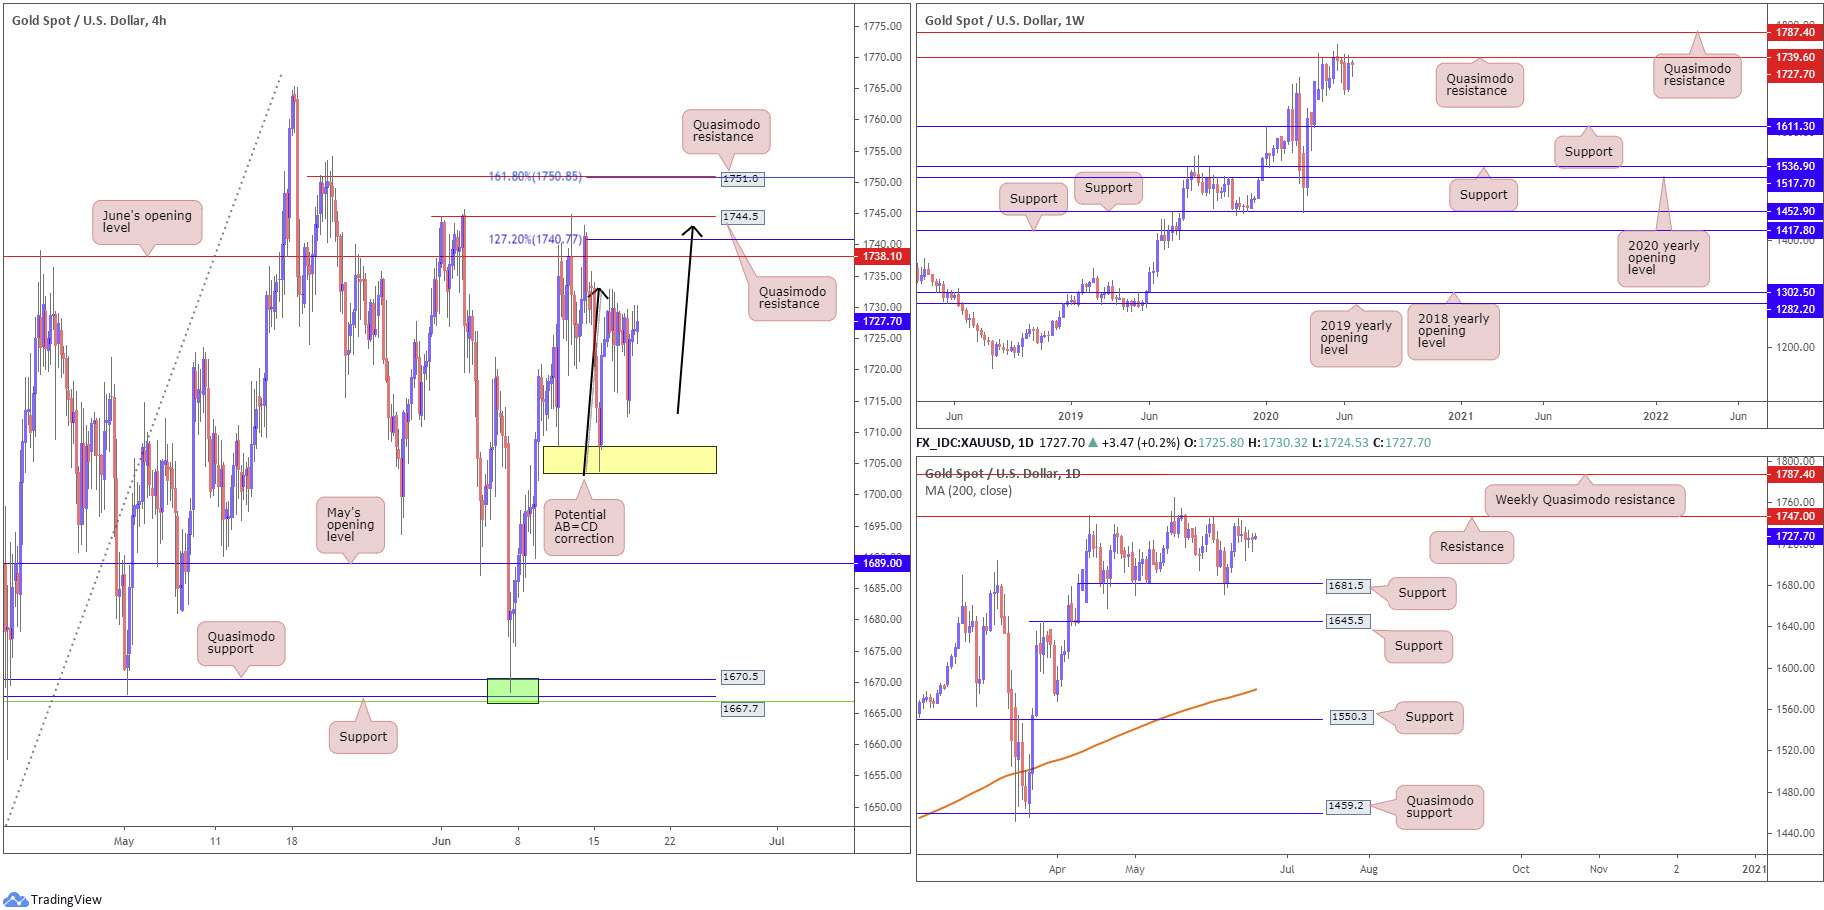
XAU/USD (GOLD):
Since the H4 candles shook hands with Quasimodo resistance at 1744.5 and June’s opening level at 1738.1, price action has emphasised a somewhat directionless state, unable to break 1703.4/1707.8 (yellow). Recent developments on the H4 timeframe, however, puts across the possibility of an AB=CD bearish pattern (black arrows), terminating just south of the aforementioned Quasimodo resistance.
Price movement from the weekly timeframe, as highlighted in Monday’s technical briefing, has had buyers and sellers fighting for position below Quasimodo resistance at 1739.6 since mid-April, sited under another layer of Quasimodo resistance at 1787.4. A decisive turn lower from current price moves support at 1611.3 into view.
A closer reading of price action on the daily timeframe reveals candles remain entrenched within a range between resistance at 1747.0 and support pencilled in at 1681.5. A breakout to the downside shines the spotlight on support at 1645.5; turning higher, however, highlights the weekly Quasimodo resistance at 1787.4. As of current price, we are seeing the candles hovering, indecisively, within the upper portion of the said range.
Areas of consideration:
Although the trend has faced north since 2016, all the while weekly Quasimodo resistance remains intact this will likely deter prospective buyers.
A possible setup for sellers on the H4 timeframe is a pop above June’s opening level at 1738.1 to Quasimodo resistance at 1744.5.
1744.5 also offers nearby H4 AB=CD completion and additional resistance in the shape of a 127.2% Fibonacci extension point at 1740.7. However, there is also a possibility we could whipsaw through 1744.5 for H4 Quasimodo resistance at 1751.0, offering an alternate AB=CD pattern at the 161.8% Fibonacci extension from 1750.8. Breaking above 1744.5 also draws in sellers from daily resistance at 1747.0.
The accuracy, completeness and timeliness of the information contained on this site cannot be guaranteed. IC Markets does not warranty, guarantee or make any representations, or assume any liability regarding financial results based on the use of the information in the site.
News, views, opinions, recommendations and other information obtained from sources outside of www.icmarkets.com.au, used in this site are believed to be reliable, but we cannot guarantee their accuracy or completeness. All such information is subject to change at any time without notice. IC Markets assumes no responsibility for the content of any linked site.
The fact that such links may exist does not indicate approval or endorsement of any material contained on any linked site. IC Markets is not liable for any harm caused by the transmission, through accessing the services or information on this site, of a computer virus, or other computer code or programming device that might be used to access, delete, damage, disable, disrupt or otherwise impede in any manner, the operation of the site or of any user’s software, hardware, data or property.


