
Key risk events today:
Australia Employment Change and Unemployment Rate; French and Italian banks are closed in observance of Assumption Day; UK Retail Sales m/m; Philly Fed Manufacturing Index; US Retail Sales m/m; US Core Retail Sales m/m.
EUR/USD:
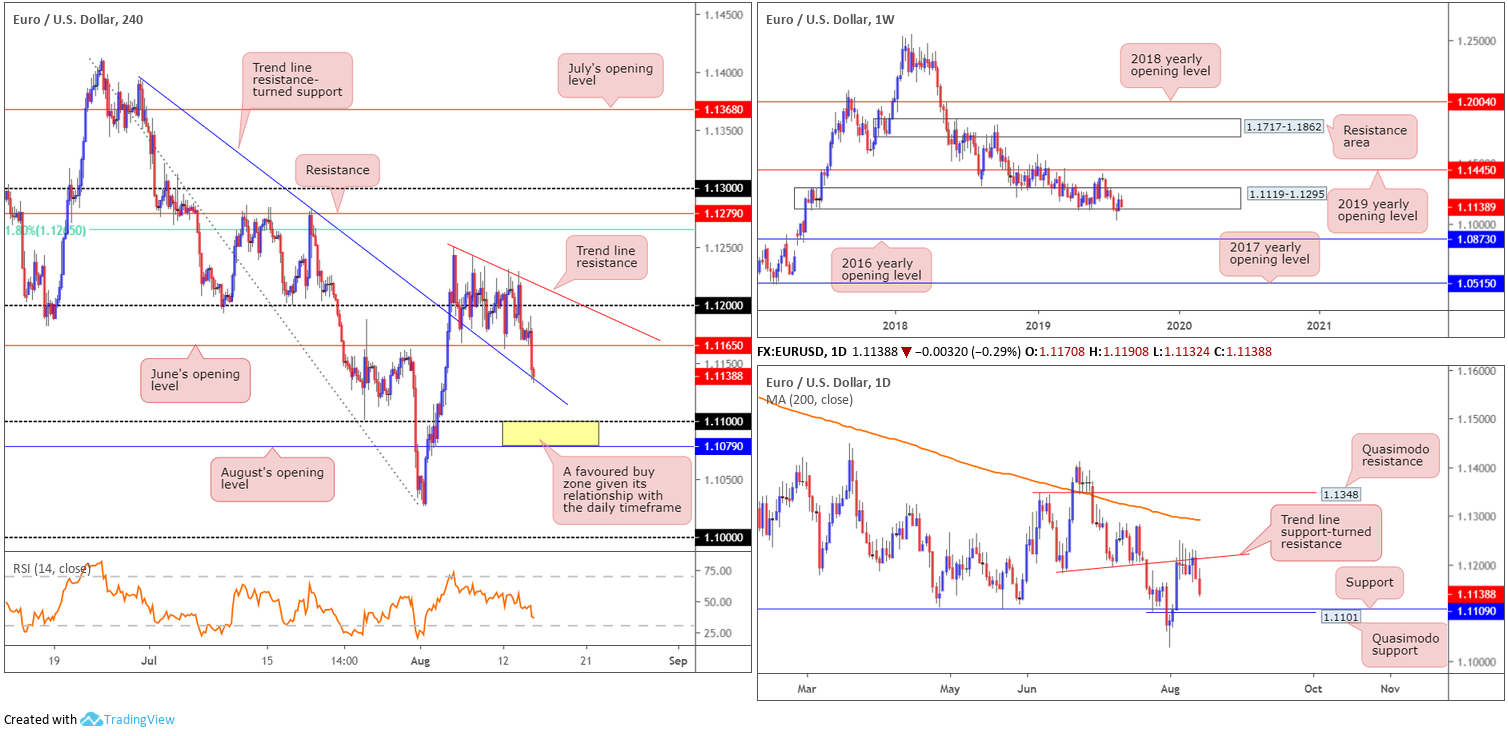
Optimism over US/China trade and tariff suspension reverted to pessimism Wednesday, amidst weak data out of China and growth in Germany contracting, with the preliminary estimate of Q2 GDP coming in at -0.1%.
As of writing, Europe’s single currency trades lower by 0.29% against the buck, poised for a retreat to the 1.11 handle on the H4 timeframe. Before shaking hands with this base, however, trend line resistance-turned support (extended from the high 1.1393) must surrender. Beyond 1.11, traders may also wish to acknowledge August’s opening level resides close by at 1.1079.
On a wider perspective, daily movement is extending its recent rejection off local trend line support-turned resistance (etched from the low 1.1181). Continued selling may call for a run towards support at 1.1109, closely shadowed by Quasimodo support at 1.1101. In terms of weekly flow, long-standing demand at 1.1119-1.1295 appears vulnerable, particularly after the market submerged the lower edge of the said demand in recent trade and clocked multi-year lows at 1.1026.
Areas of consideration:
Medium-term flow (H4) underlines a particularly interesting area of support today between August’s opening level at 1.1079 and the round number 1.11. The research team favours this zone due to it merging closely with a daily Quasimodo support at 1.1101 and daily support fixed at 1.1109. Therefore, should traders witness a H4 bullish candlestick develop from within the confines of 1.1079/1.11, a long based on this structure could be an option, targeting June’s opening level at 1.1165. The reason for requiring additional candlestick confirmation simply comes down to the market being entrenched within a downtrend at present.
GBP/USD:
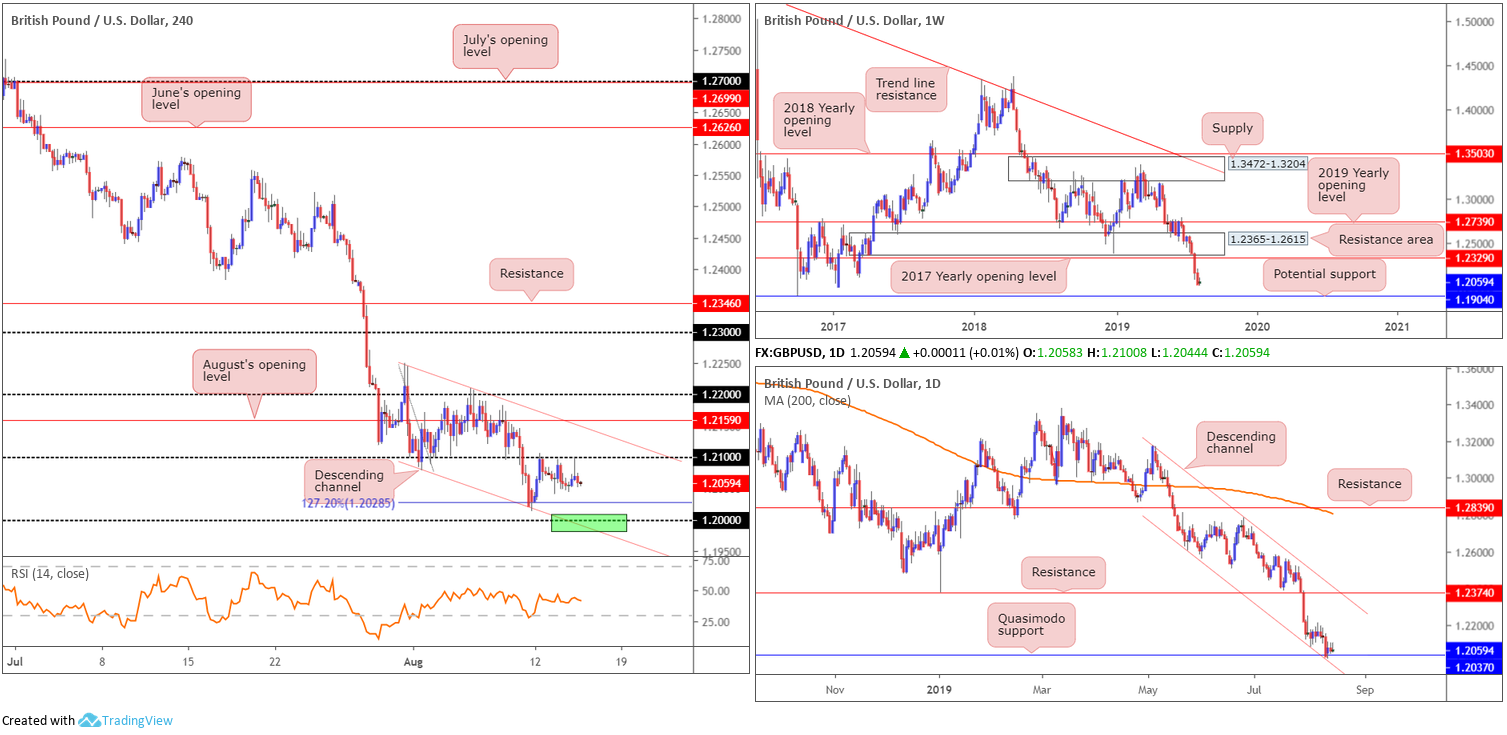
UK’s pound remained reasonably stable Wednesday despite the risk-off setting, strong offers residing around 1.21 and the US dollar index recently crossing back above the 98.00 mark. The consumer prices index (CPI) 12-month rate came in at 2.1% in July 2019, increasing from 2.0% in June 2019, according to the Office for National Statistics. This immediately triggered a run higher, though was swiftly capped by 1.21 on the GBP/USD.
Shifting focus to the technical landscape, similar to Wednesday’s briefing, the H4 candles have support eyed at a 127.2% Fibonacci ext. point at 1.2028, closely followed by the key figure 1.20. It is also worth noting the H4 chart remains compressing within a descending channel formation taken from the high 1.2249 and a low of 1.2079.
The weekly timeframe’s outlook remains unchanged:
(Extracted from Monday’s weekly outlook).
The British pound retained a heavy tone last week, erasing more than 130 points and recording its fourth consecutive losing week. After tunnelling through bids residing within long-standing demand at 1.2365-1.2615 (now acting resistance area) and overthrowing the 2017 yearly opening level at 1.2329, the next downside objective on the weekly timeframe falls in around support from 1.1904: a standout low clocked in early October 2016.
Regarding the daily timeframe, limited movement was seen yesterday, therefore Wednesday’s outlook remains in motion:
As is evident from the daily timeframe, before reaching 1.1904 on the weekly timeframe, daily movement must contend with channel support (taken from the low 1.2605) and Quasimodo support close by at 1.2037. This, particularly on the daily timeframe, is the last line of defence for buyers it seems as a clear run beneath here is visible to 1.1904.
Areas of consideration:
The following was also taken from Wednesday’s briefing as it remains valid given the lacklustre performance yesterday:
Entering long at 1.20 is an option, specifically at the point the round number aligns with the current H4 channel support (green). By doing so, nevertheless, take into account that while you have additional support on the daily timeframe from channel support/Quasimodo support at 1.2037, directional flow on the weekly timeframe portends further downside to 1.1904. A H4 bullish candlestick printed from 1.20 would likely encourage buying and provide a base for you to set entry and risk levels, though whether price will reach 1.21 again is difficult to judge.
In the event we overthrow 1.20 on a H4 closing basis, which appears the more likely route as of current price action, this would likely put a test of 1.19 in view (weekly support boundary). A retest at 1.20 as resistance by way of a H4 bearish candlestick formation, therefore, is ideal for sellers, allowing traders to position entry and risk levels according to the pattern.
AUD/USD:
Impact of US/China trade optimism faded on the back of latest headlines out of China. Growth of China’s industrial output slowed much more than expected to 4.8% in July from a year earlier, official data showed on Wednesday, in the latest sign of faltering demand in the world’s second-largest economy as the United States ramps up trade pressure (Reuters). Aussie jobs data will likely provide independent impetus, but risk aversion is gathering pace at present.
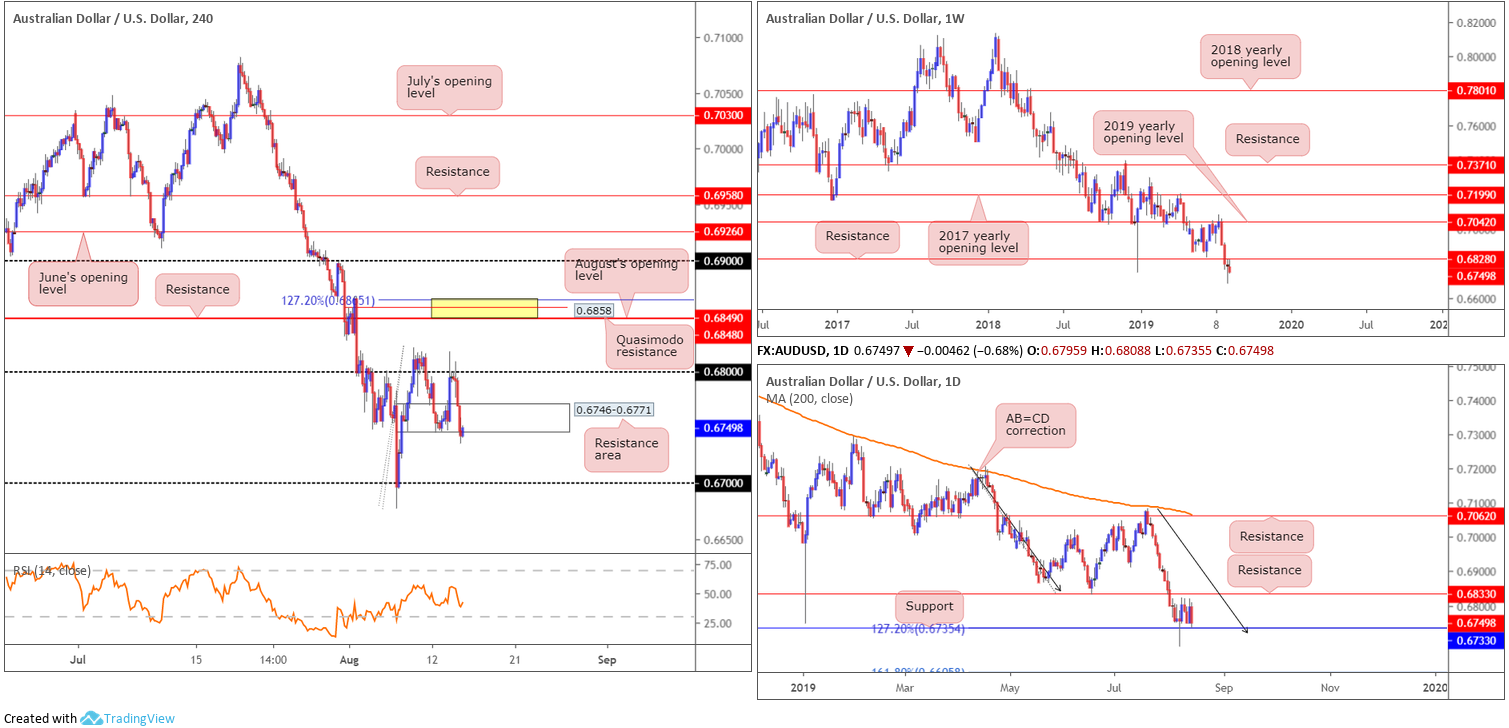
Unable to sustain gains beyond the 0.68 handle on the H4 timeframe, the Australian dollar eased lower against the greenback in recent movement and overwhelmed bids covering demand at 0.6746-0.6771 (now acting resistance area), the origin of the recent move higher. Although only registering a marginal break of the said demand, this is likely enough to trip sell stops and potentially fuel another wave of selling in the direction of 0.67.
With respect to the weekly timeframe, nonetheless, little has changed in terms of structure, with the AUD/USD continuing to languish sub resistance at 0.6828, extending the pullback from the 2019 yearly opening level (resistance) at 0.7042. As highlighted in Wednesday’s report, the pair recently refreshed multi-year lows at 0.6677, and with the long-term downtrend remaining intact, further selling is likely on the cards as the next support is not visible until 0.6395 on this timeframe (not seen on the screen).
Elsewhere, daily price is sandwiched between support at 0.6733 (merges with a 127.2% AB=CD [black arrows] formation at 0.6735) and resistance fixed at 0.6833 (June 18 low). Price action is trading within close proximity of the lower end of the said range, as we write.
Areas of consideration:
While the trend clearly faces a southerly bearing and both H4 and weekly timeframes suggest additional downside could be on the menu, daily support may hamper selling at support drawn from 0.6733. Therefore, selling the breakout of the current H4 demand-turned potential resistance area is challenging. The best thing to do in situations such as this is wait for a H4 bearish candlestick signal to print, preferably around the lower edge of the said H4 resistance zone before pulling the trigger. That way, not only have you identified seller intent, you also have a structured base to set entry and risk levels from, with the expectation of a run to 0.67 and possibly beyond.
The accuracy, completeness and timeliness of the information contained on this site cannot be guaranteed. IC Markets does not warranty, guarantee or make any representations, or assume any liability regarding financial results based on the use of the information in the site.
News, views, opinions, recommendations and other information obtained from sources outside of www.icmarkets.com.au, used in this site are believed to be reliable, but we cannot guarantee their accuracy or completeness. All such information is subject to change at any time without notice. IC Markets assumes no responsibility for the content of any linked site.
The fact that such links may exist does not indicate approval or endorsement of any material contained on any linked site. IC Markets is not liable for any harm caused by the transmission, through accessing the services or information on this site, of a computer virus, or other computer code or programming device that might be used to access, delete, damage, disable, disrupt or otherwise impede in any manner, the operation of the site or of any user’s software, hardware, data or property.


