
Key risk events today:
Australia Job’s Data; New Zealand Annual Budget Release; BoE Gov Bailey Speaks; US Unemployment Claims; BoC Gov Poloz Speaks.
(Previous analysis as well as outside sources – italics).
EUR/USD:
The dollar index rose Wednesday, establishing a floor ahead of 99.50 and reclaiming 100.00+ status by the close. This guided EUR/USD southbound, chewing through a large portion of Tuesday’s gains and forming a notable selling wick, which some analysts may label a daily shooting star pattern.
Federal Reserve Chair Jerome Powell made two things clear during much-anticipated remarks on Wednesday. First, fiscal policy might need to do more to combat the lasting economic damage from the coronavirus pandemic. Second — in what markets were most eager to hear — he’s not about to steer the central bank down the path to negative interest rates[1].
For those who read Wednesday’s technical briefing you may recall the following piece (italics):
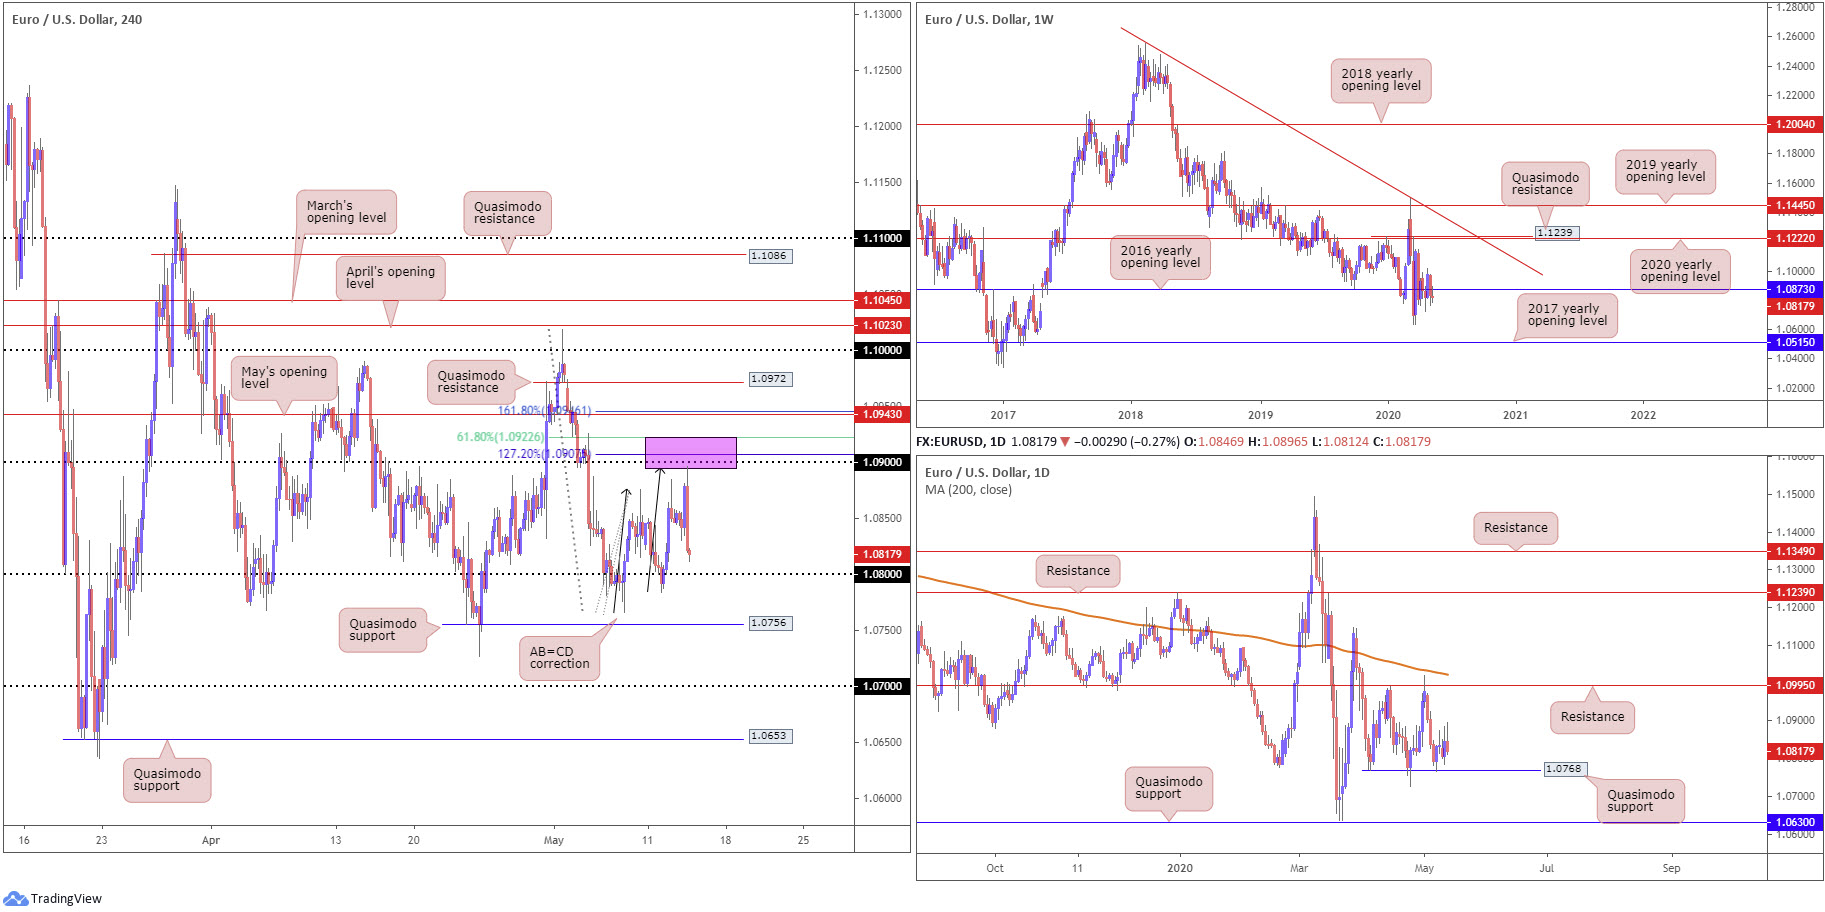
Technical focus has shifted to 1.09ish. The round number joins closely with a potential AB=CD correction (black arrows) at 1.0895, a 127.2% Fibonacci extension point coming in from 1.0907 and a 61.8% Fibonacci retracement ratio at 1.0922 (pink).
As evident from the H4 chart, the pink area held almost to-the-pip, before price collapsed to lows set north of the 1.08 handle. Well done to any readers who managed to catch this move.
From the weekly timeframe, price action remains languishing a touch beneath its 2016 yearly opening level at 1.0873. Overall, EUR/USD has been involved in a long-term downtrend since topping in early 2018. A nudge lower could see multi-year lows enter sight at 1.0635, while firming may eventually witness the 2020 yearly opening level at 1.1222 make a play.
Price movement on the daily timeframe continues to consolidate off Quasimodo support from 1.0768. Resistance at 1.0995 is likely to be the first port of call should we climb from here, closely tailed by the 200-day SMA (orange – 1.1022), whereas a pop lower could bring in another Quasimodo support at 1.0630.
Areas of consideration:
Those short south of 1.09 likely have eyeballs on 1.08 as the next downside target, with a break targeting daily Quasimodo support at 1.0768 and H4 Quasimodo support at 1.0756.
The two noted Quasimodo supports are certainly areas to keep a tab on today, potentially containing enough oomph to force a rebound to 1.08. Any higher than this is questionable due to weekly price holding sub 1.0873.
GBP/USD:
Sterling underperformed across the board Wednesday, following not quite as dire as forecast UK data as well as dollar upside north of 100.00.
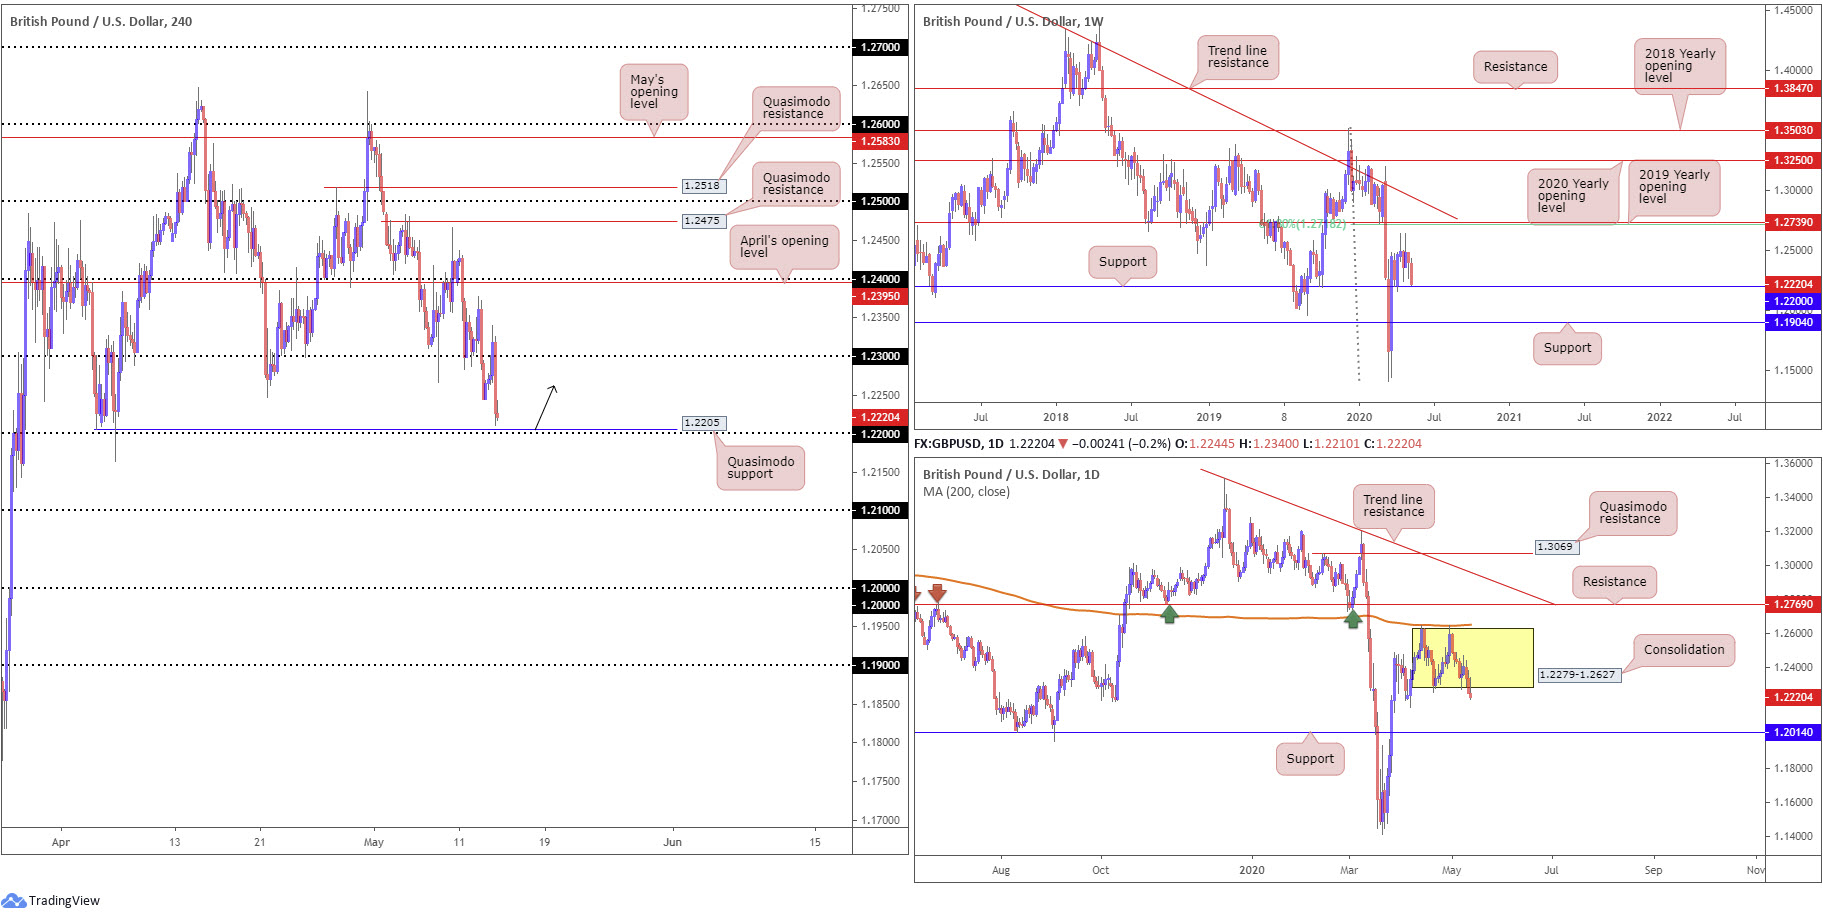
GBP/USD stripped stops from 1.23 and is poised to approach 1.22 on the H4 timeframe. This also shines the spotlight on Quasimodo support at 1.2205. What’s also interesting is sell-stops lurking beneath last Thursday’s low at 1.2266 and also under the 1.2247 April 21 low. This, as highlighted in Tuesday’s technical briefing, may provide enough liquidity to rebound price off 1.22ish.
Meanwhile, on the weekly timeframe, support at 1.2200 offers a pivotal base, holding price action higher since the beginning of April. Scope to push north from here is visible until reaching the 2019 yearly opening level at 1.2739, which aligns closely with a 61.8% Fibonacci retracement ratio at 1.2718. Additionally, we see the pair pulled back from historic lows at 1.1409 in March. Seeing as the unit has been trending south since April 2018, sellers, technically speaking, could eventually make a run for fresh lows.
The story on the daily timeframe has price action navigating waters south of a familiar consolidation zone between 1.2279-1.2627 (yellow). Interestingly, the upper boundary of the aforesaid range is currently reinforced by the 200-day SMA (orange – 1.2649). Traders will also note external resistance sits at 1.2769 and support at 1.2014.
Areas of consideration:
Not only is 1.22 a widely watched figure by and of itself, it comes together with H4 Quasimodo support at 1.2205 and weekly support at 1.2200. Therefore, 1.22 serves as a downside target for breakout sellers sub 1.23 and also as a platform for buying opportunities, owing to its confluence. Buyers off 1.22 will likely have 1.2245ish in sight as an initial upside target.
AUD/USD:
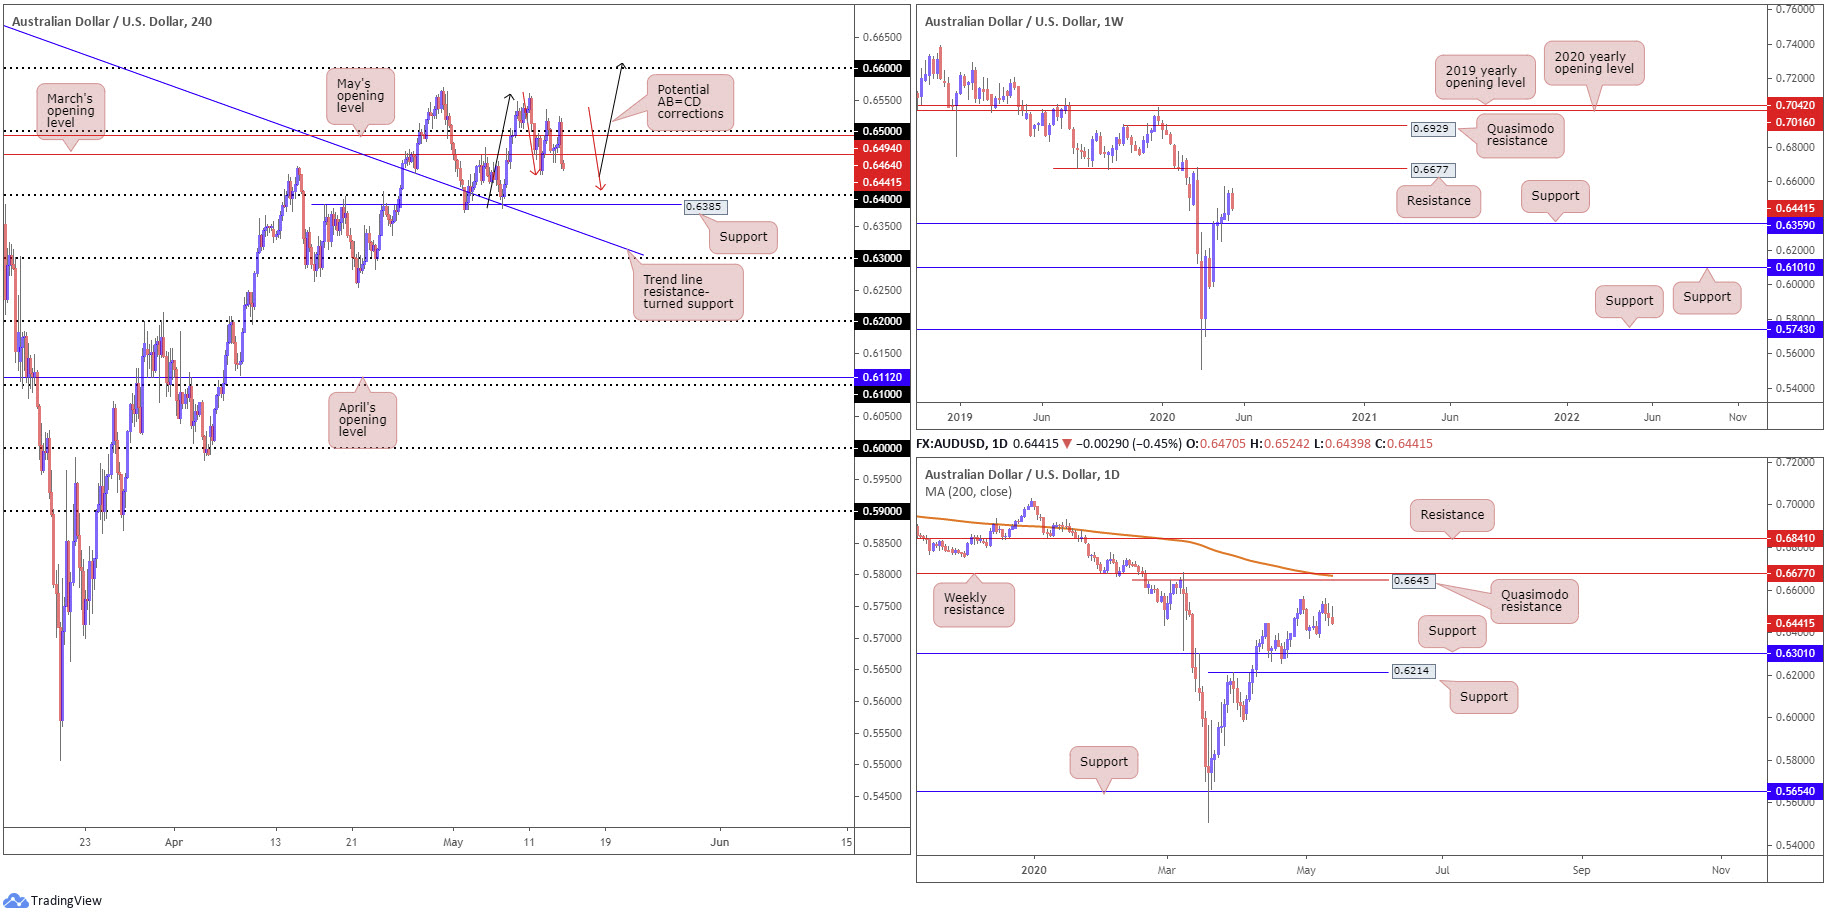
The Australian dollar failed to sustain gains north of 0.65 against its US counterpart Wednesday, ending the session 0.50% in the red. Also note we’re taking on ground beneath May’s opening level at 0.6494 and March’s opening level at 0.6464 on the H4 timeframe.
The US dollar index marched higher following Fed Chair Jerome Powell’s comments. This, coupled with a clear-cut risk-off narrative, weighed on the Aussie dollar, with H4 price threatening to drop towards 0.64, followed by support coming in at 0.6385. Further downside would also bring a bullish AB=CD correction (red arrows) to the fore at 0.6407.
Across the page on the weekly timeframe, we can see upside momentum has diminished this week, suggesting we may witness a retest form at support from 0.6359. To the upside, nevertheless, traders’ crosshairs are still likely fixed on resistance at 0.6677. Overall, longer-term traders will also note we have been trading lower since the start of 2018, therefore recognising that current upside from multi-year lows at 0.5506 could simply be a bulky pullback before pressing lower.
From the daily timeframe, local support is seen around 0.6370ish, with the possibility of the April 30 high at 0.6569 serving up resistance. Major resistance can be seen at a Quasimodo formation from 0.6645, parked just ahead of the weekly resistance level mentioned above at 0.6677 and a 200-day SMA (orange – 0.6667). Beneath 0.6370, 0.6301 is noted as possible support.
Areas of consideration:
0.64 boasts appeal today, bringing together H4 support at 0.6385 and a bullish AB=CD correction (red arrows) at 0.6407. Therefore, a response from this psychological boundary could be seen should we drop lower.
Those who feel we may be in for lower prices today may also look at bearish scenarios towards 0.64. As such, a retest at 0.6464 could be of interest.
USD/JPY:
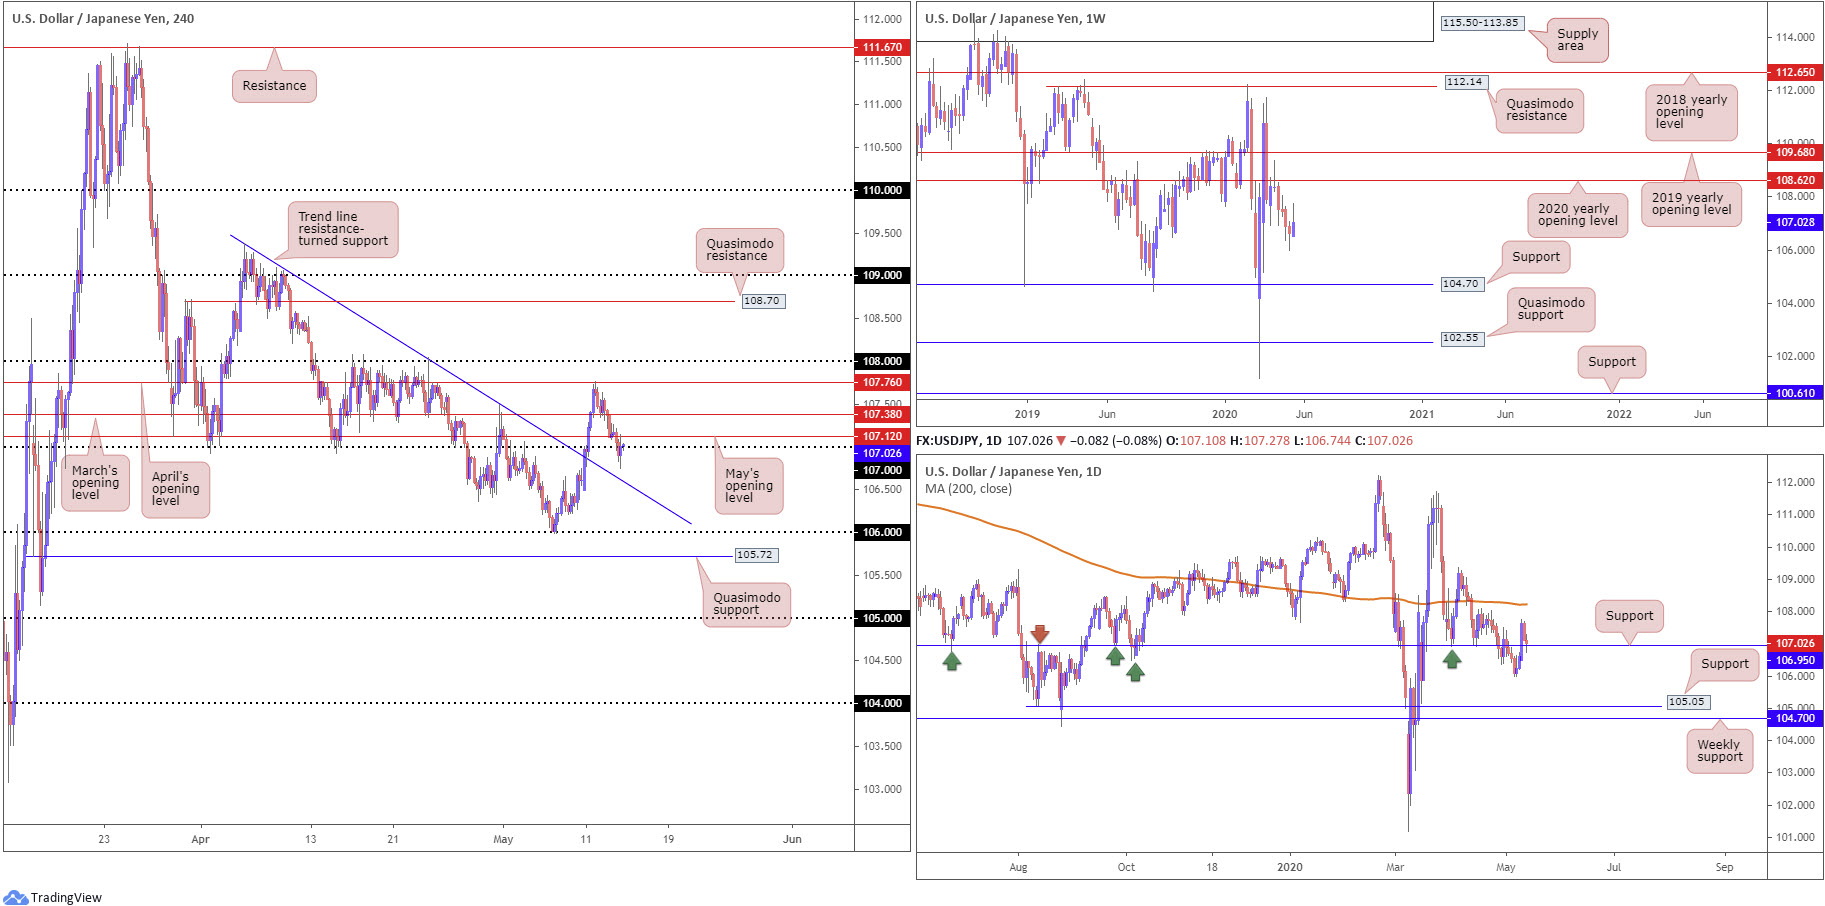
The US dollar extended Tuesday’s slide against the Japanese yen Wednesday from near three-week tops, dipping a toe in waters south of 107. Interestingly, buyers are attempting to glean support off a daily base from 106.95, though upside attempts are currently capped by May’s opening level at 107.12 on the H4 timeframe. Technicians may also find interest in noting the trend line resistance-turned support, extended from the high 109.38.
The weekly timeframe continues to reflect a bearish tone south of the 2020 yearly opening level at 108.62, with 104.70 positioned as the next support target. Technical action on the daily timeframe, as touched on above, saw price shake hands with support at 106.95. This throws the 200-day SMA (orange – 108.22) into the firing range as possible resistance.
Areas of consideration:
Daily support at 106.95 and the 107 handle on the H4 timeframe could provide a feasible floor, and may be enough to tempt a recovery today. Conservative buyers, however, may seek a H4 close above March’s opening level at 107.38 before engaging.
Short sales beneath 107 is an alternative option, though a daily close under 106.95 may be necessary before pulling the trigger.
USD/CAD:
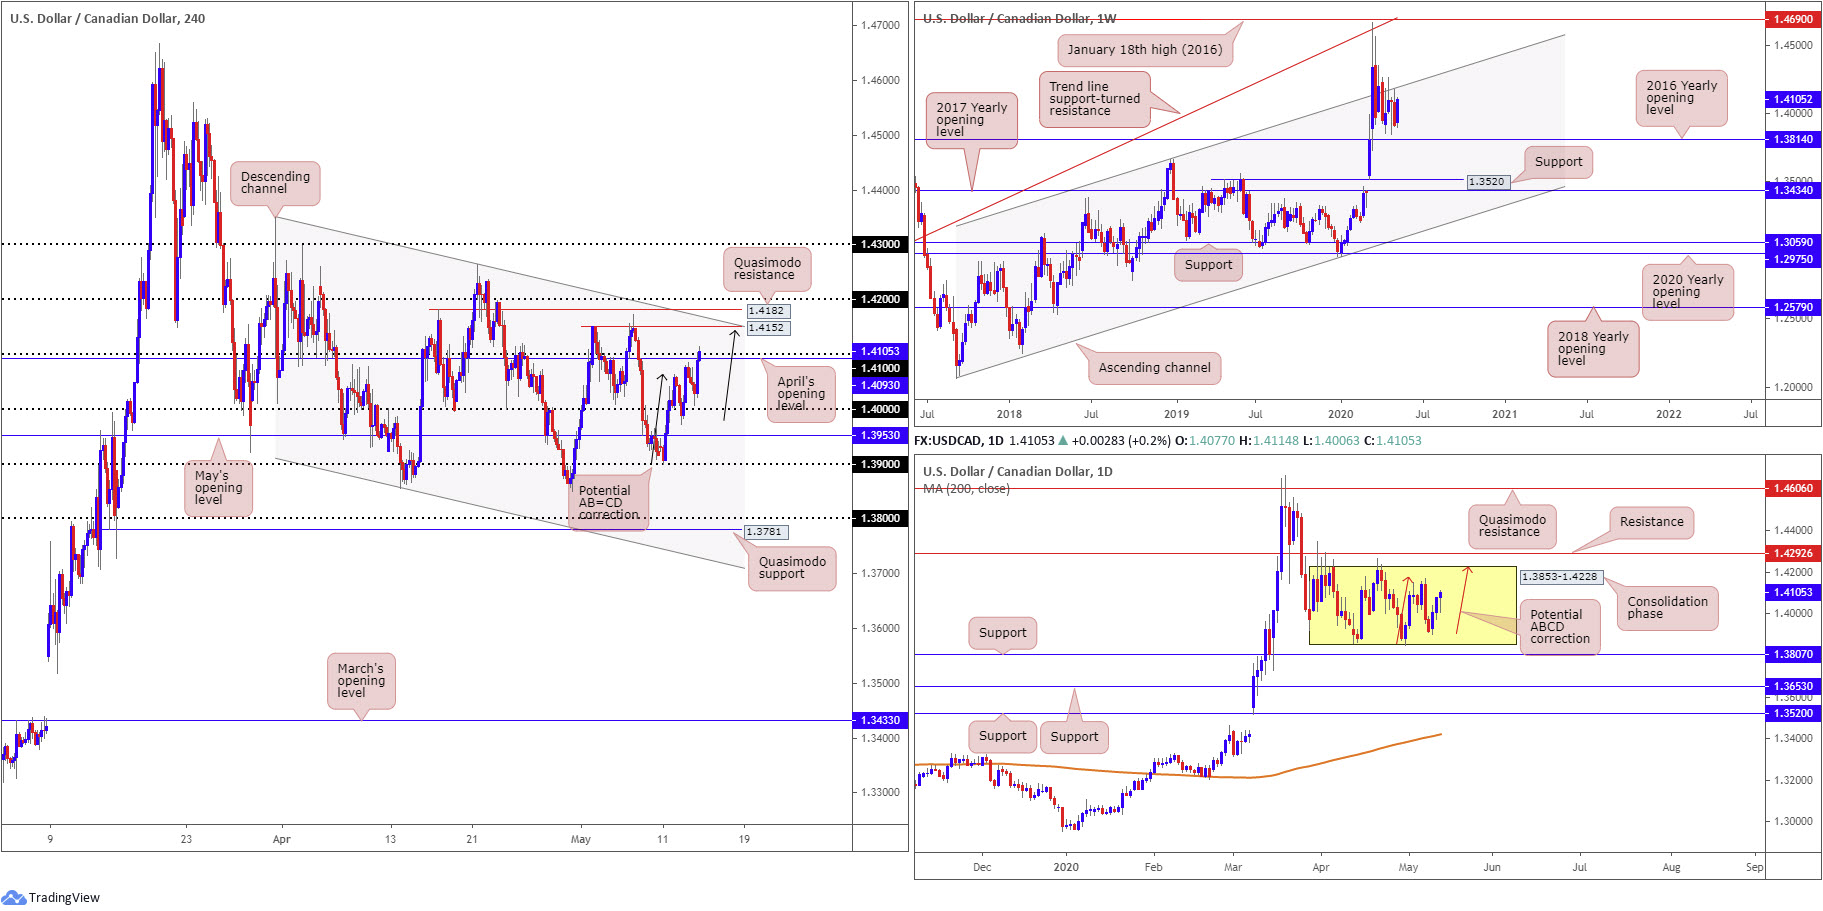
Against the Canadian dollar, the US dollar dipped to lows at 1.4006 Wednesday, before chalking up a v-shaped recovery and marginally testing waters above April’s opening level at 1.4093 and the 1.41 handle. Beyond 1.41, traders will have eyes on two Quasimodo resistances at 1.4152 and 1.4182, along with a channel resistance, taken from the high 1.4349. Additionally, further upside may bring with it an AB=CD bearish correction (black arrows) at 1.4144.
Price structure on the weekly timeframe is seen nearing a long-term channel resistance, taken from the high 1.3661. In the event of moves lower from this angle, sellers face possible support off the 2016 yearly opening level at 1.3814. The said base stands in a reasonably healthy position as, overall, we’ve been trending higher since September 2017.
Since kicking off April, we have been carving out a consolidation between 1.3853-1.4228 on the daily timeframe. Inside of these walls, traders may also note a possible ABCD correction to the top edge of the range. Areas outside of this base can be found at resistance drawn from 1.4292 and support at 1.3807. The 200-day SMA (orange – 1.3420), as you can probably see, has been drifting northbound since March.
Areas of consideration:
Follow-through moves above 1.41 should not surprise today, owing to H4 Quasimodo resistances seen at 1.4152/1.4182, the channel resistance and AB=CD pattern at 1.4146 forming tight confluence.
As a result, we may see intraday breakout buyers attempt a stab at establishing some ground above 1.41, while active sellers will likely be looking to engage with 1.4152/1.4182.
USD/CHF:
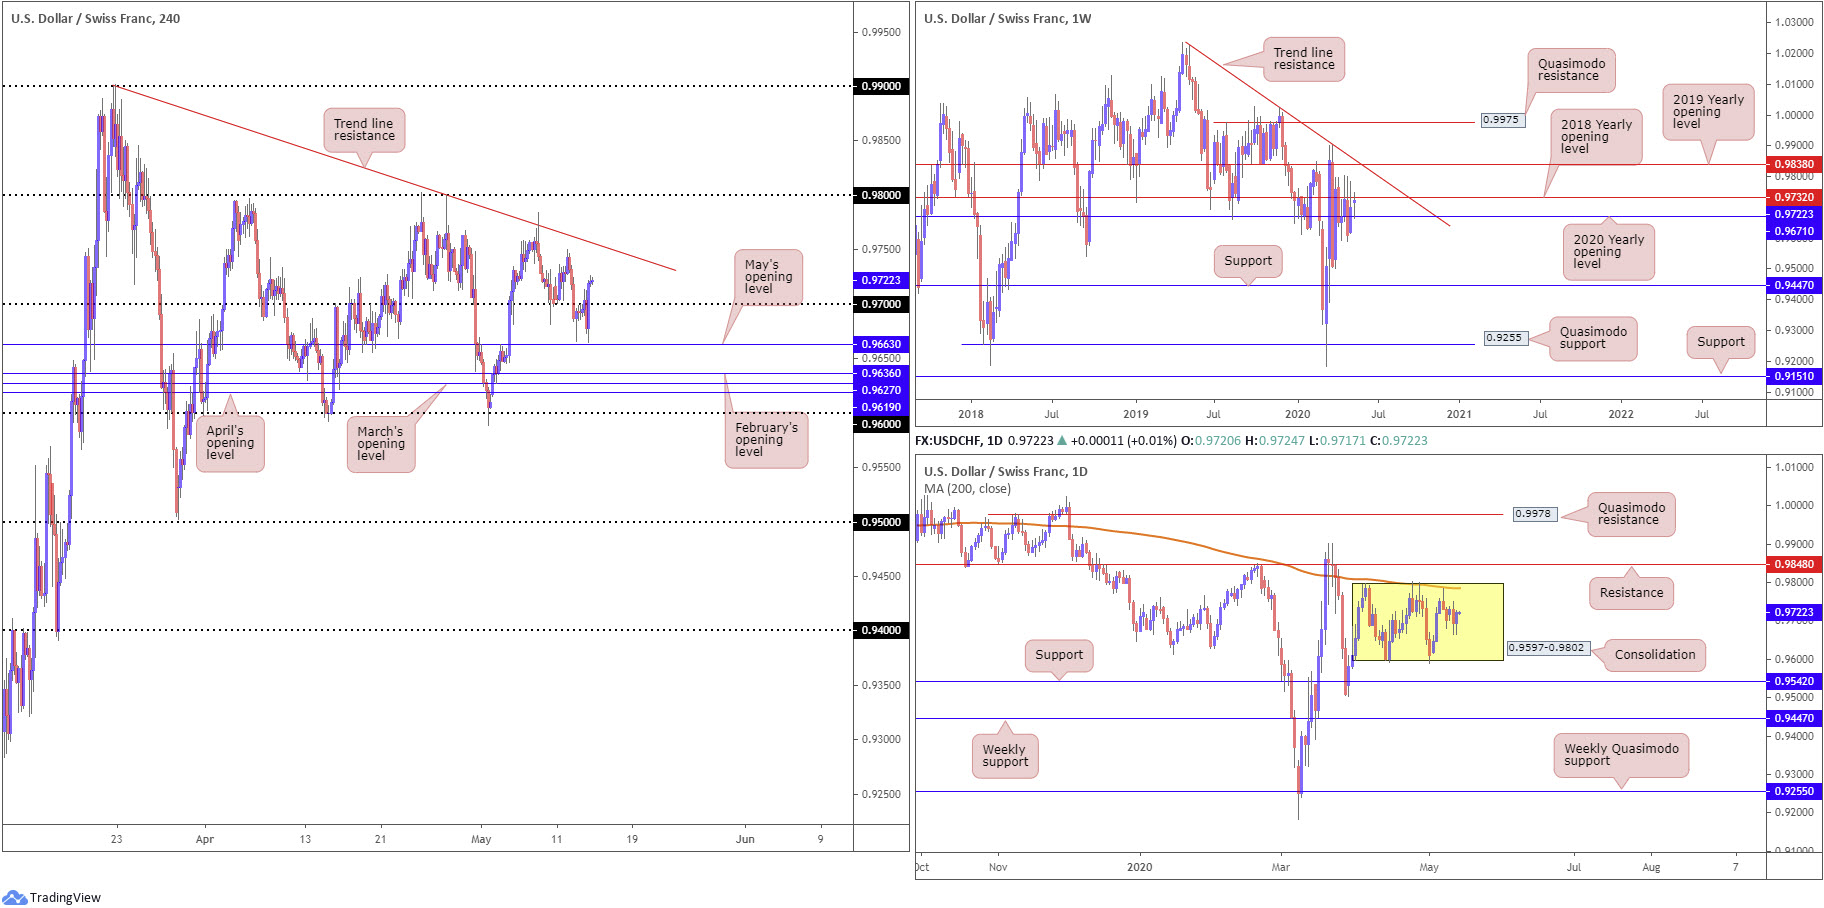
Leaving May’s opening level at 0.9663 unchallenged, USD/CHF bulls entered an offensive phase Wednesday. Broad-based USD upside emerged following Fed Chair Jerome Powell dismissing negative rates, consequently sending USD/CHF over 0.97.
H4 trend line resistance, taken from the high 0.9900, is back in sight, with a violation perhaps uncovering 0.98. Although the path north is reasonably clear on the H4 timeframe this morning, longer-term charts point out possible resistance off the 2018 yearly opening level at 0.9732. After failing to sustain gains beyond this level over recent weeks, traders are likely expecting the base to hold, maybe forcing a retest at the 2020 yearly opening level from 0.9671, with a break throwing light on the possibility of a run to support coming in at 0.9447.
Price action on the daily timeframe continues to hover mid-range within a month-long consolidation between 0.9597-0.9802. Note the 200-day SMA (orange – 0.9785) is also seen circling the upper edge of the said range. Outside of the consolidation, we see resistance at 0.9848 while support is found at 0.9542.
Areas of consideration:
Having noted weekly price gripping the underside of resistance at 0.9732, buyers long the break above 0.97 on the H4 timeframe may fall flat. The flip side to this, of course, is daily price may attempt to draw in the upper boundary of its current range around 0.98 before rotating lower.
Should we reach 0.98, this base may hold active sellers, given its connection to the upper edge of the current daily range. Therefore, 0.98 could serve as not only an ideal take-profit target for longs above 0.97, but also as a platform for sellers.
Dow Jones Industrial Average:
US equities dipped further Wednesday as investors digested Fed Powell’s comments concerning economic risks from COVID-19. The Dow Jones Industrial Average erased 516.81 points, or 2.17%; the S&P 500 dropped by 50.12 points, or 1.75%, and the tech-heavy Nasdaq 100 concluded lower by 112.37 points, or 1.23%.
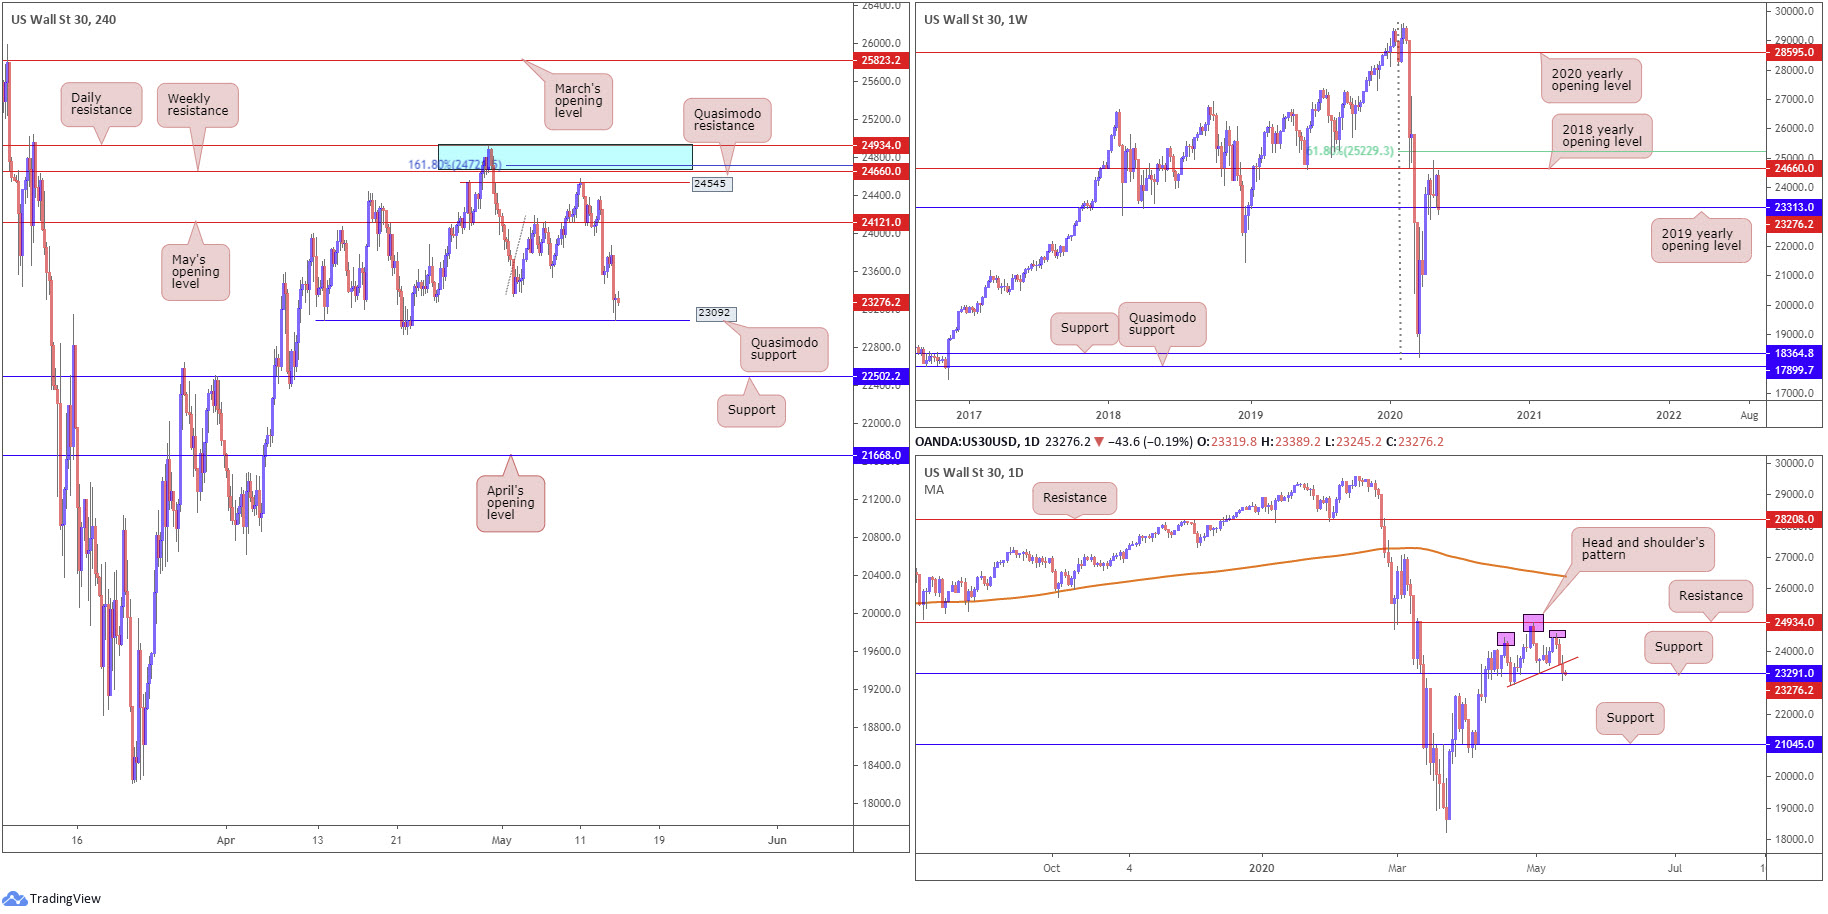
Kicking things off from the weekly timeframe this morning, we can see price recently shook hands with the 2019 yearly opening level at 23313, after failing to overturn the 2018 yearly opening level from 24660. A violation of 23313 shines light on support from 18364.
Crossing to the daily timeframe, we appear to have formed a head and shoulder’s top formation off resistance at 24934. Wednesday confirmed the aforesaid pattern, breaking its neckline from 22934, which resulted in price crossing swords with support at 23291. Ultimately, conservative sellers are likely waiting for a break of the said support before considering shorts based on the head and shoulder’s pattern, which could see support at 21045 eventually brought into the mix.
Interestingly, H4 price recently produced a hammer candlestick pattern off Quasimodo support at 23092.
23092 aligns closely with weekly support (2019 yearly opening level) at 23313 and daily support coming in at 23291. Nevertheless, if we continue to probe lower, traders are urged to pencil in H4 support at 22502 as the next downside target.
Areas of consideration:
While further buying off H4 Quasimodo support at 23092 is not out of the question, there will already be sellers short this market based on the daily head and shoulder’s pattern. As highlighted above, though, there will also be sellers waiting for daily support at 23291 to be overturned before pulling the trigger.
Moves off 23092 may eventually see May’s opening level at 24121 retested, whereas moves beyond 23092 has H4 support at 22502 to target.
XAU/USD (GOLD):
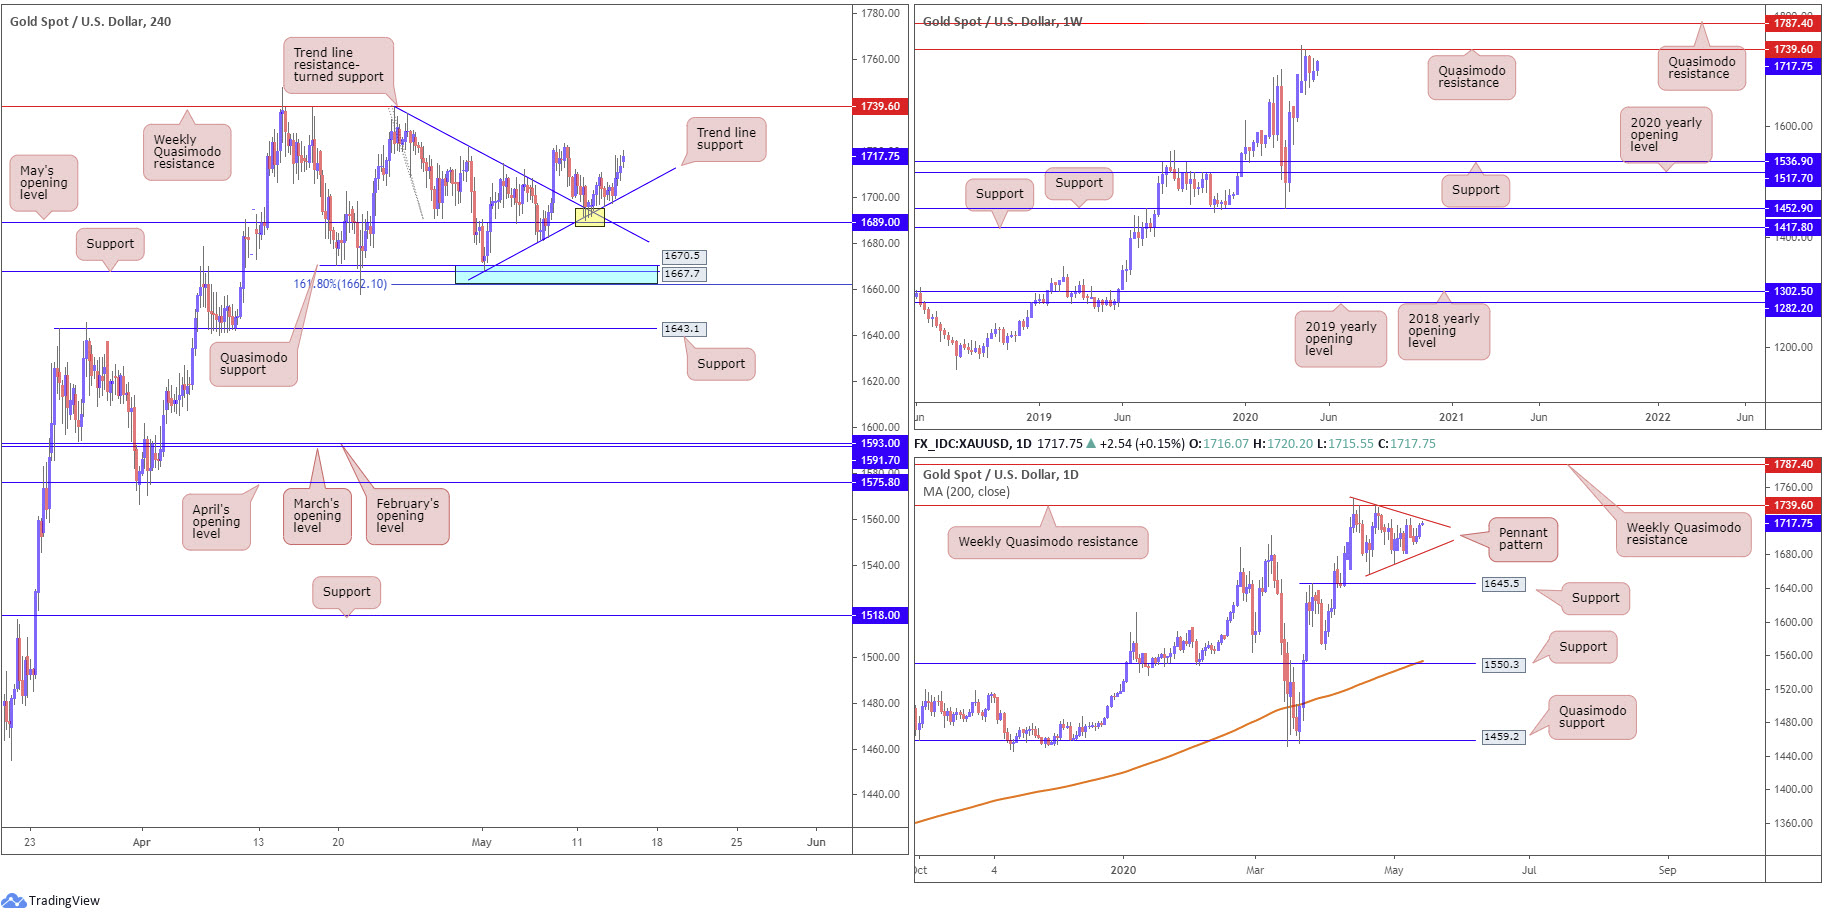
As covered in recent analysis, price action shook hands with two merging trend line supports (1739.1/1668.0) on the H4 timeframe, plotted just north of May’s opening level at 1689.0 (yellow). Sustained buying from current levels could see an attack on the 1723.5 May 8 high, with follow-through moves likely targeting weekly Quasimodo resistance at 1739.6.
South of the current H4 supports, traders may recognise familiar support (blue), comprised of a 161.8% Fibonacci extension point at 1662.1, support at 1667.7 and Quasimodo support at 1670.5.
Buyers and sellers on the weekly timeframe, however, continue to battle for position around the underside of Quasimodo resistance at 1739.6. Downside from this region echoes the prospect of eventually reaching support at 1536.9, while a breach of 1739.6 shifts focus towards another layer of Quasimodo resistance at 1787.4. It may also interest some traders to note the primary trend on gold has faced a northerly trajectory since 2016.
In similar fashion to the weekly timeframe, the weekly Quasimodo formation at 1739.6 is also posted as prominent resistance on the daily chart. The difference can be seen with reference to supports: the next support target on the daily timeframe falls in at 1645.5. Pattern traders may also acknowledge a forming pennant pattern at the underside of the weekly Quasimodo base, established from a high of 1747.7 and a low of 1658.1.
Areas of consideration:
The area of confluence on the H4 timeframe around May’s opening level at 1689.0 was a noted base to keep an eye on. Well done to those who managed to jump aboard the recent advance. Traders will likely be looking to reduce risk to breakeven around 1723.5, with an initial take-profit target at 1739.6.
Printing a H4 close above 1739.6 will see longer-term breakout buyers make a show, perhaps taking aim at weekly Quasimodo resistance from 1787.4 as an initial target. This would also likely seal a daily close above the upper boundary of the current daily pennant pattern, adding fuel to any upside.
The accuracy, completeness and timeliness of the information contained on this site cannot be guaranteed. IC Markets does not warranty, guarantee or make any representations, or assume any liability regarding financial results based on the use of the information in the site.
News, views, opinions, recommendations and other information obtained from sources outside of www.icmarkets.com.au, used in this site are believed to be reliable, but we cannot guarantee their accuracy or completeness. All such information is subject to change at any time without notice. IC Markets assumes no responsibility for the content of any linked site.
The fact that such links may exist does not indicate approval or endorsement of any material contained on any linked site. IC Markets is not liable for any harm caused by the transmission, through accessing the services or information on this site, of a computer virus, or other computer code or programming device that might be used to access, delete, damage, disable, disrupt or otherwise impede in any manner, the operation of the site or of any user’s software, hardware, data or property.
[1] https://www.bnnbloomberg.ca/powell-slams-door-on-trump-s-negative-rates-gift-1.1435787


