
EUR/USD:
Traders certainly had plenty to chew on Wednesday.
Although the FOMC minutes were in high anticipation, no real surprises emerged with the main takeaway being the majority seeing rates on hold through 2019. The dollar subsequently picked up some lost ground into the event, though was nothing to get excited about. In its place, real movement came down to the ECB. The central bank repeated it expects rates to be kept at present levels through the end of 2019, and also reiterated guidance on reinvestments.
Despite central bank involvement, the EUR/USD heads into the US close only marginally higher by 0.12%.
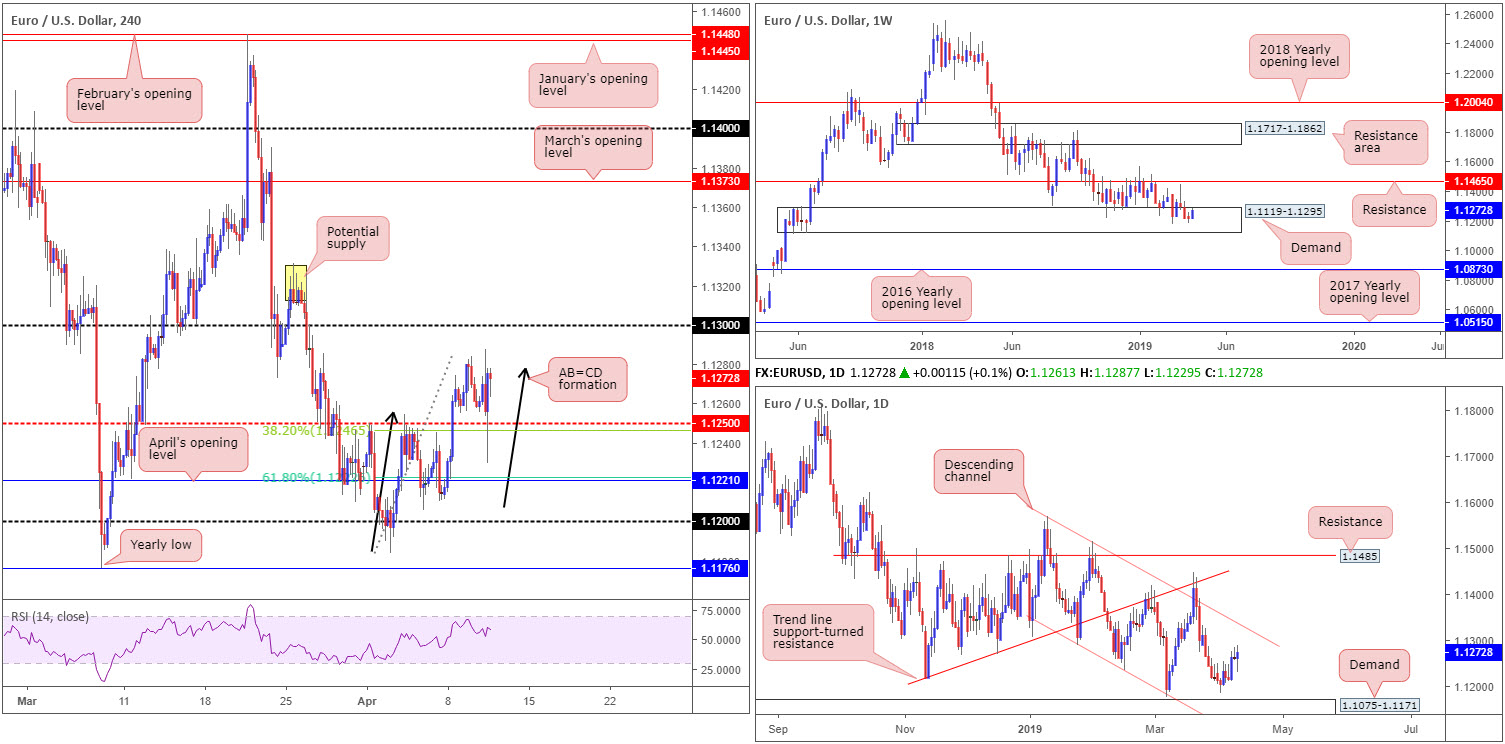
Technically, the H4 candles still ‘appear’ to be respecting an AB=CD (black arrows) bearish pattern around 1.1275. Recent action, as you can see though, whipsawed through 1.1250 and the nearby 38.2% Fibonacci support value at 1.1246 (taken from the AB=CD legs A-D) to the downside (considered the first take-profit target from the AB=CD formation). To the upside, nevertheless, we still have the psychological mark 1.13 in sight, followed closely by supply at 1.1331/1.1310 (yellow).
On more of a broader perspective, weekly flow remains unchanged within the parapets of demand at 1.1119-1.1295, with the candles attempting to breakout of the zone. Overall, though, the long-term trend on the weekly timeframe continues to face a southerly direction, with traders’ crosshairs likely fixed on 1.1176 as the next viable support: the 2019 yearly low.
Leaving demand at 1.1075-1.1171 (an area glued to the underside of the current weekly demand) unchallenged on the daily timeframe, Monday’s daily candle was certainly full of vigour. As zealous as the buyers were, though, upside has somewhat diminished Tuesday and Wednesday. The next port of call to the upside, should we continue to grind higher, has channel resistance (taken from the high 1.1569) in view.
Areas of consideration:
Having noted weekly flows holding within the walls of demand as well as daily activity displaying scope to press for higher ground, 1.13 on the H4 timeframe is likely to be tested today/tomorrow. On account of this, the research team lacks conviction to the downside in this market for the time being.
In terms of long opportunities, traders are also urged to tread carefully, despite coming from weekly demand. Above 1.13 – a likely area traders have their eyes on for breakout setups – H4 supply at 1.1331/1.1310 (yellow) is visible, which happens to coincide with the aforementioned daily channel resistance.
It appears, according to our technical studies, the EUR/USD (medium term) is caught between a rock and a hard place. Therefore, neither a long nor short seems attractive at this time.
Today’s data points: US PPI m/m; US Core PPI m/m US Unemployment Claims; FOMC Members Clarida, Williams, Bullard and Bowman speak.
GBP/USD:
GBP bias was to the upside amid a slightly stronger EUR and weaker GBP Wednesday. Cable is currently seen as a ‘buy on dips’ as traders price out no-deal downside, along with an extension likely to be signed-off on by the end of this week.
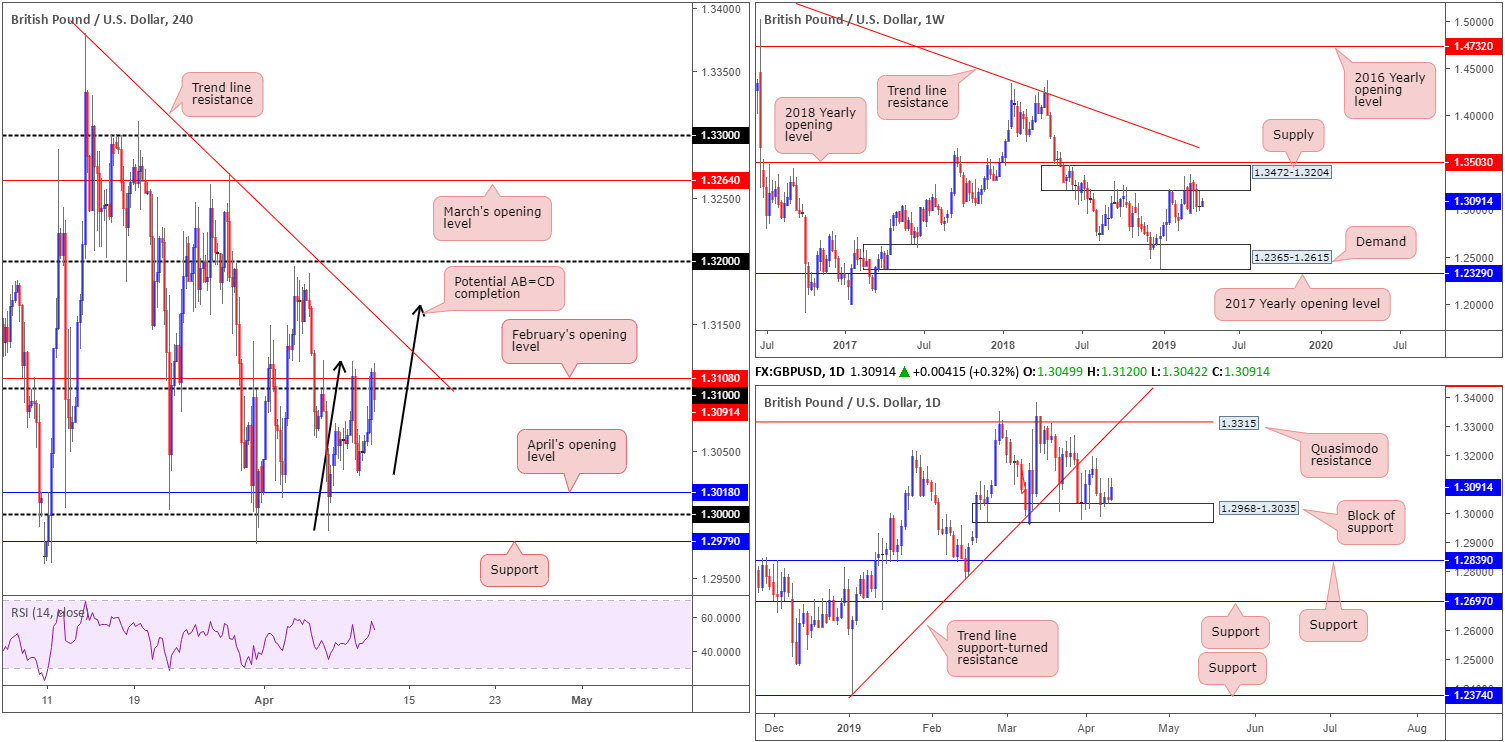
From a technical perspective, though, higher-timeframe analysis has the weekly candles fading the underside of supply at 1.3472-1.3204. Since the end of February this area has been home to many traders as price flips between gains/losses. The flip side to this, daily action remains teasing a block of support at 1.2968-1.3035. Buying from here is likely to find resistance around trend line support-turned resistance (extended from the low 1.2373), closely followed by a Quasimodo resistance plotted at 1.3315.
The key observation on the H4 timeframe has the unit crossing swords with 1.31 which dovetails nicely with February’s opening level nearby at 1.3108. Overhead, the research team also notes nice-looking trend line resistance (etched from the high 1.3380), a potential AB=CD bearish formation at 1.3165 and the round number 1.32. Support, on the other hand, has Tuesday’s low 1.3030 on the radar, tailed closely by April’s opening level at 1.3018, key figure 1.30 and support priced in at 1.2979.
Areas of consideration:
With higher-timeframe structures offering an indecisive picture at present, traders are left with H4 levels to work with today.
Selling from 1.31 is an option, targeting noted H4 supports, though do remain cognizant of the possibility price action may want to bring in fresh sellers from the nearby trend line resistance, also an area sellers potentially reside.
Traders interested in entering long from the 1.30 region, according to our technical studies, bring with them a clear block of daily support at 1.2968-1.3035 backing up the trade, along with nearby H4 supports highlighted above. Though this is likely to encourage buyers, the main concern remains on the weekly timeframe: supply at 1.3472-1.3204. This area is proving a troublesome beast to overcome and, therefore, could weigh on any longs.
In the event weekly selling eventually pressures the market lower and the H4 candles overthrow 1.30 and nearby support at 1.2979, the next area of interest can be seen around demand (not visible on the screen) pencilled in at 1.2891-1.2926 (also holds the 1.29 handle within its walls).
Irrespective of the H4 level selected, waiting for additional confirmation to form prior to pulling the trigger is recommended. This is, aside from a long out of the 1.30ish area which has a connection to daily structure, due to limited higher-timeframe convergence being seen.
Today’s data points: US PPI m/m; US Core PPI m/m US Unemployment Claims; FOMC Members Clarida, Williams, Bullard and Bowman speak.
AUD/USD:
The Australian dollar outperformed vs. its US counterpart Wednesday, concluding the session up 0.67%. The pair rose to its highest level since late Feb at 0.7174, though struggled to sustain gains as the greenback took advantage of the latest FOMC minutes.
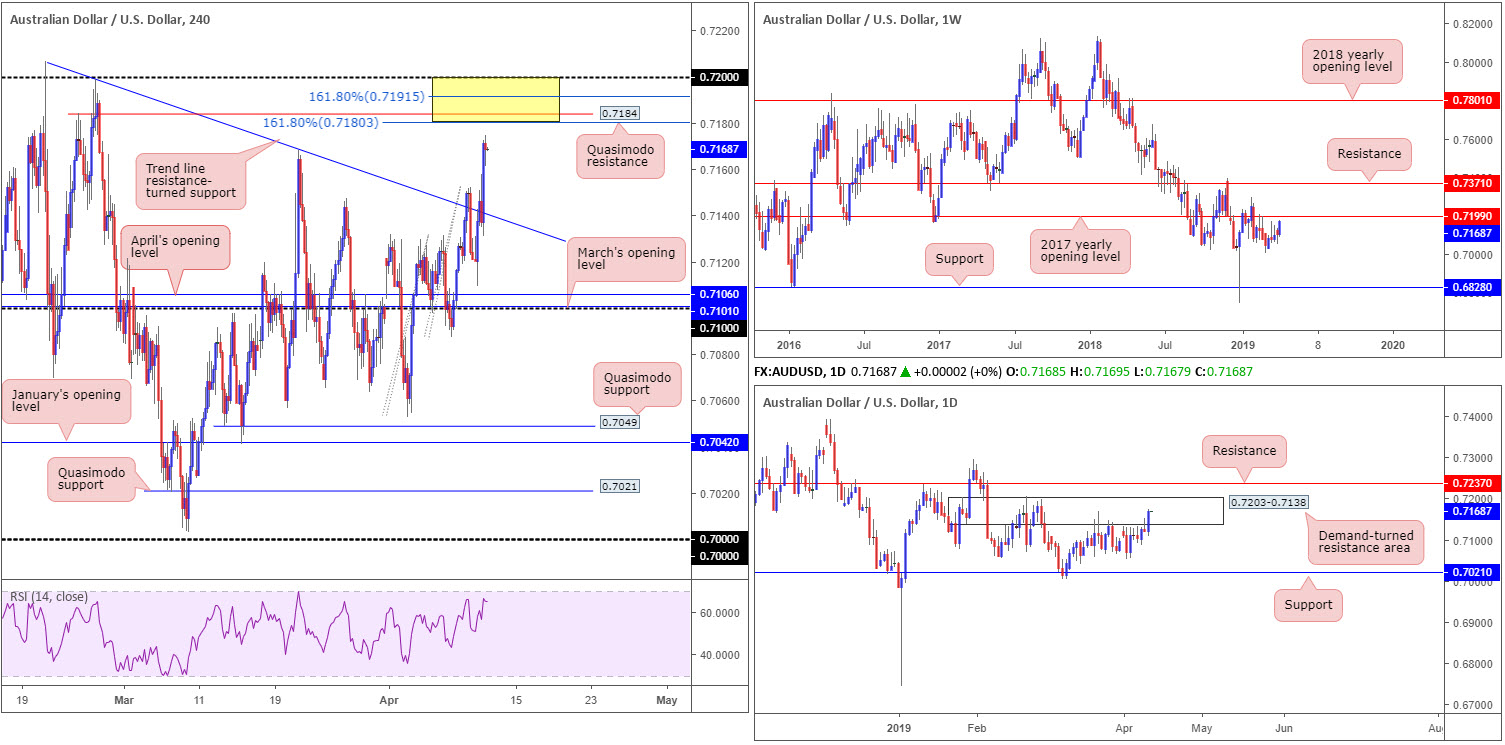
As the H4 trend line resistance (extended from the high 0.7206) filters into the background as possible support, the candles are now strategically positioned south of a rather interesting area of resistance on the H4 timeframe between 0.72/0.7180 (yellow). Comprised of the round number 0.72, two 161.8% Fibonacci ext. points at 0.7191 and 0.7180 and a Quasimodo resistance at 0.7184, we potentially have ourselves a robust base of resistance to work with today.
In addition to H4 confluence, traders may also want to acknowledge the 2017 yearly opening level at 0.7199 also included inside the zone on the weekly timeframe. Further to this, daily structure has a demand-turned resistance area at 0.7203-0.7138 in motion.
Areas of consideration:
In light of the clear-cut confluence on offer between 0.72/0.7180, a move lower from this neighbourhood is likely, targeting the trend line resistance-turned support (etched from the high 0.7206) as an initial take-profit zone. An entry short from 0.7180 and a stop-loss order placed a few points above 0.72 is an option. Conservative traders, however, may opt to wait and see if H4 price action offers up a bearish candlestick pattern before committing, likely due to the threat of a fakeout developing through 0.72 (common viewing around round numbers).
Today’s data points: China CPI y/y and PPI y/y; RBA Assist Gov. Debelle Speaks; US PPI m/m; US Core PPI m/m US Unemployment Claims; FOMC Members Clarida, Williams, Bullard and Bowman speak.
USD/JPY:
Despite spending a large portion of the day consolidating north of 111, the H4 candles, as you can see, gave way to lower levels Wednesday. The sudden drop in price, which took the unit sub 111, is likely attributable to declining US Treasury bond yields – specifically the 10-year note recording losses of more than 1.00% – pointing out a sour market mood that ramped up demand for safe-haven assets: the Japanese yen.
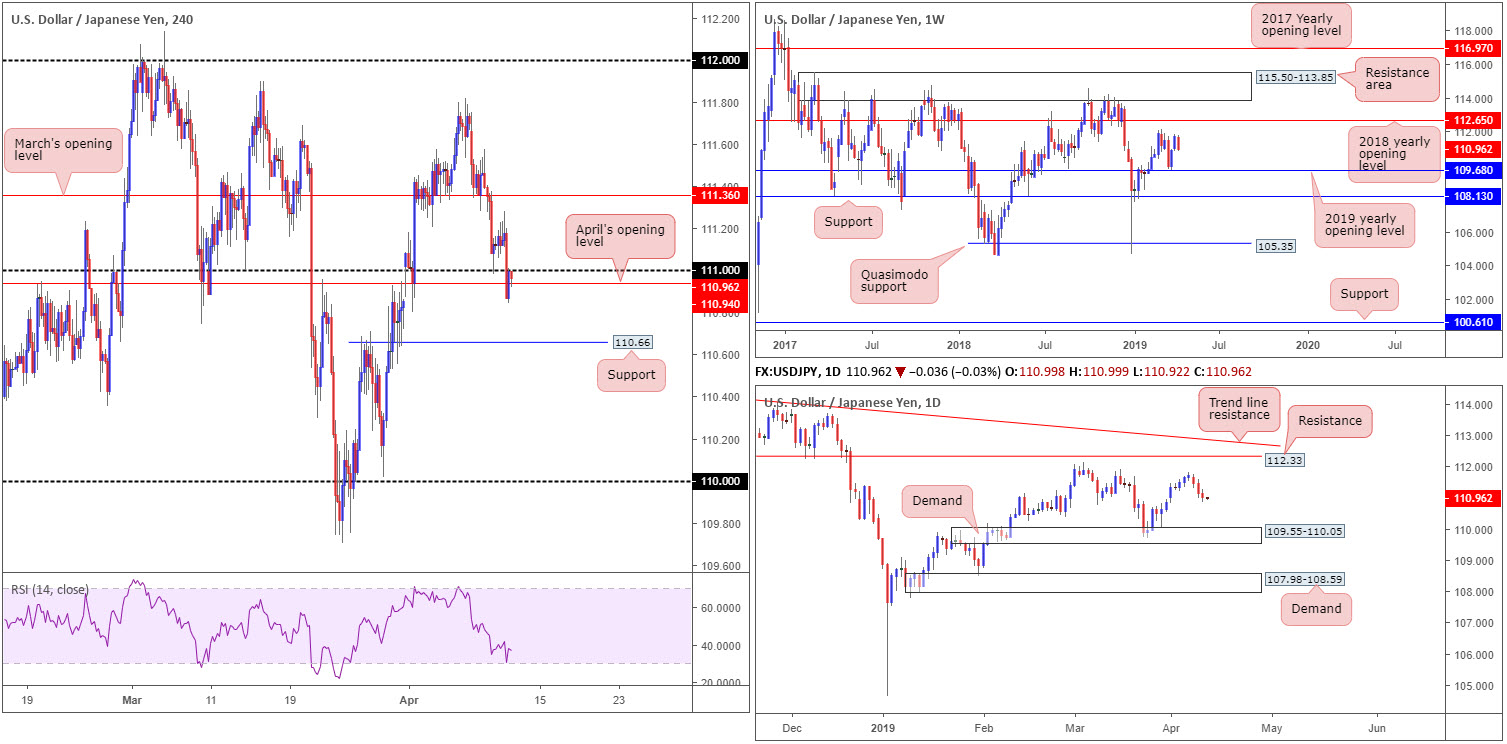
As of current price, the underside of 111 is being retested as resistance and, for now, is holding ground. Continued selling from 111 today could eventually call for a test of H4 support at 110.66. Beyond here, limited support is in view until reaching the 110 neighbourhood.
Structure on the weekly timeframe has the candles fading just south of the March 4 high at 112.13, shadowed closely by the 2018 yearly opening level priced in at 112.65. To the downside, the next point of interest falls in around the 2019 yearly opening level at 109.68.
In terms of where we stand on the daily timeframe, the March 4 high at 112.13 mentioned above on the weekly timeframe is also a discernible resistance on this scale, though the more prominent level falls in around 112.33, closely tailed by a long-standing trend line resistance (etched from the high 114.55). Downside, on the other hand, could possibly draw as far south as demand at 109.55-110.05.
Areas of consideration:
With little in terms of nearby structure on the higher timeframes, follow-through selling could take shape from 111 and shake hands with 110.66 today. Assuming a H4 (or H1) bearish candlestick formation presents itself, a short-term sell from 111 might be something to consider today (entry and risk levels can be determined according to candlestick structure). Remember, beyond 110.66 we have room to move as far south as 110 on all three timeframes.
Today’s data points: US PPI m/m; US Core PPI m/m US Unemployment Claims; FOMC Members Clarida, Williams, Bullard and Bowman speak.
USD/CAD:
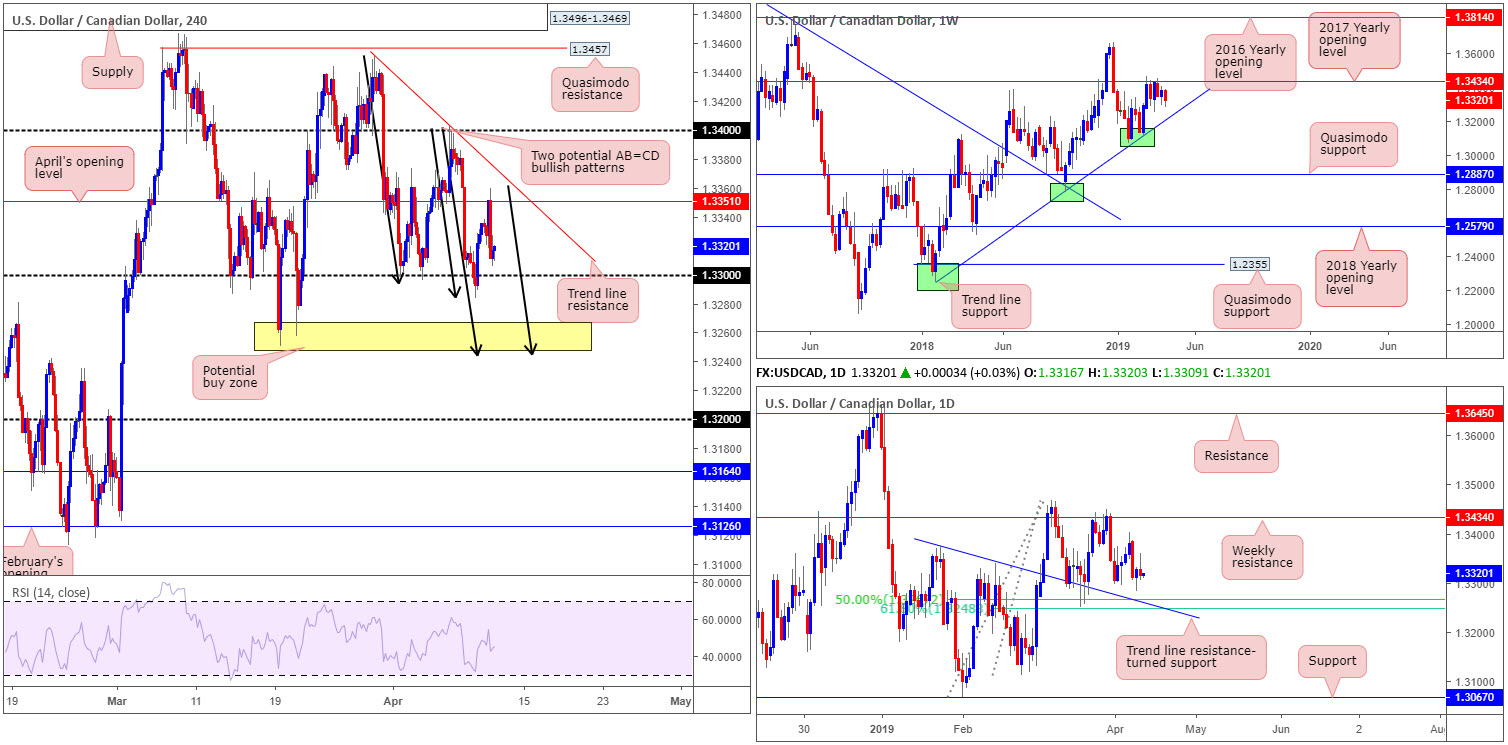
Recent movement witnessed H4 price cross paths with the underside of April’s opening level at 1.3351 and turn lower. Selling from this point, exacerbated by stronger WTI prices above $64, bottomed a few points north of 1.33, down 0.09% on the day. Beyond 1.33, the research team has eyes on the yellow zone coming in at 1.3248/1.3267.
Expanding the viewpoint, the daily timeframe reveals price action basing ahead of a 50.0% support at 1.3267. Note this barrier also happens to merge closely with a 61.8% Fibonacci support at 1.3248 and a trend line resistance-turned support (extended from the high 1.3375). Weekly movement, however, is engaged closely with notable resistance at 1.3434 (the 2017 yearly opening level) following a dominant push higher from a meaty trend line support (taken from the low 1.2247). Should we continue to push lower, there’s a strong chance we’ll see the said trend line support re-enter the fold.
Areas of consideration:
H4 price is, as mentioned above, testing waters north of 1.33. Below this barrier, 1.3248/1.3267 is of interest. The rationale behind this is the area forms by way of the current daily Fibonacci supports and has the 1.3250 March 19 low seen on the H4 plotted within. Further adding to this, we also have two AB=CD bullish patterns completing around the lower edge of the said H4 zone (black arrows).
The only grumble to buying 1.3248/1.3267 is weekly price shows room to push beneath this area to bring in the aforementioned weekly trend line support. For that reason, traders may opt to wait and see if H4 price chalks up a bullish candlestick formation before pulling the trigger. This helps avoid an unnecessary loss and also provides entry/risk levels to work with. In regard to upside targets 1.33 is a logical starting point.
Today’s data points: US PPI m/m; US Core PPI m/m US Unemployment Claims; FOMC Members Clarida, Williams, Bullard and Bowman speak; CAD Gov. Council Member Wilkins Speaks.
USD/CHF:
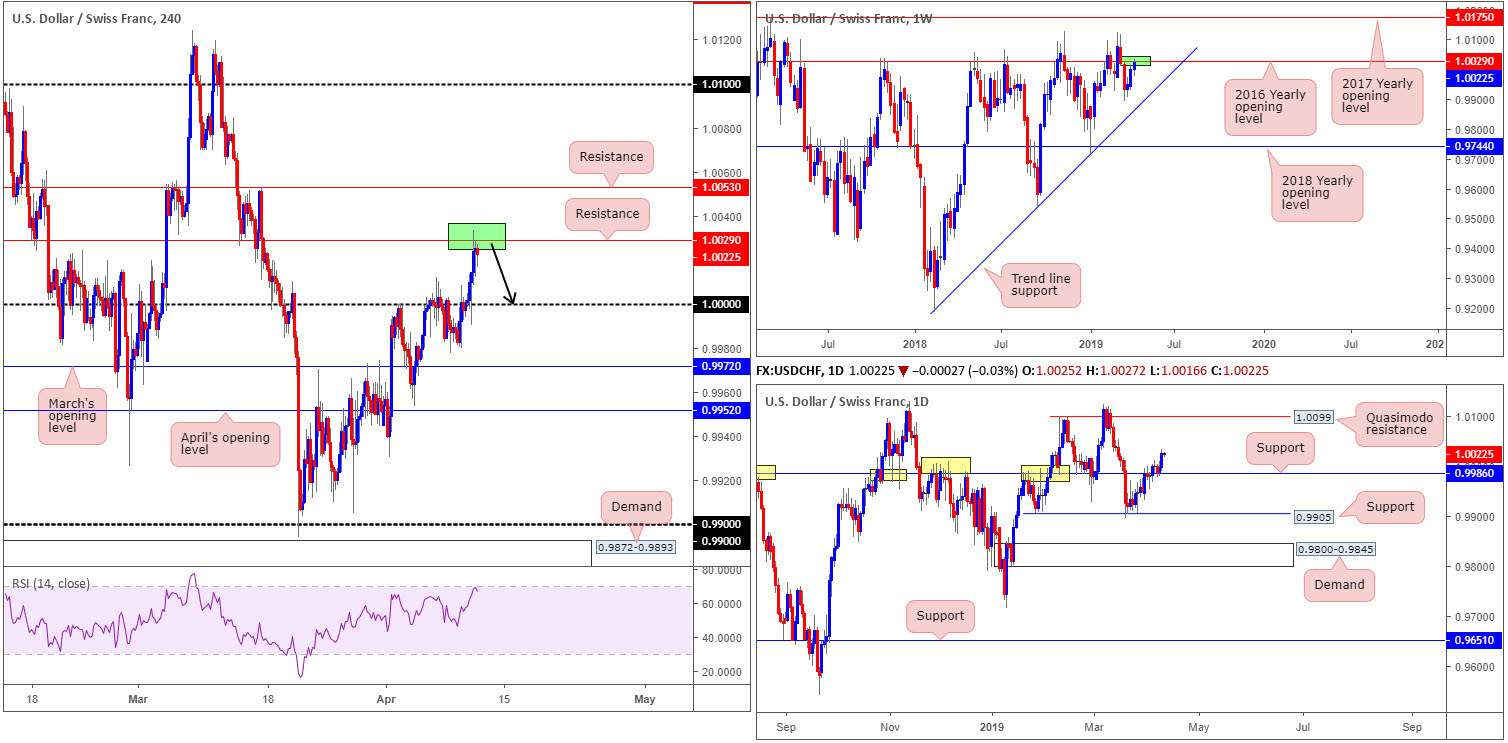
Recent development observed H4 price endure and finally conquer 1.0000 (parity) to the upside, consequently unravelling the path northbound towards two layers of resistance at 1.0053 and 1.0029. What’s notable from a technical standpoint is 1.0029 also represents the 2016 yearly opening level on the weekly timeframe, and the H4 RSI indicator is seen hovering just ahead of its overbought value. Therefore, the fact price action halted at 1.0029 should not really come as much of a surprise.
Contrary to above, the daily candles are establishing support above a notable base at 0.9986 – note this support and resistance level boasts strong historical significance dating as far back as November 2017. Should the buyers continue bidding this market higher from here, the next area of resistance in sight falls in around a Quasimodo base at 1.0099.
Areas of consideration:
As H4 price tests resistance at 1.0029, while acknowledging its connection with the weekly timeframe, a selloff from here may be on the cards. To help overcome the threat of a push higher on the daily timeframe, traders are urged to exercise patience and see if the H4 candles form anything relating to a bearish candlestick pattern. The first downside target from this region will, of course, be 1.0000, followed closely by daily support priced in at 0.9986. Traders considering a sell between 1.0029/1.0000 should also ensure risk/reward is factored into the trading decision.
Today’s data points: US PPI m/m; US Core PPI m/m US Unemployment Claims; FOMC Members Clarida, Williams, Bullard and Bowman speak.
Dow Jones Industrial Average:
Outlook unchanged in view of lacklustre price movement.
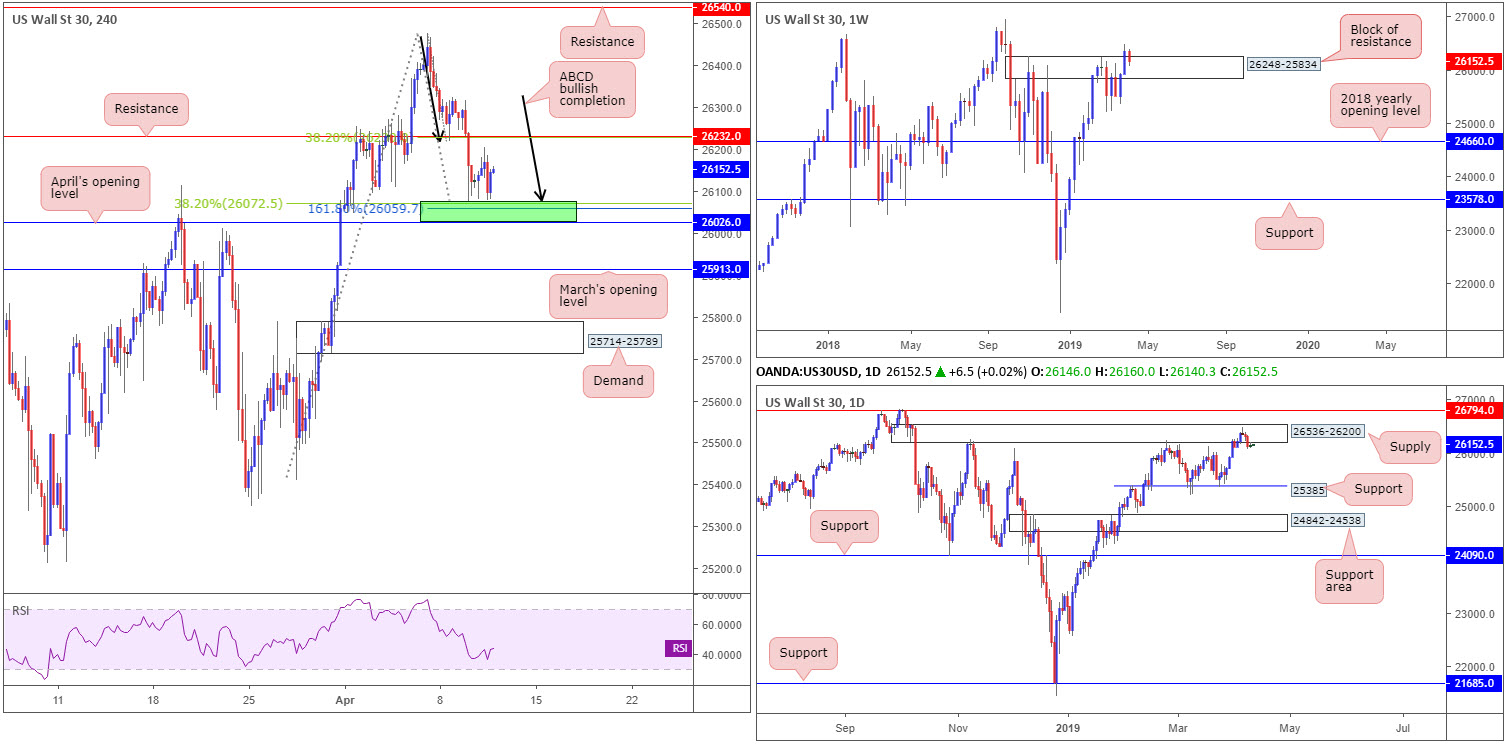
The DJIA concluded Wednesday mixed as traders attempted to digest ECB and FOMC movement. In view of yesterday’s lacklustre performance, much of Wednesday’s technical outlook remains unchanged going forward.
From a technical perspective, H4 price, after overthrowing support at 26232 (now acting resistance) completed an ABCD bullish pattern (black arrows) around 26081. Note this formation bottoms just ahead of April’s opening level at 26026, as well as a 38.2% Fibonacci support at 26072 and a 161.8% Fibonacci ext. point connected to the said ABCD at 26059.
In recent sessions, weekly price dominated a resistance area shown at 26248-25834, which, as you can see, is being retested as potential support now. Interestingly, though, daily supply at 26536-26200 entered the mix at the later stages of last week in the shape of a bearish pin-bar pattern, and is displaying signs of seller intent. The next downside support target from here falls in around 25385.
Areas of consideration:
Harmonic traders interested in trading the recently completed H4 ABCD bullish formation will likely find resistance emerge at 26232. Traders may want to acknowledge this level also boasts a 38.2% Fibonacci resistance value (considered the first take-profit target for the ABCD). Some traders may already be long this formation and have stops tucked beneath April’s opening level mentioned above at 26026. Others, however, could still be waiting on additional candlestick confirmation.
Today’s data points: US PPI m/m; US Core PPI m/m US Unemployment Claims; FOMC Members Clarida, Williams, Bullard and Bowman speak.
XAU/USD (GOLD):
Outlook unchanged in view of lacklustre price movement.
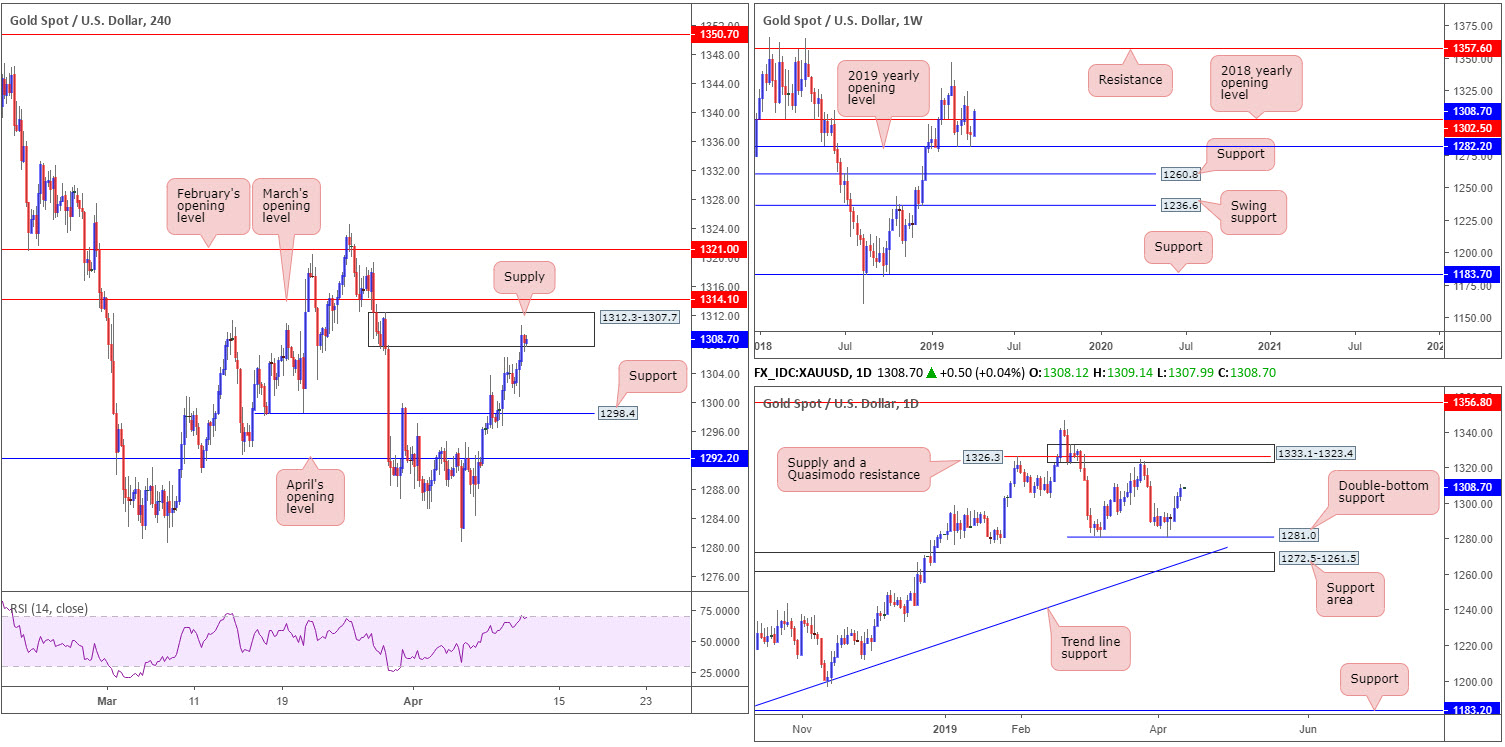
As the US dollar index lost grip of its 97.00 mark Wednesday, the price of gold explored higher ground for a third consecutive session. Evident from the H4 timeframe, the candles are currently shaking hands with a notable supply zone coming in at 1312.3-1307.7 (boasts strong downside momentum from its base), which is being confirmed by the RSI indicator testing overbought territory. Beyond here we also have resistance in the form of March’s opening level at 1314.1.
The broader picture reveals the yellow metal snapped back above its 2018 yearly opening level at 1302.5 in recent trade, largely bolstered by demand from the 2019 yearly opening level at 1282.2. Further buying is likely in this market, according to the daily timeframe. After bottoming around support at 1281.0, the yellow metal displays room to press as far north as a supply zone at 1333.1-1323.4, which incorporates a Quasimodo resistance within at 1326.3.
Areas of consideration:
Having observed both weekly and daily timeframes exhibit scope to track higher levels, selling from the H4 supply area at 1312.3-1307.7 is still considered a precarious move, given our technical studies. Could the analysis be incorrect and H4 price turn lower from the said supply? Of course it could, since we have yet to witness a weekly close form above 1302.5 to confirm its upside presence. A method to confirm seller intent from the H4 supply could be to wait and see if H4 price chalks up a bearish candlestick formation (entry and risk levels can also be determined according to the pattern’s structure). A short, assuming confirmation presents itself, has H4 support at 1298.4 to target, followed by April’s opening level at 1292.2.
The accuracy, completeness and timeliness of the information contained on this site cannot be guaranteed. IC Markets does not warranty, guarantee or make any representations, or assume any liability with regard to financial results based on the use of the information in the site.
News, views, opinions, recommendations and other information obtained from sources outside of www.icmarkets.com.au, used in this site are believed to be reliable, but we cannot guarantee their accuracy or completeness. All such information is subject to change at any time without notice. IC Markets assumes no responsibility for the content of any linked site. The fact that such links may exist does not indicate approval or endorsement of any material contained on any linked site.
IC Markets is not liable for any harm caused by the transmission, through accessing the services or information on this site, of a computer virus, or other computer code or programming device that might be used to access, delete, damage, disable, disrupt or otherwise impede in any manner, the operation of the site or of any user’s software, hardware, data or property.


