USD/JPY:
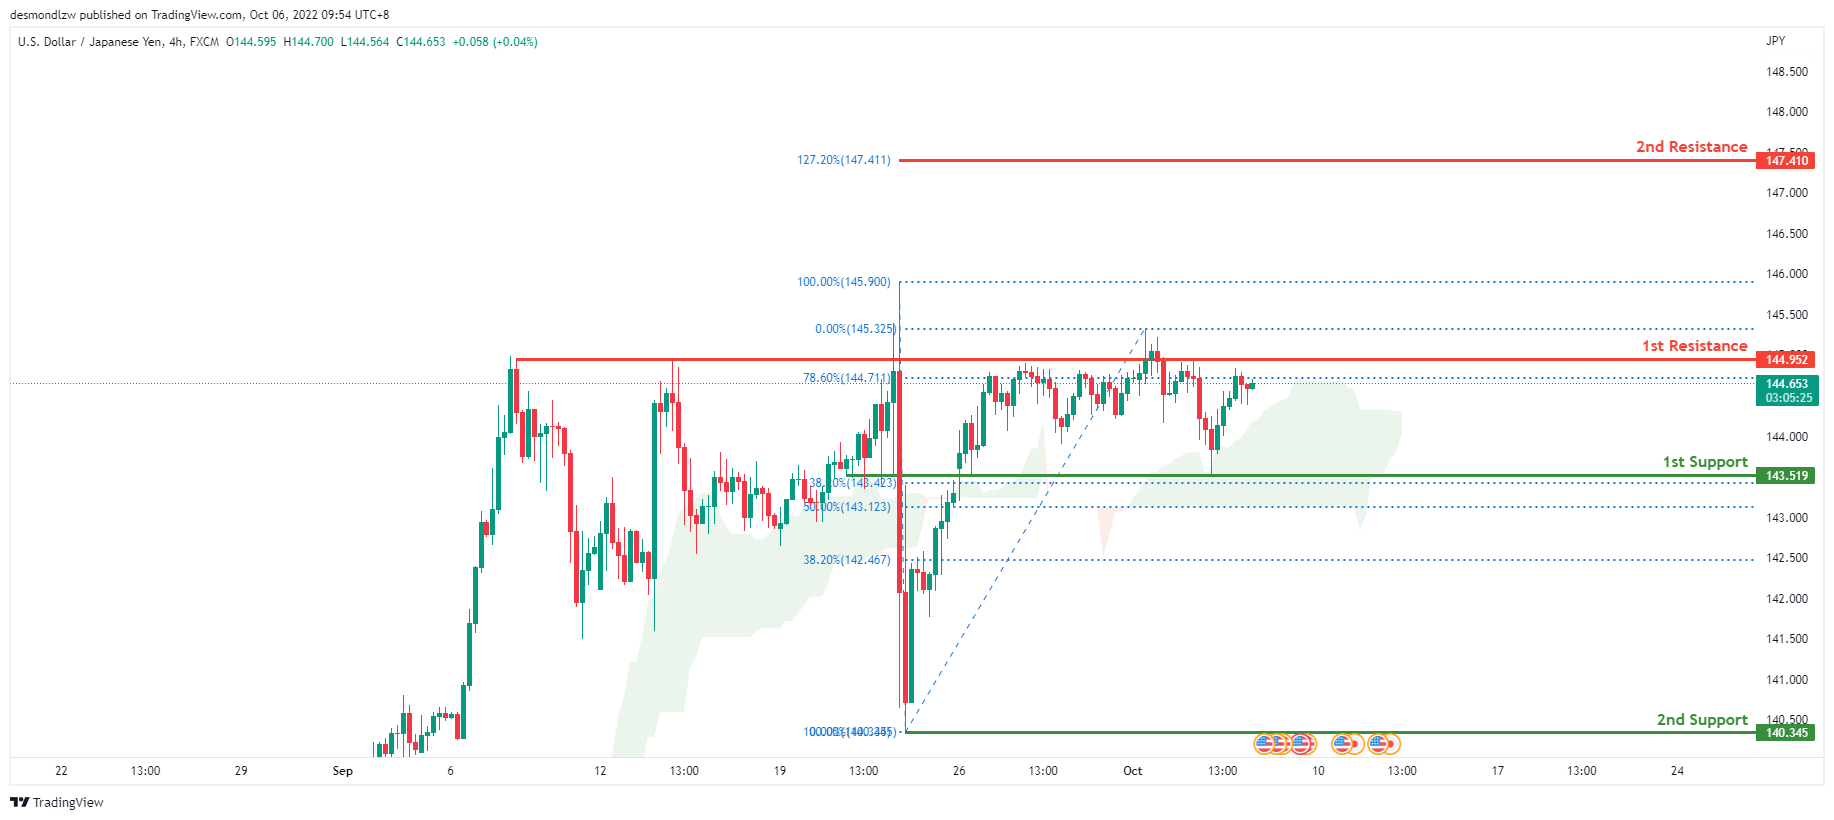
USDJPY is in a bullish trend on the H4 chart. To add to the confluence, the price is also above the ichimoku cloud, indicating that the market is bullish. Price reflected off the first support at 143.519, where the 38.2% Fibonacci line is located, overnight. Price is expected to move towards the first resistance level at 144.952, where the key 145 level is located.
Areas of consideration:
- H4 time frame, 1st resistance at 144.952
- H4 time frame, 1st support at 143.474
DXY:
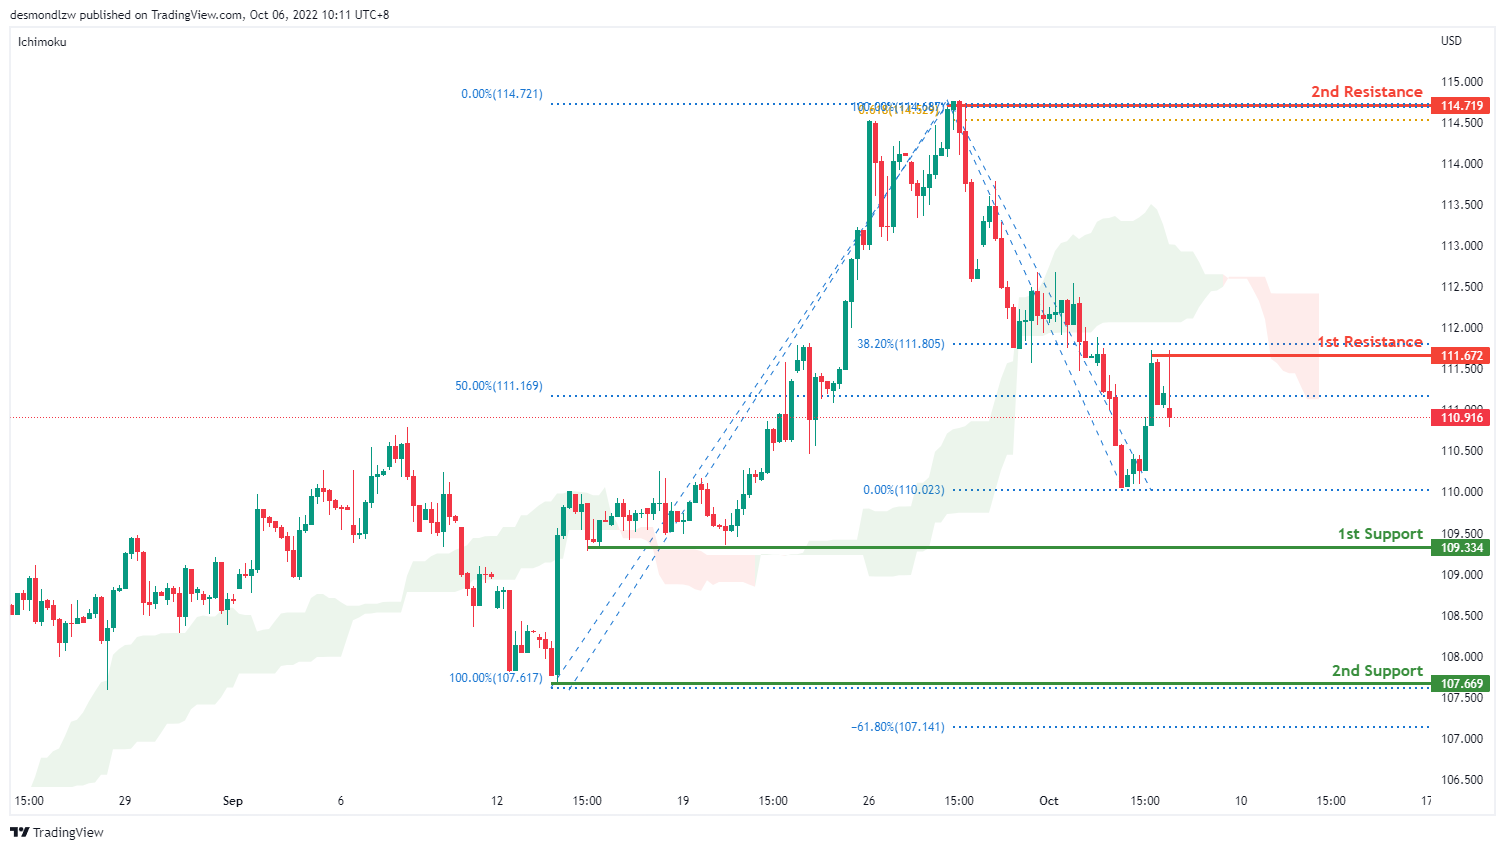
On the H4, price has broken lower from the ichimoku cloud and is moving in a descending manner hence we are bearish bias. It has broken the resistance and is moving toward the first support at 109.334 where my swing low sits. If bearish momentum continues, it will bring price to my second support at 107.669 where my second support and previous swing low sits. Alternatively price could bounce back to test the first resistance at 111.672 where my 38.2% retracement sits then the second resistance at 114.719 where the 61.8% projection and previous swing high sits
Areas of consideration:
- H4 time frame, 1st resistance at 111.672
- H4 time frame, 1st support at 109.334
EUR/USD:
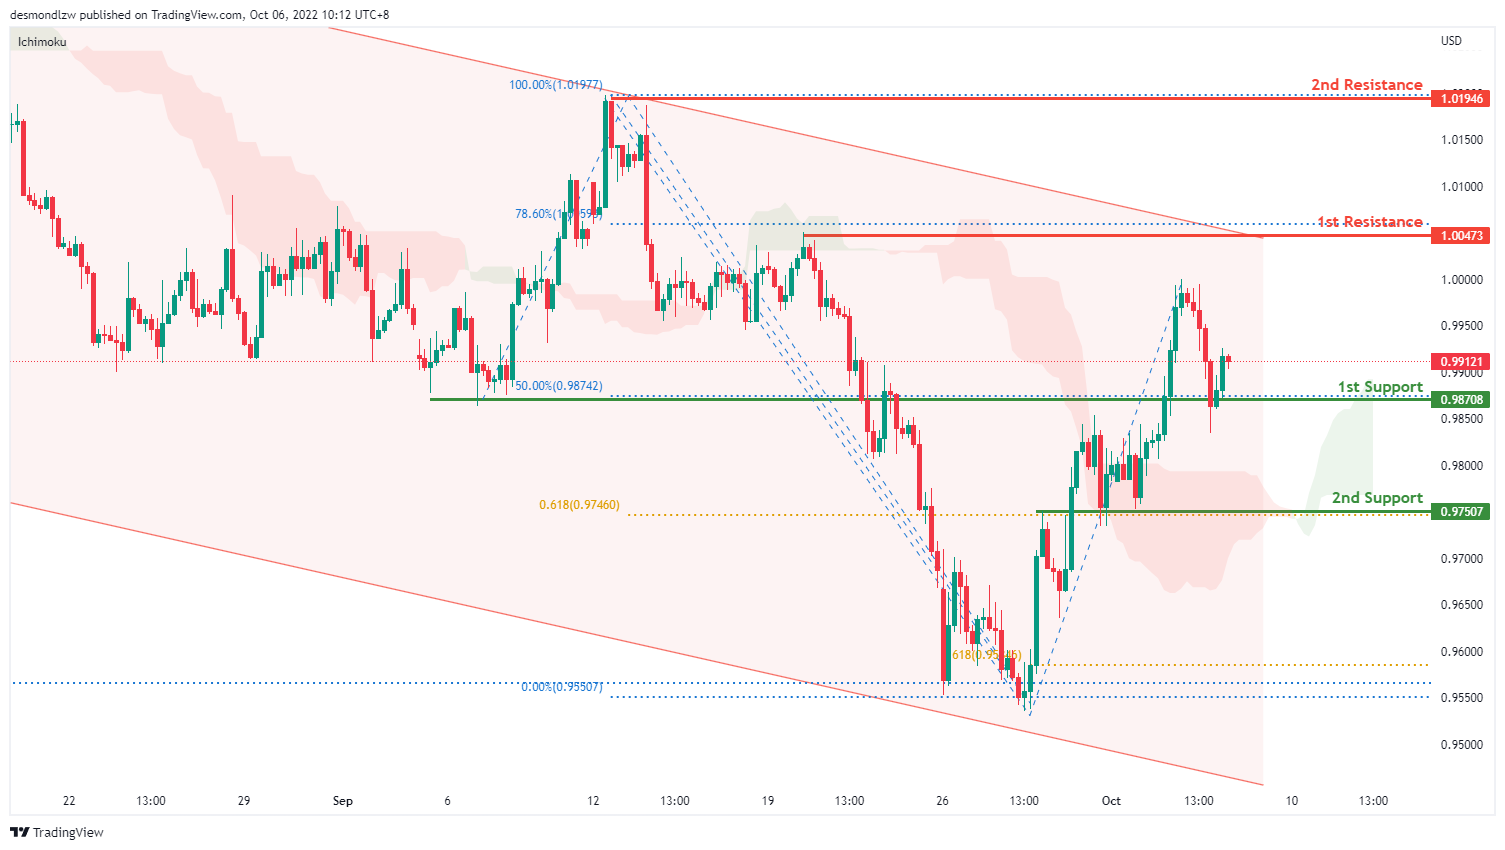
On the H4, price is moving within the descending trendline but in an ascending manner, with the price above ichimoku cloud- we are slightly bullish biased. Price has bounced off the first support and is moving toward the first resistance at 1.00473 where the 78.6% projection sits. If price breaks this level, it will test the second resistance at 1.0194, where the previous swing high sits. Alternatively, the overall bearish momentum could bring price back to test the first support at 0.9870 where the previous swing low and 50% retracement sits. If it breaks this level, we have a strong bearish confirmation to bring price down to 0.9750 where the swing low and 61.8% projection sits
Areas of consideration :
- H4 1st resistance at 1.0047
- H4 1st support at 0.9907
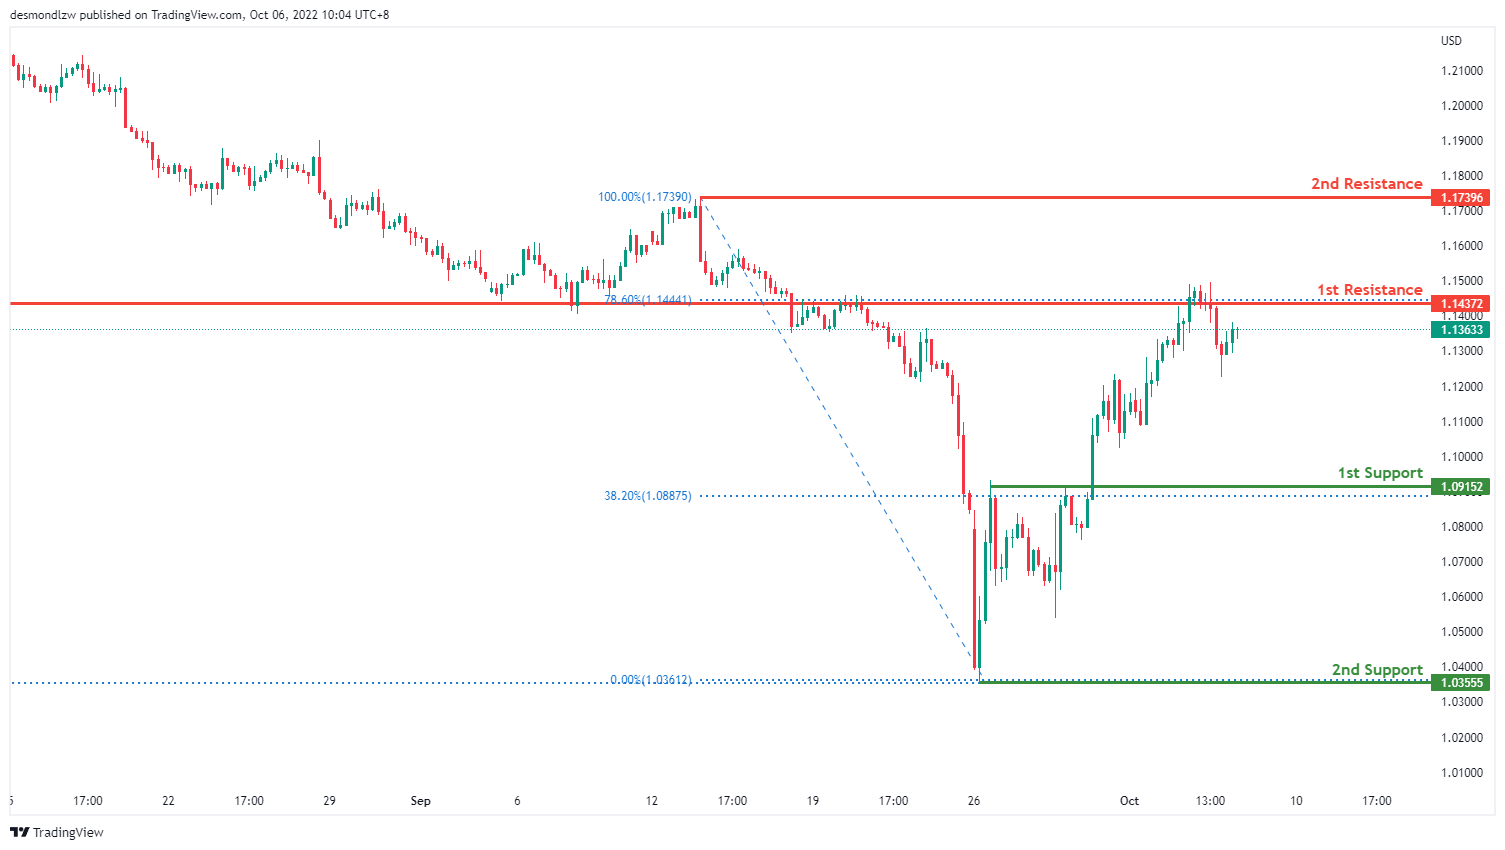
GBP/USD:
On the H4 time frame, prices have bounced off the support level and are moving in an ascending manner, we are slightly bullish. Price is moving toward the first resistance at 1.1443, where the 78.6% retracement and overlap resistance sits. If it breaks this level, its bullish momentum will bring price to second resistance at 1.1739 where the previous swing high sits. Alternatively, price could pull back to test the first support at 1.0915, where the 38.2% retracement sits then the second support at 1.0355 where the 138.2% extension sits
Areas of consideration:
- H4 1st resistance at 1.1443
- H4 1st support at 1.10915
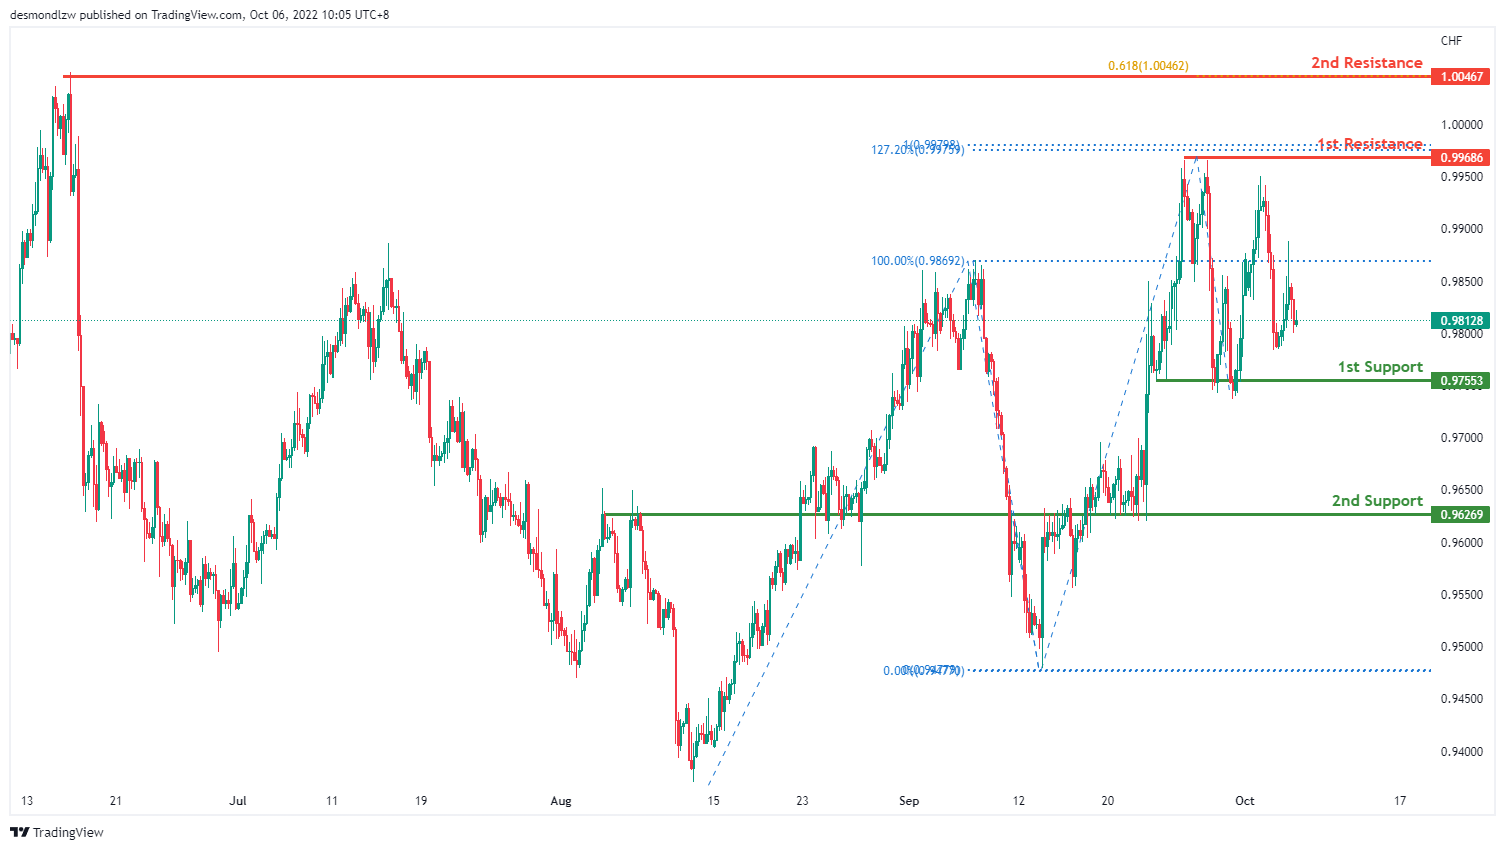
USD/CHF:
On the H4 chart, price has rejected the resistance level and is moving in a descending manner hence we are bearish bias- prices are moving toward the first support at 0.9755 where the previous swing low sits. If bearish momentum continues, it will bring price down to the second support at 0.9626 where the overlap support sits. Alternatively, price could bounce back to test the first resistance at 0.9968 where the 127.2% extension and 100% projection sits then to test the second resistance at 1.0046
Areas of consideration
- H4 1st support at 0.9755
- H4 1st resistance at 0.9968
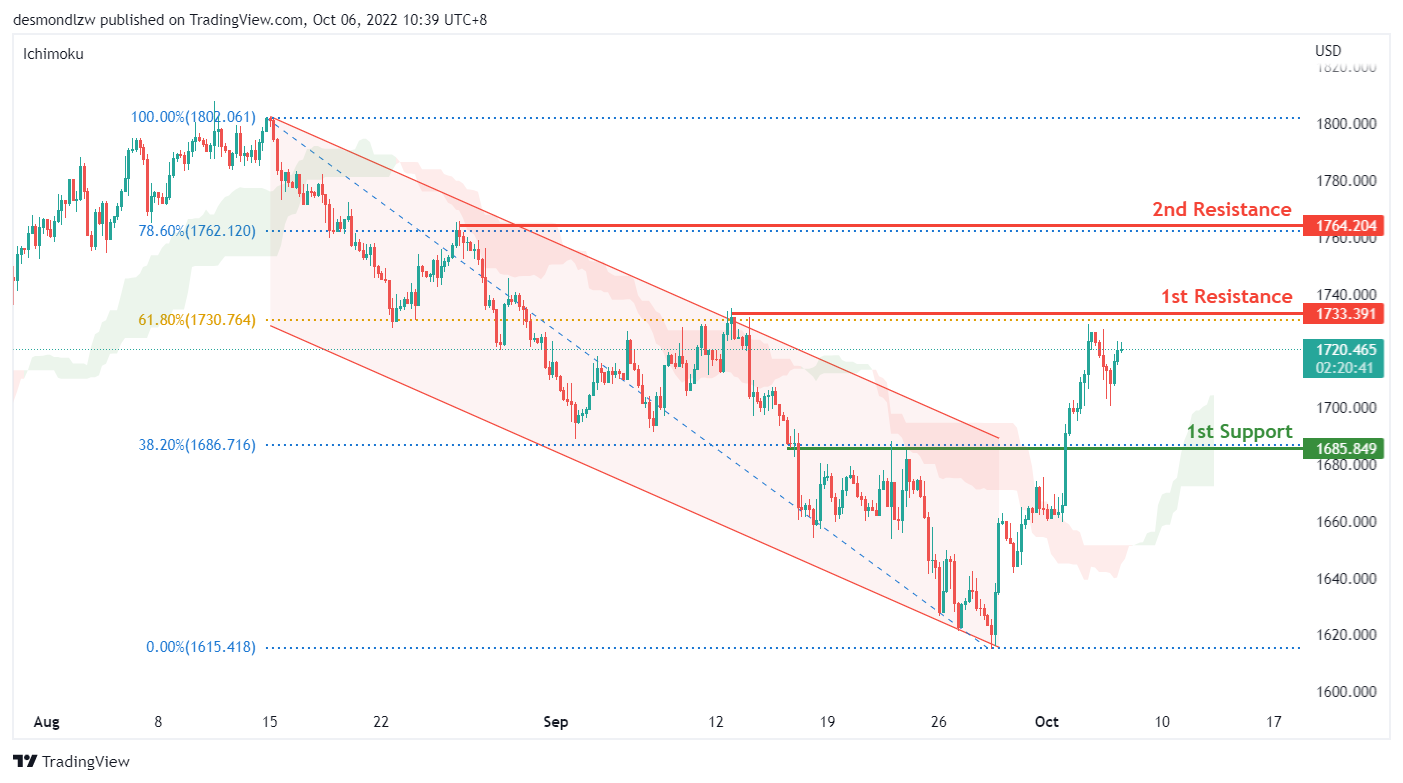
XAU/USD (GOLD):
On the H4, price continues to trade higher above the ichimoku cloud as it approaches the 1st resistance of 1733 which is the previous swing high from 12 September 2022 and the 61.80% fibonacci retracement level. We continue to have a bullish bias that price could trade higher to the 2nd resistance of 1764 which is in line with the 78.60% fibonacci retracement level and previous swing high from end August 2022.
Areas of consideration:
- H4 time frame, 1st resistance at 1733.39
- H4 time frame, 1st support at 1685
- H4 time frame, 2nd resistance at 1764
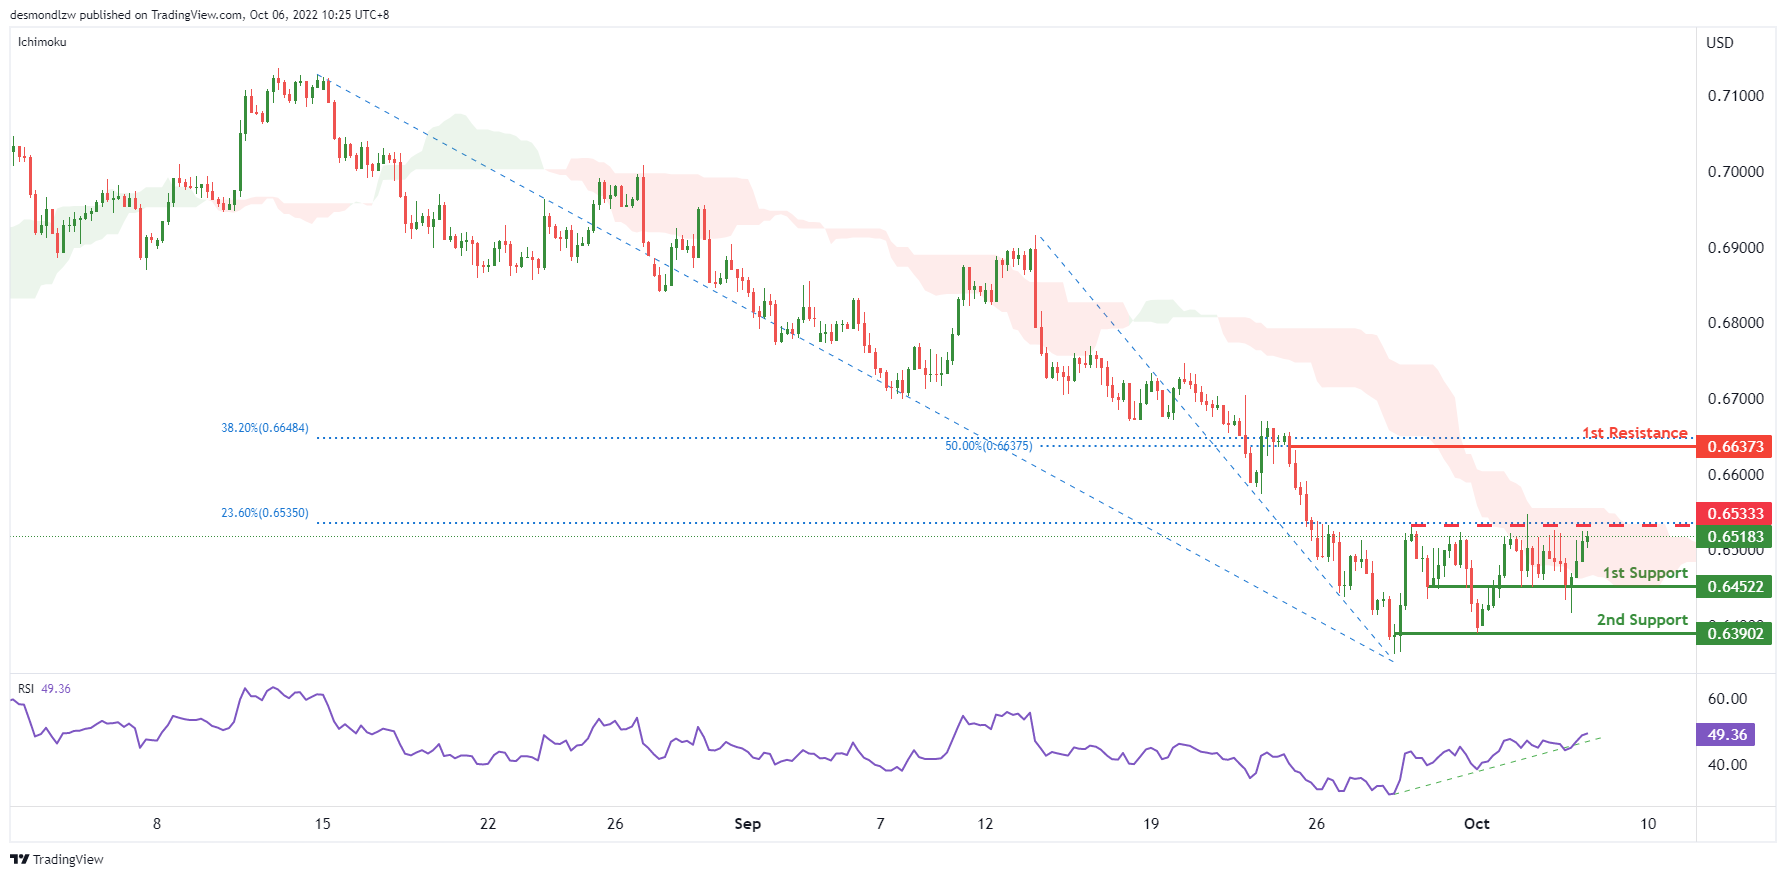
AUD/USD:
On the H4, with the price testing the resistance at 0.65333, where the 23.6% fibonacci retracement sits, and crossing ichimoku cloud, if the price can break the current resistance successfully, we can expect the price rise to the 1st resistance at 0.66373, which is in line with the 50% and 38.2% fibonacci retracement. Alternatively, the price may drop back to the 1st support at 0.645225, which is in line with the overlap support, if the 1st support is broken, the 2nd support could be at 0.63902, where the swing low is.
Areas of consideration
- H4, intermediate resistance at 0.65333
- H4, 1st resistance at 0.66373
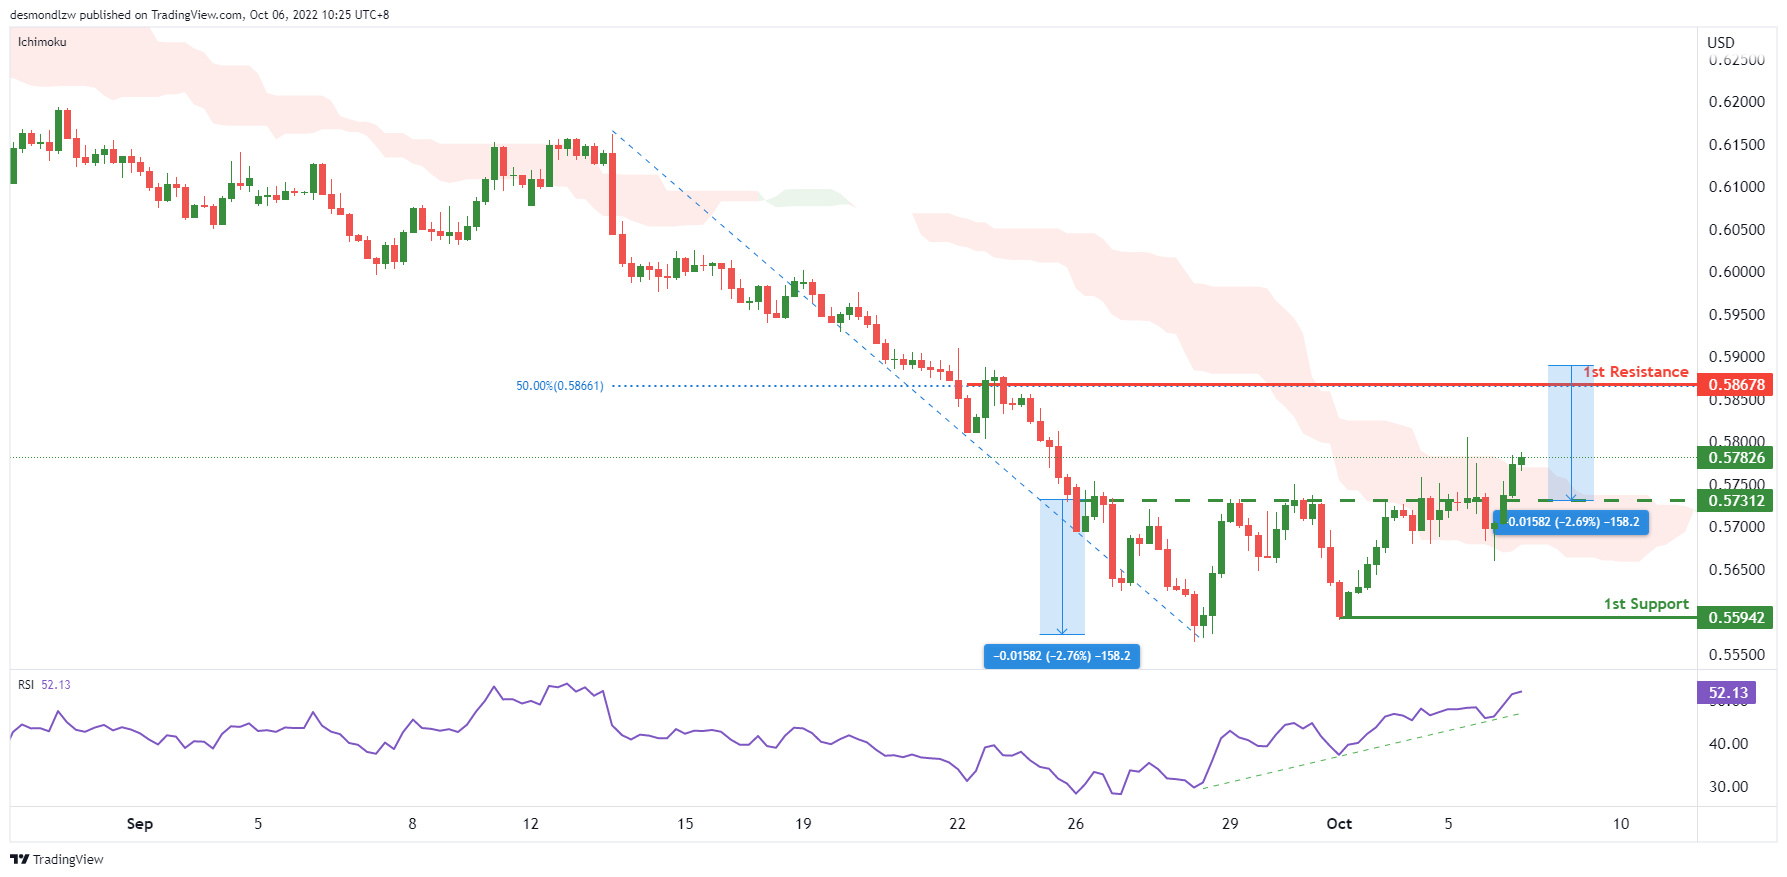
NZD/USD:
On the H4, with the price crossing the ichimoku cloud and crossing the neckline of double bottom pattern, we have a bullish bias that the price may rise to the 1st resistance at 0.58678, which is in line with the 50% fibonacci retracement and the target price of double bottom pattern. Alternatively, the price may drop to the 1st support at 0.55942, where the previous swing low is.
Areas of consideration:
- H4 time frame, current price
- H4 time frame, 1st resistance at 0.58678
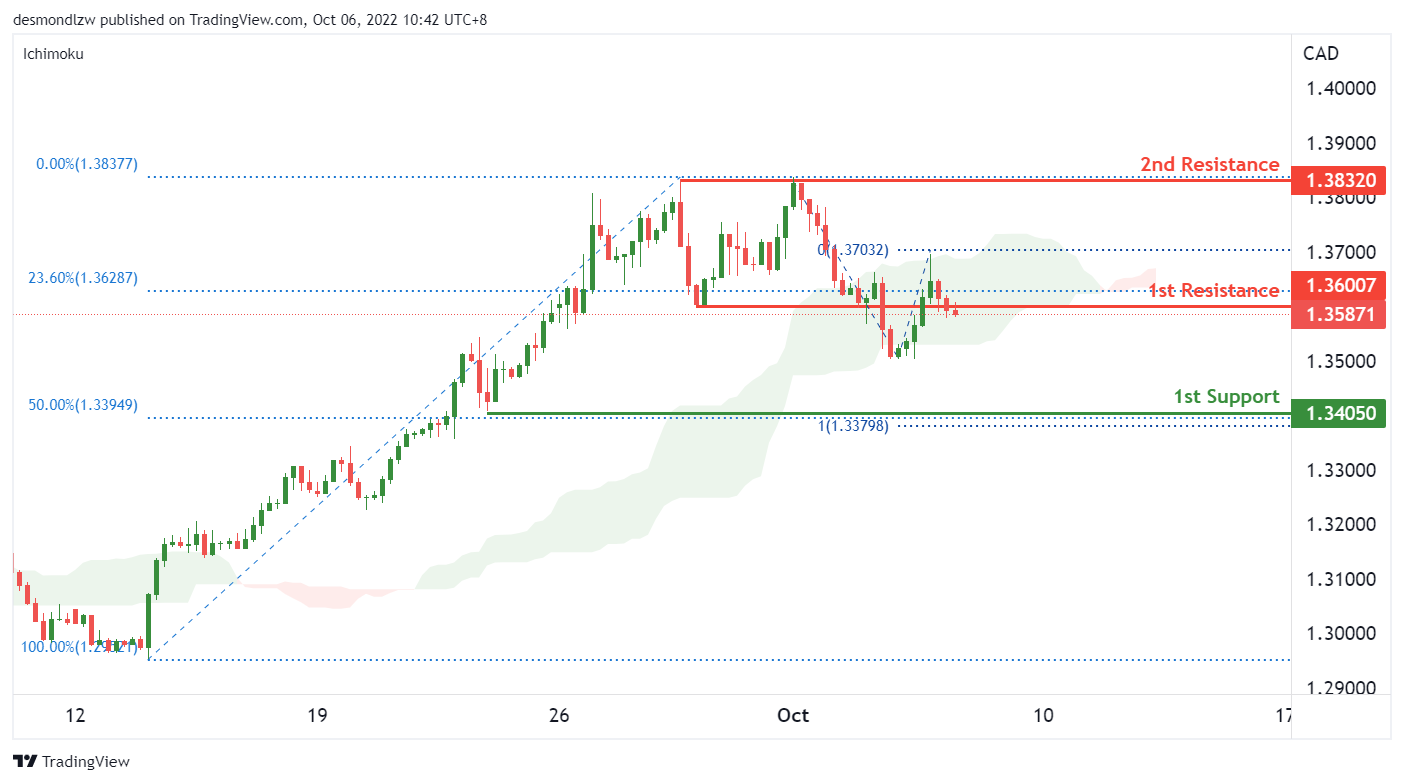
USD/CAD:
On the H4, the price trades at the support turned 1st resistance level of 1.36 which is in line with the 23.60% fibonacci retracement level. With the price within the ichimoku cloud, we have a short term bearish bias. Price could fall to the 1st support of 1.34 which is in line with the 50% retracement level and the previous swing low. Alternatively, if price breaks above the 1st resistance level, the USDCAD could trade higher towards the 2nd resistance of 1.3832 which is the previous swing high.
Areas of consideration:
- H4 time frame, 1st resistance at 1.36
- H4 time frame, 1st support at 1.34
- H4 time frame, 2nd resistance at 1.3832
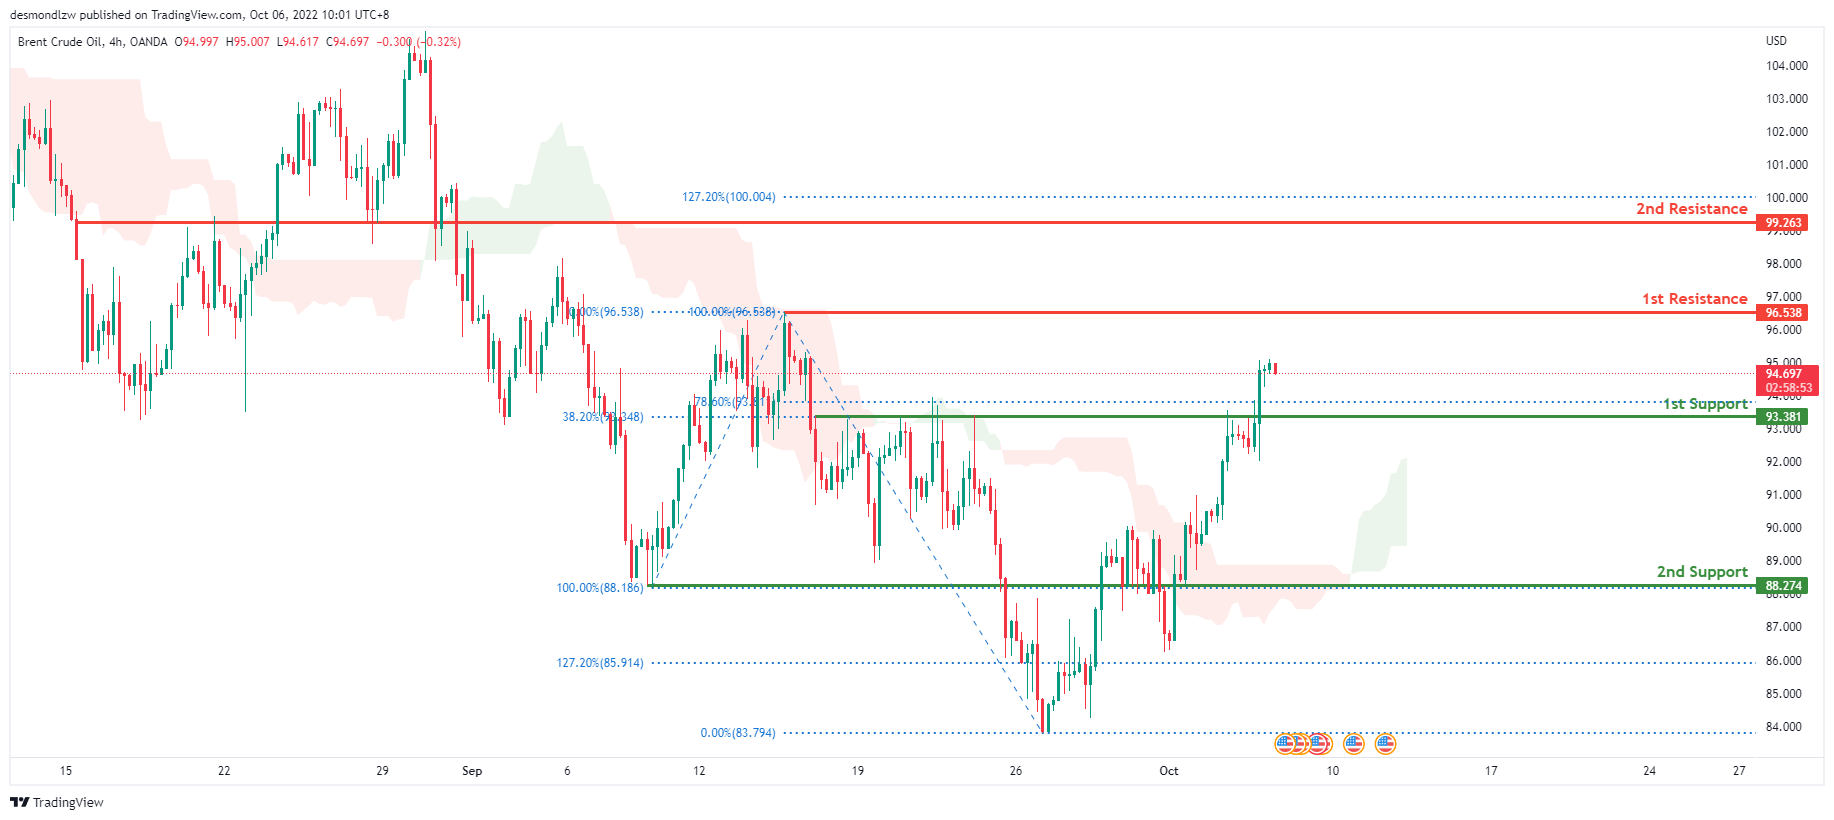
OIL:
Oil is in a bearish trend on the H4 chart. However, price turned bullish a week ago, and price is now above the Ichimoku cloud, indicating that the market has entered a medium term bullish trend. Price has also closed above the first support level at 93.381, which is marked by the 78.6% Fibonacci line. Price is expected to move towards the first resistance level at 96.538, which contains the 100% Fibonacci and 0% Fibonacci lines.
Areas of consideration:
- H4 time frame, 1st resistance at 96.538
- H4 time frame, 1st support at 93.381
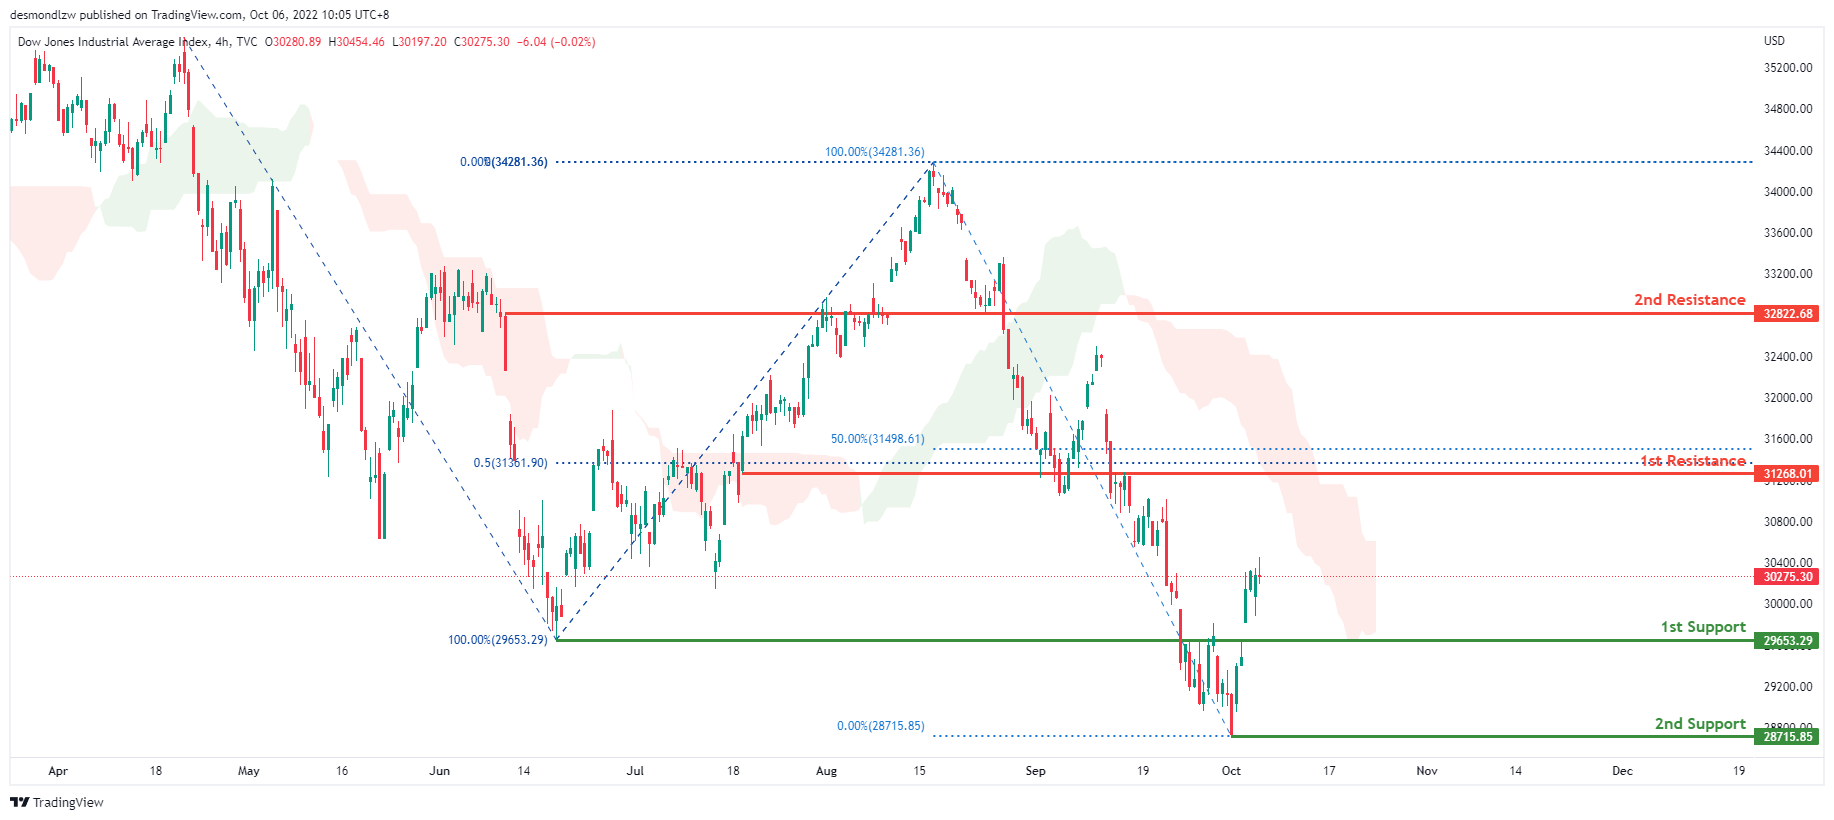
Dow Jones Industrial Average:
Price is bearish on the H4 chart. However, a short-term bullish trend appears to be forming over the last week. Price broke back above the first support level at 29653.29, which corresponds to the previous swing low. If the short-term bullish momentum continues, price will move towards the first resistance level at 31268.01, which contains two 50% Fibonacci lines.
Areas of consideration:
- H4 time frame, 1st support at 29653.29
- H4 time frame, 1st resistance at 31268.01
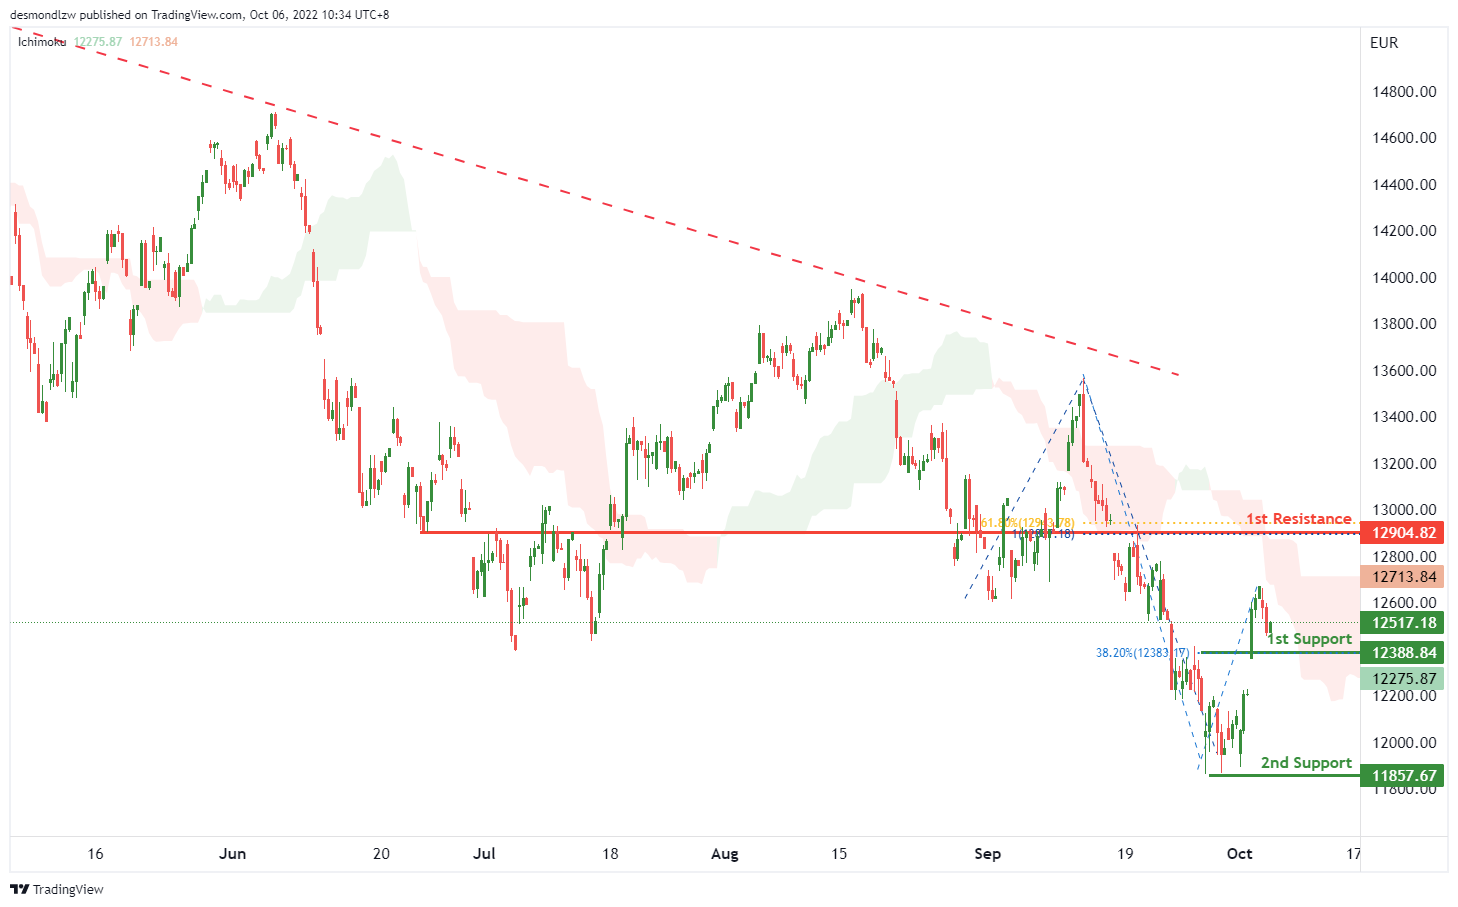
DAX:
On the H4, with the price moving below ichimoku cloud and long term descending trendline, we have a bearish bias that the price may drop to the 1st support at 12388.84, which is in line with the 38.2% fibonacci retracement. If the 1st support is broken, the 2nd support could be at 11857.67, which is in line with the swing low. Alternatively, the price may rise to the 1st resistance at 12904.82, which is in line with the 100% fibonacci projection and 61.8% fibonacci retracement.
Areas of consideration:
- H4 time frame, 1st support at 12388.84
- H4 time frame, 2nd support at 11857.67
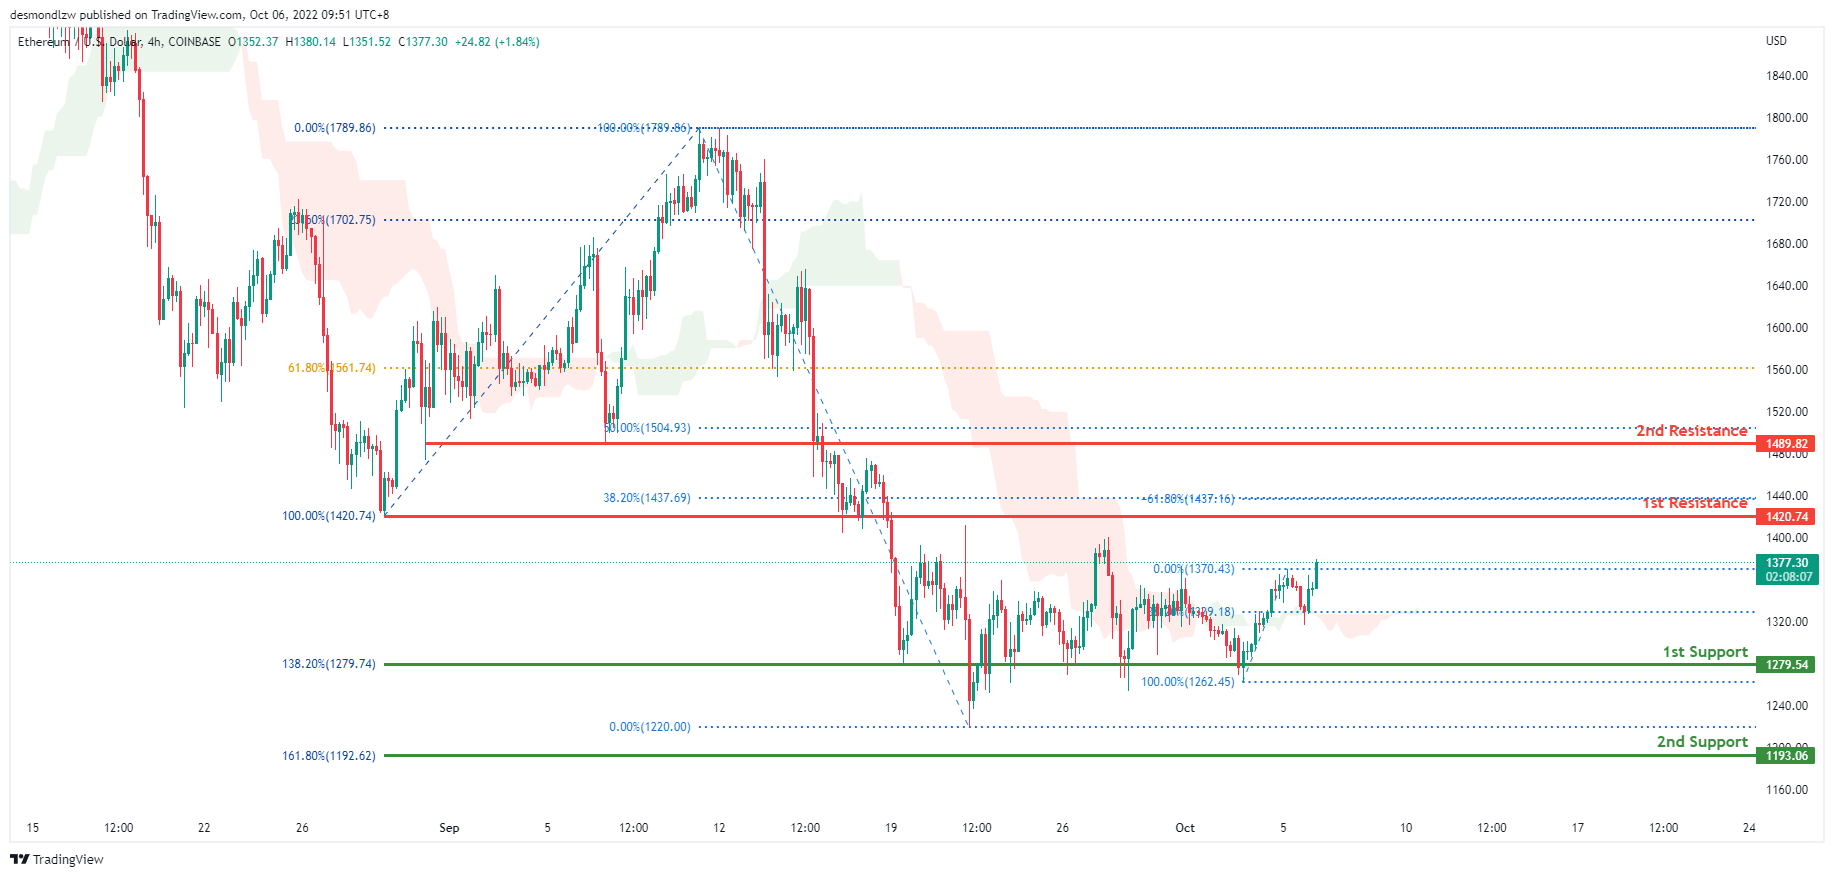
ETHUSD:
ETHUSD is bearish on the H4 chart. However, the overnight price has closed above the Ichimoku cloud, indicating that the market may turn bullish in the short term. For the past three weeks, the price has consolidated along 1279.54, the first support level. Price is expected to continue rising towards the first resistance level at 1420.74, where the previous swing low is located.
Areas of consideration:
- H4 time frame, 1st resistance of 1420.74
- H4 time frame, 1st support at 1279.00
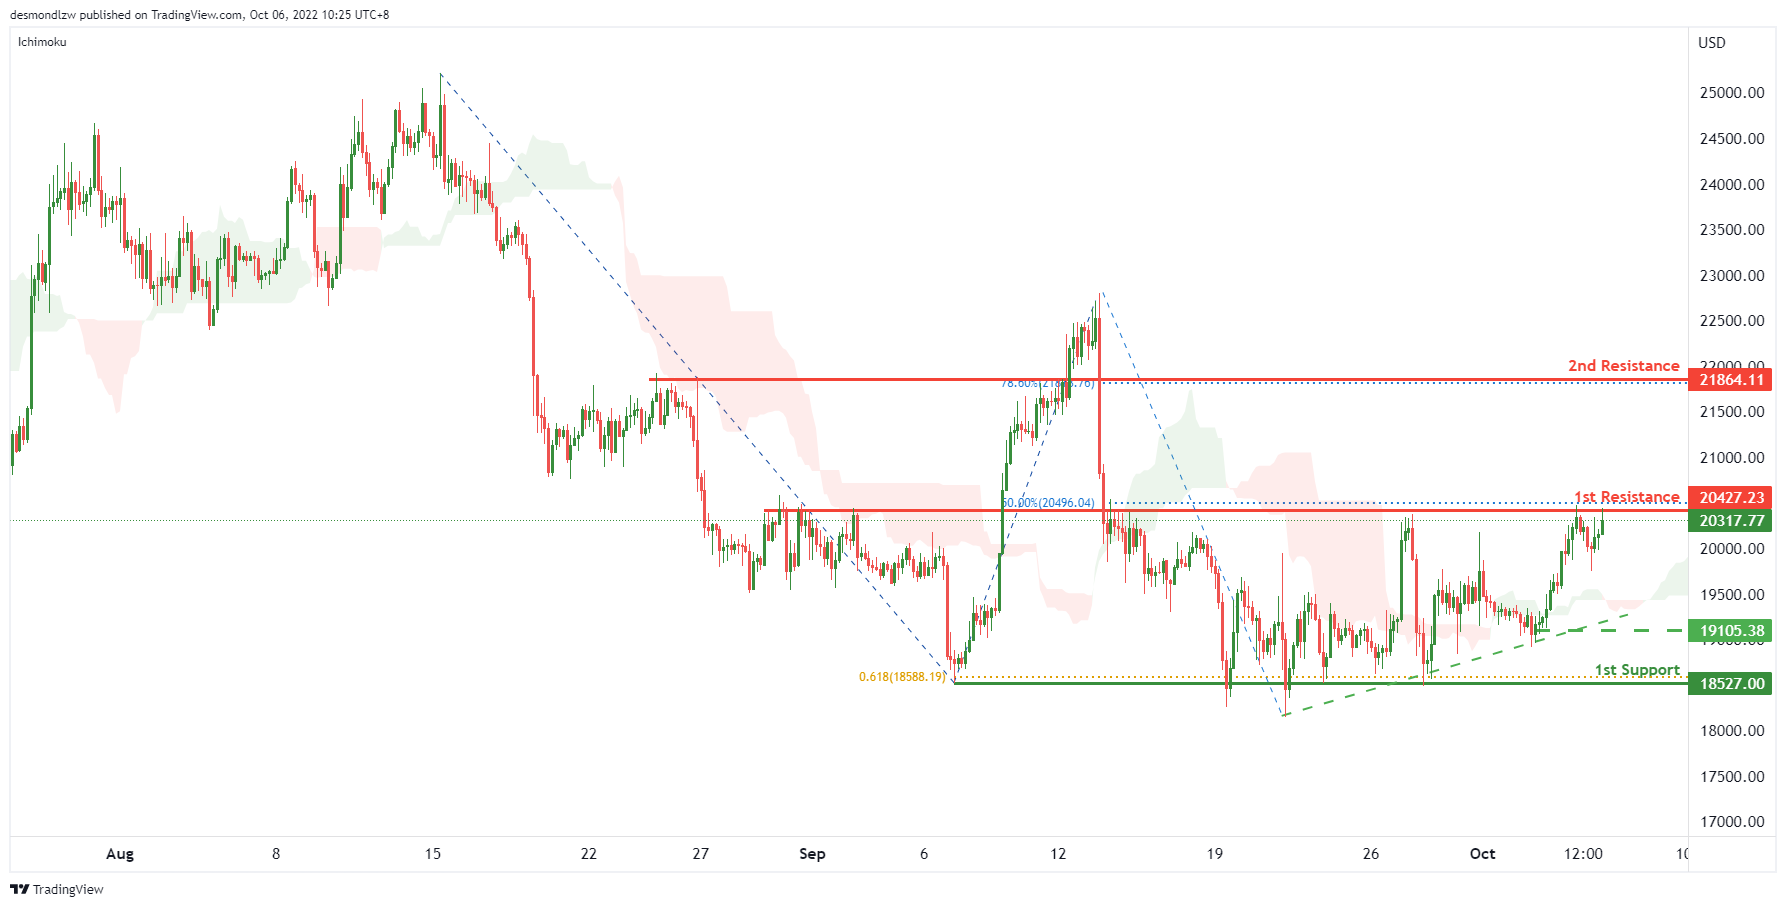
BTCUSD:
On the H4, price is showing a short term ascending trendline and testing the 1st resistance at 20427.23, where the overlap resistance and 50% fibonacci retracement are. If the 1st resistance is broken, the next resistance could be at 21864.11, which is in line with the 78.6% fibonacci retracement. Alternatively, the price may pull back from the 1st resistance and drop to the 1st support at 18527, which is in line with the swing lows and 61.8% fibonacci projection. Take note the 19105.38 could be the intermediate support.
Areas of consideration:
- H4 time frame, 1st resistance at 20427.23
- H4 time frame, 2nd resistance at 21864.11
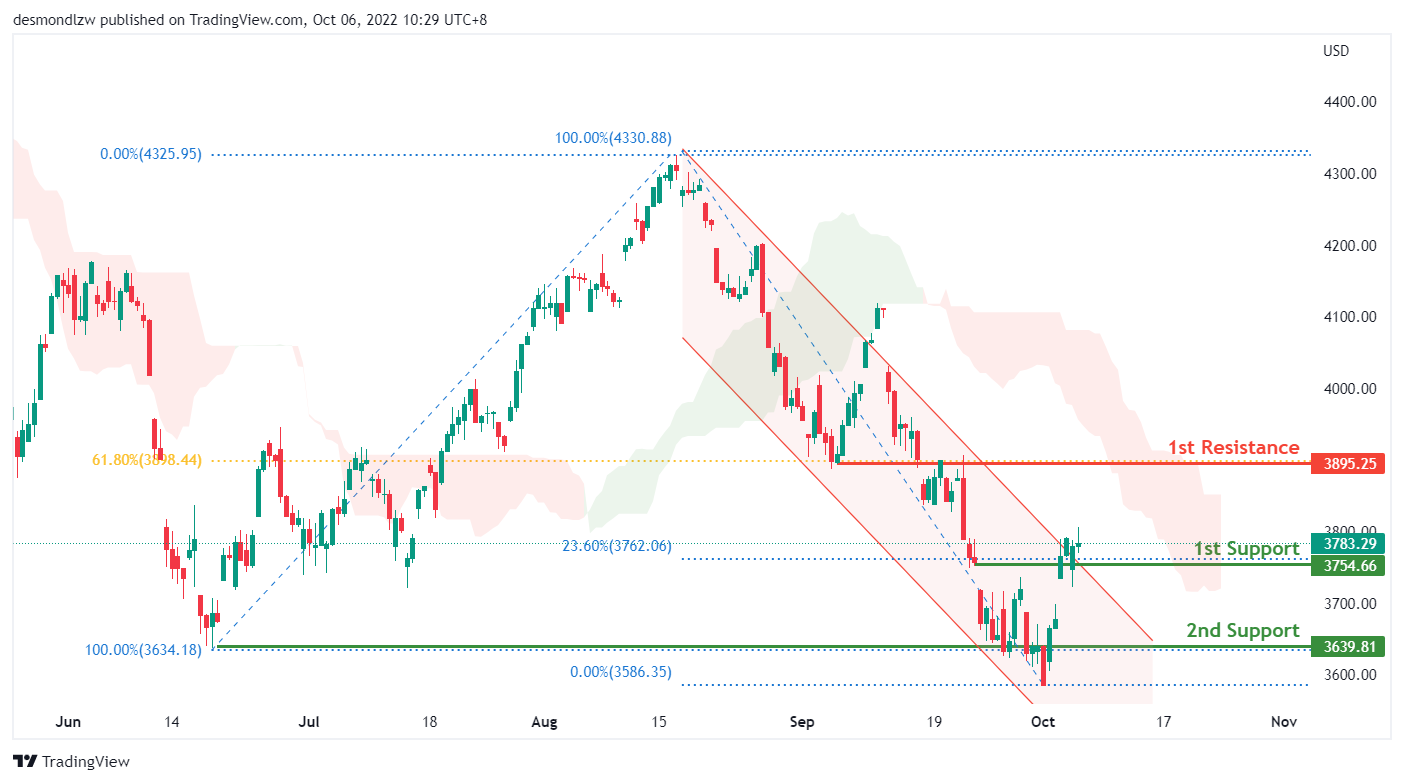
S&P 500:
On the H4, with the price breaking out of the descending channel and trading higher from 1st support of 3754, which is in line with the 23.60% fibonacci retracement level, we continue to have a bearish bias. The price could continue trading higher to the 1st resistance of 3895 which is inline with the 61.80% fibonacci retracement level and previous swing high. Alternatively, the price could reverse back into the descending channel to trade lower towards the 2nd support level, which is at the previous swing low of June 2022.
Areas of consideration:
- H4 time frame, 1st resistance at 3895
- H4 time frame, 1st support at 3754
- H4 time frame, 2nd support at 3639
The accuracy, completeness and timeliness of the information contained on this site cannot be guaranteed. IC Markets does not warranty, guarantee or make any representations, or assume any liability regarding financial results based on the use of the information in the site.
News, views, opinions, recommendations and other information obtained from sources outside of www.icmarkets.com.au, used in this site are believed to be reliable, but we cannot guarantee their accuracy or completeness. All such information is subject to change at any time without notice. IC Markets assumes no responsibility for the content of any linked site.
The fact that such links may exist does not indicate approval or endorsement of any material contained on any linked site. IC Markets is not liable for any harm caused by the transmission, through accessing the services or information on this site, of a computer virus, or other computer code or programming device that might be used to access, delete, damage, disable, disrupt or otherwise impede in any manner, the operation of the site or of any user’s software, hardware, data or property.