Overview
Technical analysis is essentially the study of price on charts in order to gain some insight into the past, present and future direction of price. It is a study that most traders use to make trading decisions, this adds to its significance and what makes it such an effective and reliable means of analysis.
Technical analysis works on the basis that everything that can affect the price of an instrument is already reflected in the price and thus on the chart. In the case of the forex market this means that all fundamental data, market sentiment, political factors, demand and supply are already reflected in the price of the currency. This is especially true in the case of the forex market since no one participant is able to manipulate the value of a currency due to the extreme size of the market.
Technical analysis also works on the basis that price or chart patterns repeat themselves. This is what makes it such a powerful tool. Since traders all around the world are watching the same chart, everyone is able to see the same patterns unfolding and act accordingly. Whether it be a trend following strategy, momentum or range trade, they all work on the premise that history repeats itself. This allows us to make informed trading decisions and create a system with an edge based on our own understanding of technical analysis.
Technical analysis primarily uses bar or candlestick charts to make trading decisions. Bar and candlestick charts show us the high, low, open and close over a particular time period. This tells us whether buyers or sellers were in control and provides us with insight as to who may be in control in the future.
The time frame of the chart you are studying determines the strength and significance of the analysis you are making. It will also be a determining factor as to how long you will be in a trade, your stop and take profit orders. Technical analysis done on a daily chart would likely result in a trade extending for days and weeks, where as a trade made off analysis done on a 5 minute chart would effectively be an intraday trade lasting minutes to hours.
Now lets explore some of the most popular types of technical analysis used by Forex traders.
Support and resistance
The most fundamental of ideas and the most important tool in any traders toolbox is by far support and resistance levels. They are such an effective means of analysing markets as almost every trader and market participant uses them to guide their decisions and thus respect these levels. This section will focus on the fixed price levels which we all know as the horizontal and trend lines that mark our charts, providing us with insight into the constant bull bear battle that is evident in the Forex market. Laying the foundation and understanding exactly what these levels mean will help to develop your perception of price, and provide you with highly probable areas for entry and exit of trades.
Support and resistance levels can be used to identify reaction levels or areas where we can expect the market to stall and or reverse, alternatively they can be used to form a bias regarding the future direction of price. They can mark swing points in price, areas of consolidation and define price ranges, all of which are covered in detail below.
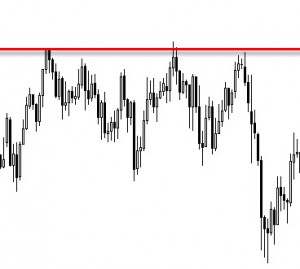
Resistance
A resistance level is an area where sellers overcame buyers, resulting in the failure of price to move higher.

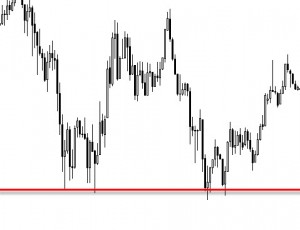
Support
A support level is an area where buyers overcame sellers, resulting in the failure of price to move lower.
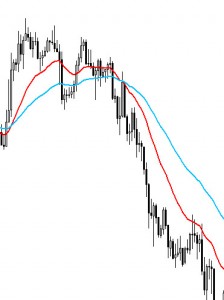
Moving averages
Moving averages are an effective tool and have many different uses and applications. They can used to determine trends, both long and short term depending on the time frame. The can be used as floating support and resistance levels, determining a bullish or bearish bias, or providing entries and exits of trades.
Moving averages smooth the price data to form a trend following indicator. They do not predict price direction, but rather define the current direction with a lag. Moving averages lag because they are based on past prices. Despite this lag, moving averages help smooth price action and filter out the noise. They also form the building blocks for many other technical indicators and overlays, such as Bollinger Bands, MACD and the McClellan Oscillator. The two most popular types of moving averages are the Simple Moving Average (SMA) and the Exponential Moving Average (EMA).