What is fundamental analysis?
Fundamental analysis is the study of economic, social and political data, reports and news to gain some insight into the past, present and future direction of exchange rates. From a fundamental perspective there are many different ways to analyse currencies, we will focus on the interest rate differential model.
The future direction of an exchange rate will ultimately be determined by the underlying demand and supply for that particular currency. Using some key economic indicators, we can apply readily available data to our interest rate differential model, predicting with some accuracy present and future demand and supply and thus the direction of exchange rates.
What is the Interest rate differential model?
The interest rate differential model is based on the idea that currencies with higher interest rates appreciate as market participants move their funds to countries with a higher yield. While the average investor may not deem it suitable to send the funds overseas, savvy investors, funds and institutions have long been taking advantage of this opportunity, earning interest and capital appreciation on leveraged positions to get big returns. As a retail trader we want to be focused on taking advantage of these trends, taking positions in the spot forex market where we can also earn interest, assuming the interest rate differential is in our favour.
Most economic data and reports carry significance because of the implications they have on the future direction of interest rates. The below points look at the key components of the interest rate differential model; data and reports, which when released have an impact on the market because of their assumed affect on the future direction of interest rates. Strong data or data that beats the market’s expectations will usually mean an appreciation of a currency, while weak data or data that misses expectations will usually mean a depreciation of a currency. This is an extremely important point! Understanding that market participants will act based on their perceived outlook for a currency.
Key components of the model:
Interest rates
Interest rates are the key driver of this model but they are a part of a number of contributing factors which will move exchange rates. Interest rates are a tool used by central banks to meet a number of their monetary policy objectives, these are:
- Keep Inflation between a target band of 2-3%. They do this by either tightening (raising rates) or loosening (lowering rates)
- Strong and sustainable growth.
Interest rates are able to achieve the above goals as they affect the demand in an economy. When interest rates rise the cost to borrow money increases causing the amount of spending in an economy to decrease. The opposite is true when they want to stimulate demand.
Understanding how and why interest rates are used will further your understanding of the macroeconomic themes present in the Forex market. This means that when you read information from your news feed or dissect a bank report you will be able to think about the cause and effect of most economic variables being talked about.
Now that we understand what interest rates do and how they affect our model we can look at data that will help us to make trading decisions. The data or news releases that you will want to be looking at can be found on www.forexfactory.com, they will have both an immediate and long term effect on the currency.
- Interest rate announcements
- Central bank minutes
- Central bank speeches
All of the above releases can either be traded once released or incorporated into your model to decide whether the currency will rise or fall based on the future direction of interest rates. Arguably the most important of these announcements is the central bank minutes. This is because is because the central bank members have effectively done the thinking for you, outlining in veiled language their outlook for that particular economy, its trading partners, the global economy and the affect this is likely to have on their decision making process in the future
Inflation
Inflation is defined as the general rise in the price of goods and services resulting in the diminishing purchasing power of money. It is every government and central banks pet hate and keeping it under control is the main focus of monetary policy. As we can see above, most central banks will try to keep inflation between 2-3% by either raising or lowering rates. Knowing that inflation is seen as a real problem by central banks, keeping an eye on inflation data to gauge the future direction of interest rates is a key component of the interest rate differential model. The below economic indicators are common measures of inflation that are used in the model:
- CPI, Core CPI (consumer price index) is a general measure of price inflation throughout the household sector.
- PPI (producer price index) measure of price inflation in producer prices.
Economic growth
The economic growth of a national is central to this model as it measures the output of an economy and thus where an economy is in its growth cycle and the underlying issues that may arise as a result of high or low growth. Most central banks have the goal of sustainable economic growth of around 3% over the medium term. This means that central banks will use monetary policy (interest rates) as a means of stimulating or slowing growth within the economy. Below are some common economic indicators used to measure growth within an economy. I have included some which are not traditionally used as growth indicators, however, I did not feel they warranted enough attention to have their own category.
- GDP or gross domestic product is a measure of the output of a country.
- Retail sales
Employment data
In our model measuring unemployment within an economy is extremely important because of the inverse relationship that exists between unemployment and inflation. That is, the lower the unemployment rate, the greater the inflationary pressures are within an economy. This relationship is illustrated in the below diagram known as a Phillips curve.
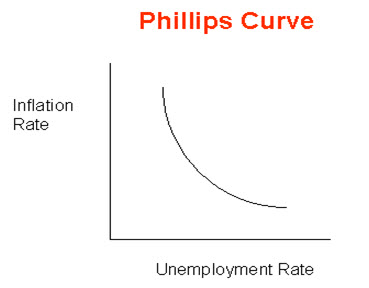
The curve shows us that as unemployment decreases inflation increases and vice versa. The reason for this is the extra pressure increased wages have within an economy on the prices of goods and services. Employment data is also a good indicator of the strength of an economy, it is for this reason the non-farm payrolls report that is released on the first Friday of the month from the United States is the most anticipated economic report in the world. In the uncertain economic times of today the world looks to this report to determine how stable the US economy is and whether they want to be taking on risk. There are a number of reports which measure unemployment/employment in a number of countries, the most notable are:
- Non-farm payrolls (US)
- Unemployment claims (US)
- Employment change (AUD)
These are the main components of the interest rate differential model that you can incorporate into your trading on either a short or longer term basis. You can trade these economic numbers when they are released or you can use them to form a longer term bias for the currency you are trading. The important thing is that you understand what the numbers mean! This doesn’t mean you should know the intricacies of these reports and numbers, just that you understand the implications they can have on interest rates in the future.
As a retail trader the majority of your trades are going to come from identifying opportunities on the charts using technical analysis, you should therefore consider yourself a technician (technical analyst) rather than a ‘fundy’ or an economist. As a technician you presume that all fundamentals and anything that could affect an exchange rate is already reflected in the price/charts. In theory this would be ideal and we could forget about the fundamentals altogether. In reality markets aren’t that efficient and it pays to know these most driest of subjects (although some of us do enjoy them). For this reason, understanding the fundamentals and staying up to date with current macroeconomic themes should be a part of your trading day. Spending 10 minutes a day looking at your news feed, looking at the latest numbers to come out for the different reports, or even some fundamental research. It will ensure you are aware of the macro themes present and thus trading in sync with the current market flow.