
Key risk events today:
EUR CPI Flash Estimate y/y; Canada GDP m/m.
EUR/USD:
(Italics – previous analysis).
The US Thanksgiving holiday witnessed thin trade Thursday. On the data front, however, headline German CPI for November missed expectations for a pick-up to 1.3%, and the pace remained unchanged at 1.1%, missing estimates for a rise to 1.3% y/y. The m/m release fell deeper than expected, falling 0.8% vs. 0.6% expectations.
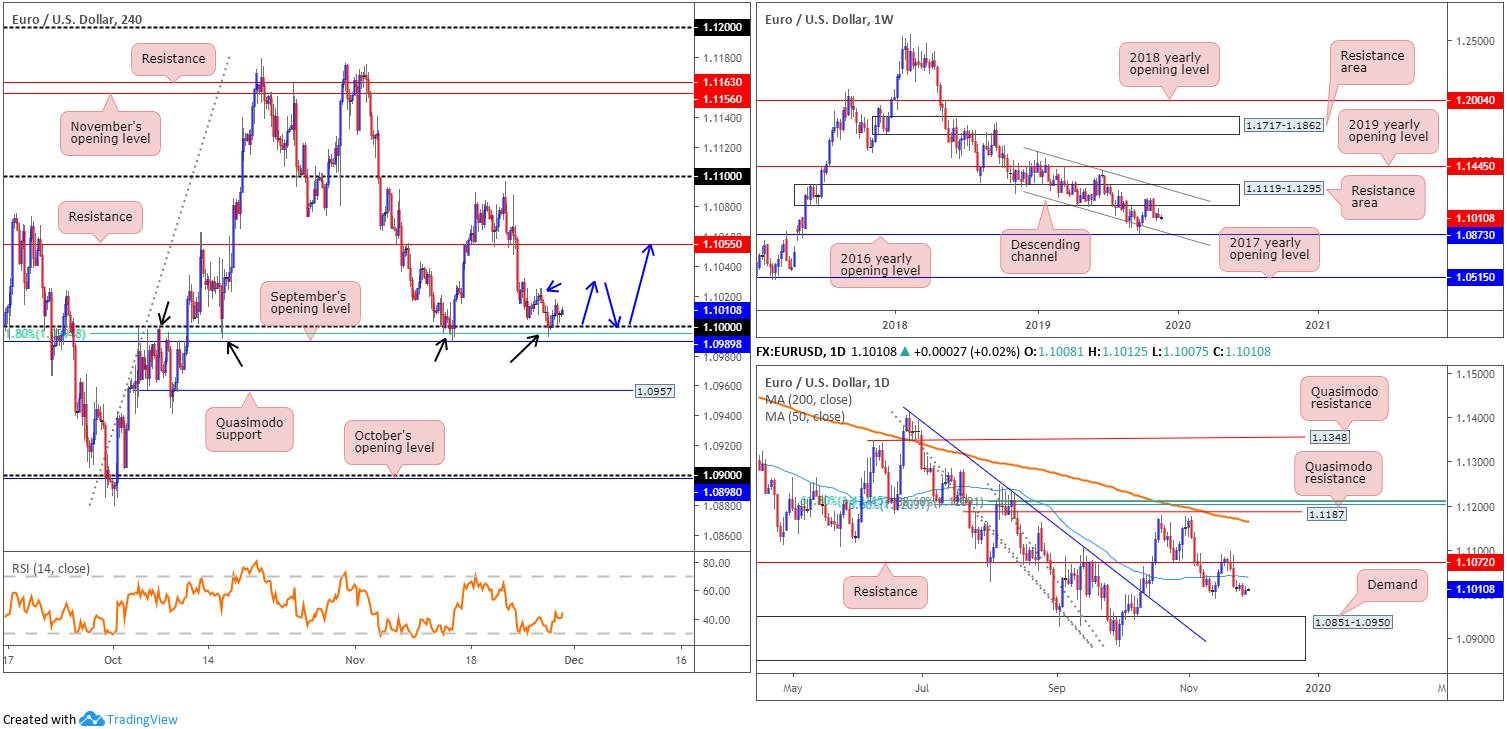
Technically, the 1.0989/1.10 zone based on the H4 timeframe remains in view, consisting of the key figure 1.10, September’s opening level at 1.0989 and a 61.8% Fibonacci retracement at 1.0994. While many traders are likely looking to enter long from this zone, higher-timeframe structure displays limited support.
According to the weekly timeframe, price continues to reflect a bearish tone south of long-standing resistance area at 1.1119-1.1295. Further selling has the lower boundary of a weekly descending channel to target (extended from the low 1.1109), merging closely with the 2016 yearly opening level at 1.0873. Also, concerning trend direction, the primary downtrend has been in motion since topping in early 2018 at 1.2555.
A closer reading of price action on the daily timeframe has the candles trading below both the 200/50-day SMAs (1.1164/1.1039). Aside from the 1.0989 November 14 low, support is limited on this scale until reaching demand at 1.0851-1.0950. Note the said demand base holds the 2016 yearly opening level at 1.0873 within its lower boundary.
Areas of consideration:
Outlook unchanged due to lacklustre movement.
A move higher from 1.0989/1.10 is a possibility. The lack of higher-timeframe support is a concern, however. For that reason, traders may opt to wait and see if the unit can take out the local high at 1.1025 before considering longs (blue arrows) at 1.10ish.
An alternative approach might be to simply wait for additional candlestick confirmation out of 1.10, such as a hammer candlestick formation or a bullish engulfing pattern (entry/risk can be defined according to the selected candlestick pattern).
A decisive close beneath 1.0989 opens the door to an intraday bearish theme, targeting H4 Quasimodo support at 1.0957 as the initial downside take-profit area. Keep in mind, weekly price suggests the 2016 yearly opening level at 1.0873 could eventually make an appearance, so keeping a portion of the position open is an option here.
GBP/USD:
(Italics – previous analysis).
In recent trading, GBP/USD caught a fresh bid on the back of YouGov’s MPR model forecasting a solid win for the Conservatives in the December election. The result sent the pair to highs of 1.2951, though with market action entering a subdued phase due to the Thanksgiving Day holiday in the US yesterday, price action retraced and is seen holding just north of 1.29.
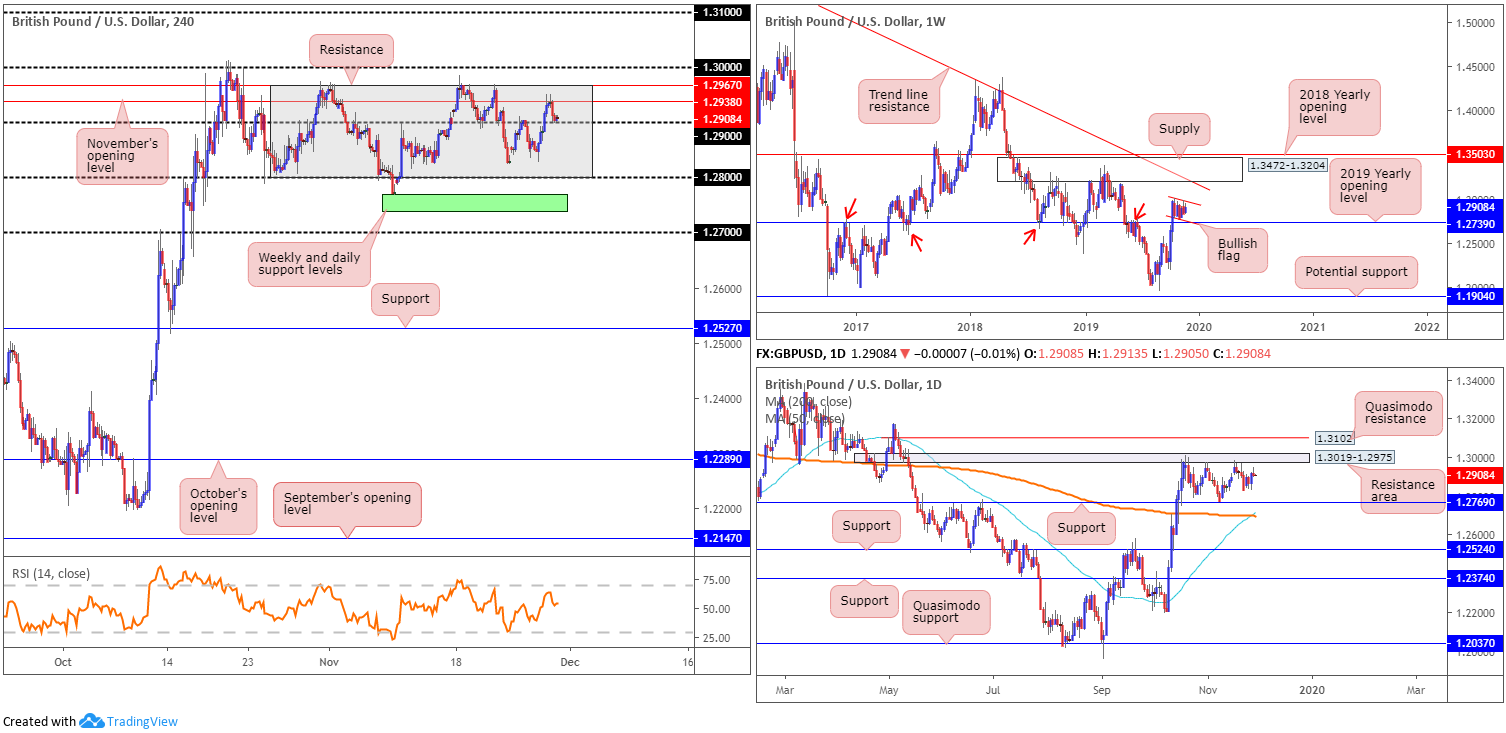
The technical landscape on the weekly timeframe continues to support further upside in GBP/USD, exhibiting a bullish flag (typically considered a continuation pattern) forming just north of the 2019 yearly opening level 1.2739. A decisive push out of the said flagging formation may lead to the unit crossing swords with supply at 1.3472-1.3204 and long-term trend line resistance etched from the high 1.5930.
On the daily timeframe, since mid-October, candle action has been carving out a consolidation between a resistance area plotted at 1.3019-1.2975 and a well-placed support level at 1.2769. Beyond this range, Quasimodo resistance lies at 1.3102, whereas south of 1.2769, the 200-day SMA (orange – 1.2697) and 50-day SMA (blue – 1.2714) offer support and are, at the time of writing, seen marginally crossing each other (sometimes referred to as a ‘Golden Cross’). Traders may also want to acknowledge the unit trades near the upper edge of the said range, shaped by way of a shooting star candlestick formation (considered a bearish signal at peaks).
Across the page on the H4 timeframe, price continues to trade rangebound between resistance at 1.2967 and the 1.28 handle (grey). Within the range falls the 1.29 handle and November’s opening level at 1.2938. Outside of the consolidation, the key figure 1.30 is in sight, along with an interesting area of support in green comprised of weekly support (2019 yearly opening level) and daily support at 1.2739 and 1.2769, respectively. As of current price, trade is taking place within the upper boundary of the current range, specifically testing the 1.29 handle as support.
Areas of consideration:
Longer term, additional upside is likely in store. Bullish flags, particularly formed on the higher timeframes, are known for accuracy. Clearance of the daily Quasimodo resistance level at 1.3102 could provide a filter for traders looking to enter long-term positions in this market. A daily close above 1.3102, for example, confirms bullish intent out of the weekly pattern.
Shorter term, nevertheless, entering long at current price faces resistance not only from November’s opening level at 1.2938, but also the upper boundary of the current H4 range (1.2967), as well as the key figure 1.30.
AUD/USD:
(Italics – previous analysis).
In terms of recent data, private capital expenditure (Q3) in Australia declined more than expected (-0.2% vs. exp 0.0%), while geopolitical tensions increased after US President Trump signed the Hong Kong Bill. Overall, though, AUD/USD concluded Thursday mostly unmoved due to the Thanksgiving Day holiday in the US thinning trade.
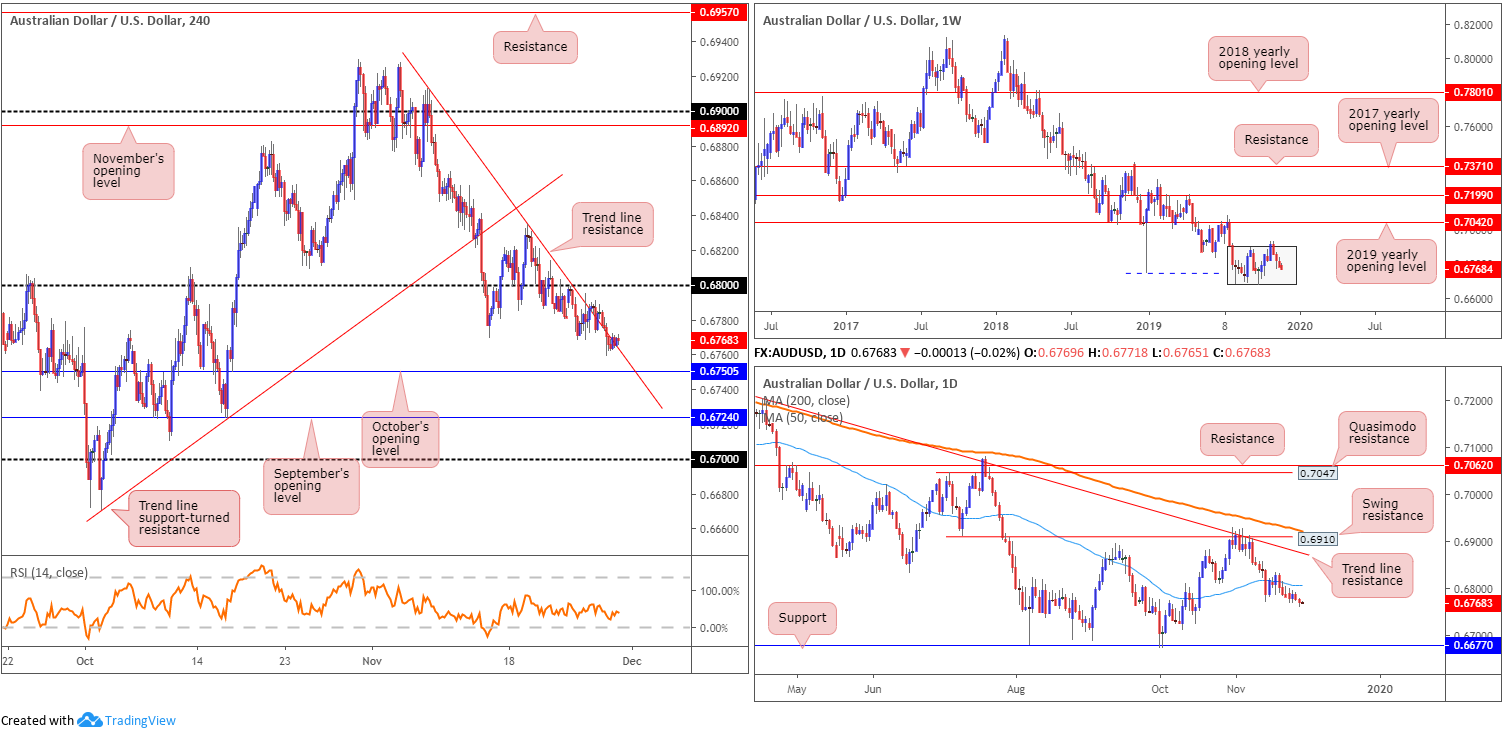
AUD/USD movement maintains its weaker tone below the 0.68 handle, with H4 trend line resistance, extended from the high 0.6913, withstanding a number of upside attempts. October’s opening level at 0.6750 represents the next downside target on the H4 timeframe, closely shadowed by September’s opening level at 0.6724 and then the 0.67 handle.
With respect to higher-timeframe action, limited change is seen. Weekly price remains trading mid-range between 0.6894/0.6677 (light grey). With a primary downtrend in play since early 2018, breaking through the lower edge of the said range is likely, with the next support target not visible until around 0.6359.
In terms of the daily timeframe, price continues to explore ground beneath the 50-day SMA (blue – 0.6805). Although support may develop around the 0.6728ish region, traders likely have their crosshairs fixed on support pencilled in from 0.6677.
Areas of consideration:
Outlook unchanged due to lacklustre movement.
From a technical perspective, sellers appear to have the upper hand right now. For any traders who remain short the retest at 0.68 (a noted move to watch for in previous reports) likely have October’s opening level at 0.6750 set as their initial take-profit zone.
USD/JPY:
(Italics – previous analysis).
Thanks to the Thanksgiving holiday in the US, Thursday observed limited movement. With that being the case, much of the following outlook will echo thoughts put forward in yesterday’s analysis.
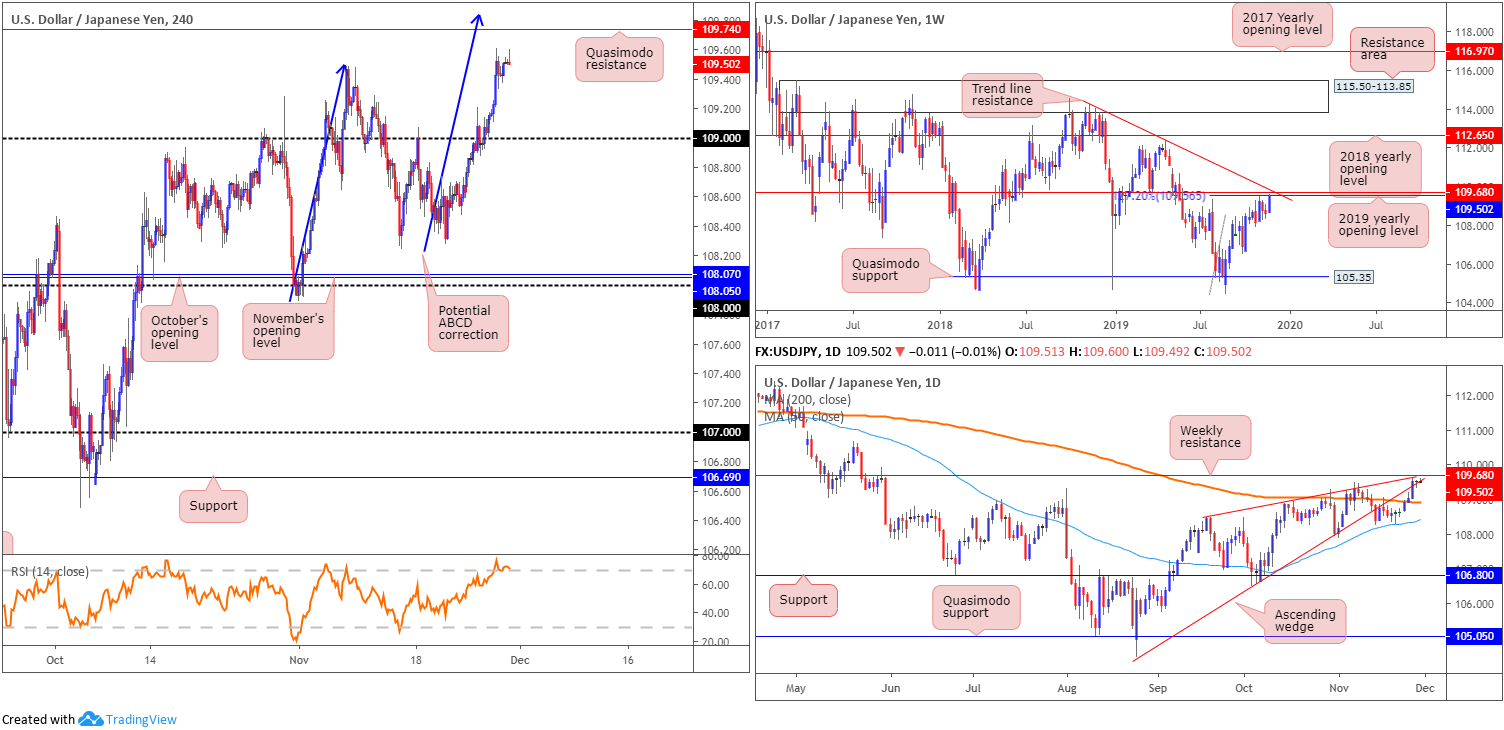
Weekly price is seen shaking hands with a 127.2% Fibonacci ext. point at 109.56 (taken from the low 104.44), closely shadowed by a nearby resistance at 109.68, the 2019 yearly opening level. In conjunction with weekly standing, price action on the daily timeframe is touching gloves with the ‘cradle point’ of a recently broken ascending wedge, formed from the low 104.44.
In terms of the H4 timeframe, we can see we recently formed a higher peak at 109.60, breaking the Nov. 7 previous higher peak at 109.48. Quasimodo resistance at 109.74 is the next key technical level in sight, with the 109 handle denoting possible support.
Areas of consideration:
Outlook unchanged due to lacklustre movement.
Despite the recent wave of buying, H4 Quasimodo resistance highlighted above at 109.74 is likely a key level for sellers, given its connection to weekly and daily structure. What’s also notable from a harmonic perspective is the H4 ABCD bearish pattern (blue arrows) at 109.08. A H4 bearish candle formed from 109.74, therefore, would likely be considered a key signal to selling this market and targeting the 109 region as the initial take-profit barrier.
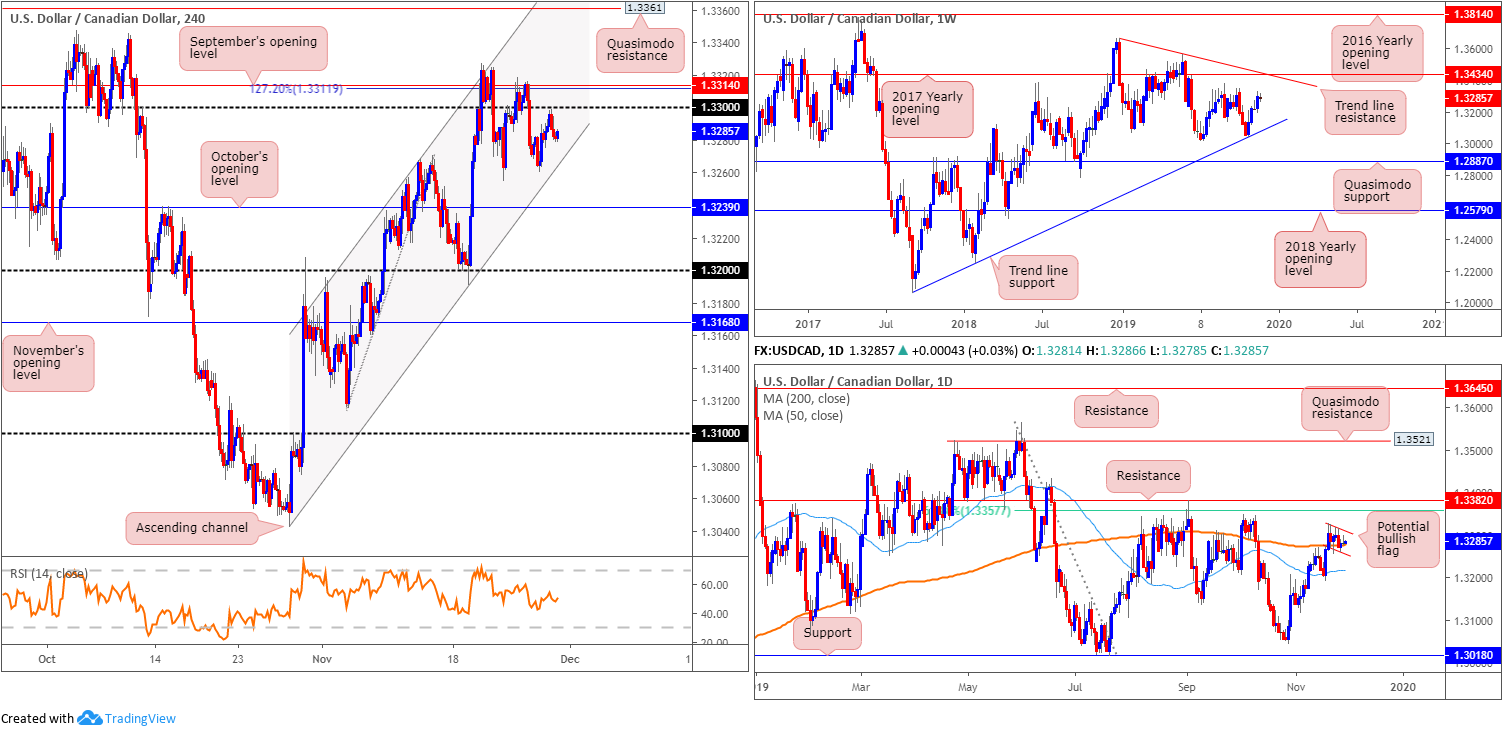
USD/CAD:
(Italics – previous analysis).
According to Statistics Canada Thursday, the current account deficit (on a seasonally adjusted basis) widened by $3.1 billion to $9.9 billion in the third quarter, following a reduction of $10.1 billion in the second quarter. The overall deficit on trade in goods and services rose by $2.4 billion, on a higher goods deficit.
Technically, USD/CAD action wrapped up Thursday unchanged, though did manage to clock a session high of 1.3299 amid US holiday-thinned trade. As a result of this, price action on the daily timeframe chalked up a shooting star formation, but given its position (encased within a daily bullish flag – red lines) it’s likely to be ignored. A breakout above the said bull flag has the 61.8% daily Fibonacci retracement ratio at 1.3357 to target, as well as nearby daily resistance plotted at 1.3382.
Medium-term flow based on H4 movement remains compressing within the confines of an ascending channel, taken from the low/high of 1.3042/1.3268. Upside resistance rests at the 1.33 handle, closely trailed by September’s opening level at 1.3314 and a 127.2% Fibonacci ext. point at 1.3311. Beneath the said channel support, support falls in around October’s opening level at 1.3239, followed by the 1.32 handle.
With respect to the weekly timeframe, price chalked up a healthy bullish candle last week. Adding more than 75 points, the unit has tops around 1.3342 in sight, closely followed by the 2017 yearly opening level at 1.3434 and trend line resistance taken from the peak at 1.3661. Overall, the immediate trend faces north since bottoming in September 2017, though this move could also be considered a deep pullback in a larger downtrend from the 1.4689 peak in early January 2016.
Areas of consideration:
Outlook unchanged due to lacklustre movement.
Entering long at the current H4 channel support is, of course, an option, though the barrier lacks confluence, both locally and on the higher timeframes. Waiting for additional candlestick confirmation to form before pulling the trigger is, therefore, certainly worth considering (entry/risk can be set according to this structure).
The H4 Quasimodo resistance at 1.3361 is also still likely of interest to many traders for potential shorts, knowing it fits between daily resistance at 1.3382 and the 61.8% Fibonacci retracement ratio at 1.3357.
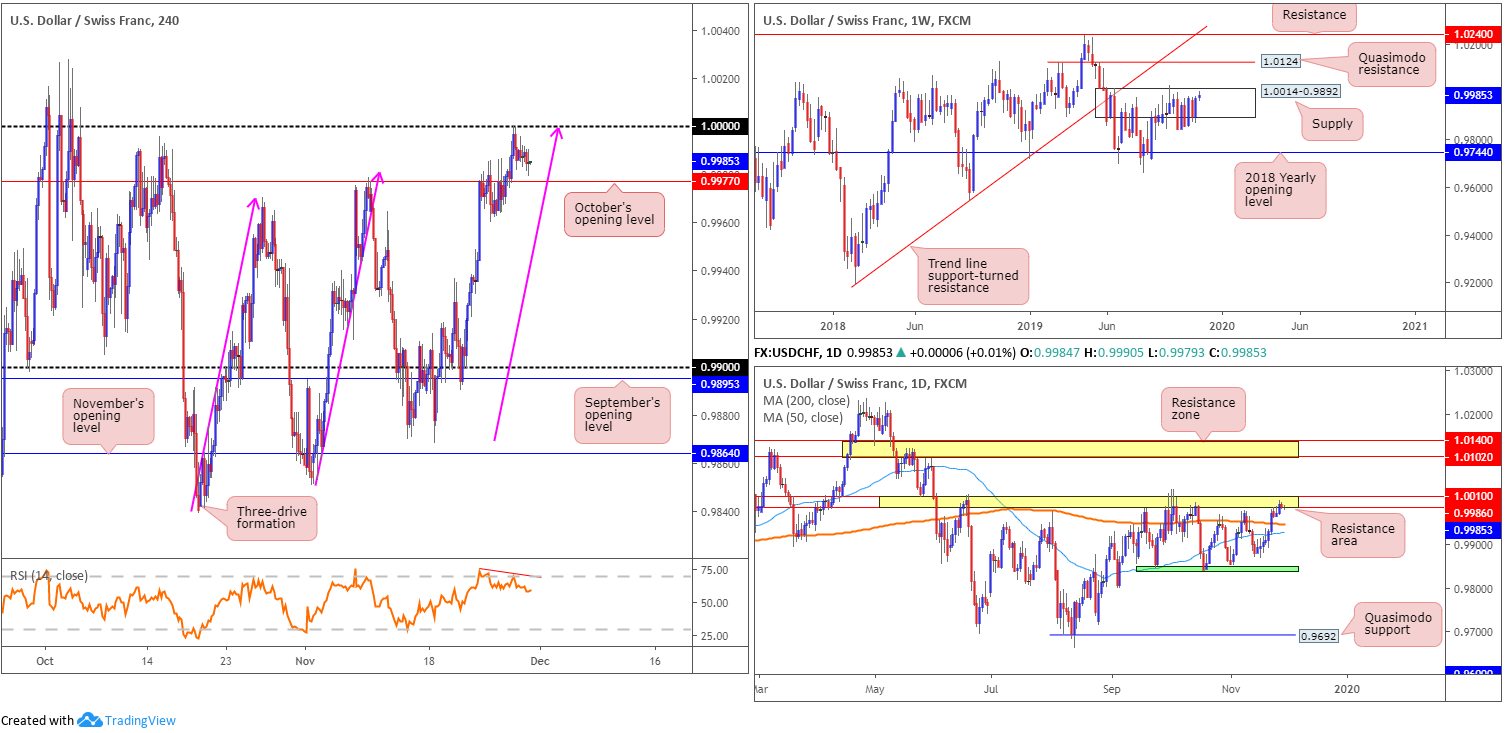
USD/CHF:
(Italics – previous analysis).
USD/CHF prices ended largely unchanged Thursday. Holiday-thinned trade out of the US kept the pair contained within its prior daily range between 1.0000/0.9967.
Weekly price action continues to trade within the upper confines of supply at 1.0014-0.9892. As highlighted in previous reports, the beginning of October witnessed a penetration to the outer edge of the supply area’s limit, possibly tripping a portion of buy stops and weakening sellers. An upside move out of the said supply may draw in Quasimodo resistance at 1.0124, while downside has the 2018 yearly opening level at 0.9744 in sight. According to the primary trend, price also reflects a slightly bullish tone; however, do remain aware we have been rangebound since the later part of 2015 (0.9444/1.0240).
As evident from the daily timeframe, recent buying absorbed both the 50-day SMA (blue – 0.9928) and 200-day SMA (orange – 0.9947). Traders may also want to acknowledge that since mid-September, the unit has been busy carving out a consolidation between support around the 0.9845ish region (green) and a resistance area coming in at 1.0010/0.9986. Note price is seen toying with upper edge of the said range, as we write.
1.0000 (parity), based on the H4 timeframe, remains in motion as sturdy resistance, further confirmed by the relative strength index (RSI) producing bearish divergence (red line). Not only is the level stationed within weekly supply at 1.0014-0.9892, it merges closely with a three-drive H4 pattern (pink arrows) and also inhabits the daily resistance area at 1.0010/0.9986. Well done to any readers who managed to fade 1.0000; the next downside target from this region falls in around October’s opening level at 0.9977.
Areas of consideration:
Outlook unchanged due to lacklustre movement.
Well done to any readers who managed to jump onboard 1.0000; the initial take-profit target, as highlighted above, falls in at 0.9977. A decisive push through 0.9977 potentially unlocks downside to the 200-day SMA on the daily timeframe around 0.9947.
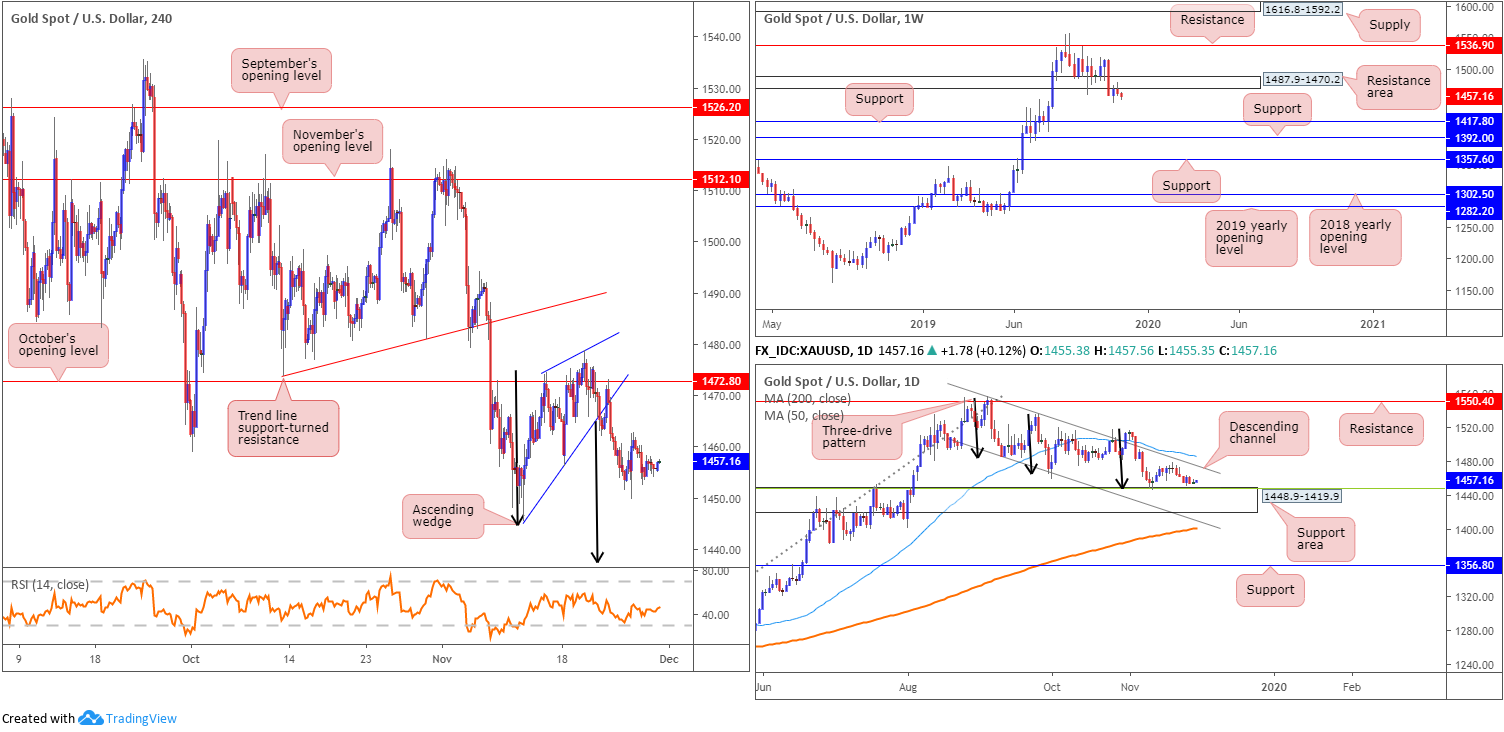
XAU/USD (GOLD):
(Italics – previous analysis).
Markets entered a subdued phase Thursday, largely due to US banks closing in observance of Thanksgiving Day.
Traders who remain short this market based on the breakout lower from the H4 ascending wedge pattern (1445.5) still likely have eyes on the top edge of a daily support area coming in at 1448.9-1419.9 (aligns closely with a 38.2% Fibonacci retracement ratio at 1448.5 and is further bolstered by the completion of a three-drive pattern – black arrows) as an initial target. The next port of call falls in around 1437.7, the H4 ascending wedge take-profit target (measured by taking the size of the base and applying the value to the breakout point [black arrows]).
From the weekly timeframe, the candles remain languishing south of a notable resistance area at 1487.9-1470.2. Further rejection off the underside of 1487.9-1470.2 potentially sets the long-term stage for a move towards two layers of support at 1392.0 and 1417.8.
Areas of consideration:
Outlook unchanged due to lacklustre movement.
Bullion is likely to shake hands with at least the top edge of the current daily support area at 1448.9, considered the first take-profit target out of the noted H4 ascending wedge. This is an ideal location to consider reducing risk to breakeven and liquidating a portion of the position.
The accuracy, completeness and timeliness of the information contained on this site cannot be guaranteed. IC Markets does not warranty, guarantee or make any representations, or assume any liability regarding financial results based on the use of the information in the site.
News, views, opinions, recommendations and other information obtained from sources outside of www.icmarkets.com.au, used in this site are believed to be reliable, but we cannot guarantee their accuracy or completeness. All such information is subject to change at any time without notice. IC Markets assumes no responsibility for the content of any linked site.
The fact that such links may exist does not indicate approval or endorsement of any material contained on any linked site. IC Markets is not liable for any harm caused by the transmission, through accessing the services or information on this site, of a computer virus, or other computer code or programming device that might be used to access, delete, damage, disable, disrupt or otherwise impede in any manner, the operation of the site or of any user’s software, hardware, data or property.


