
Key risk events today:
Limited.
(Previous analysis as well as outside sources – italics).
EUR/USD:
Weekly gain/loss: +1.33%
Weekly close: 1.2121
Weekly perspective:
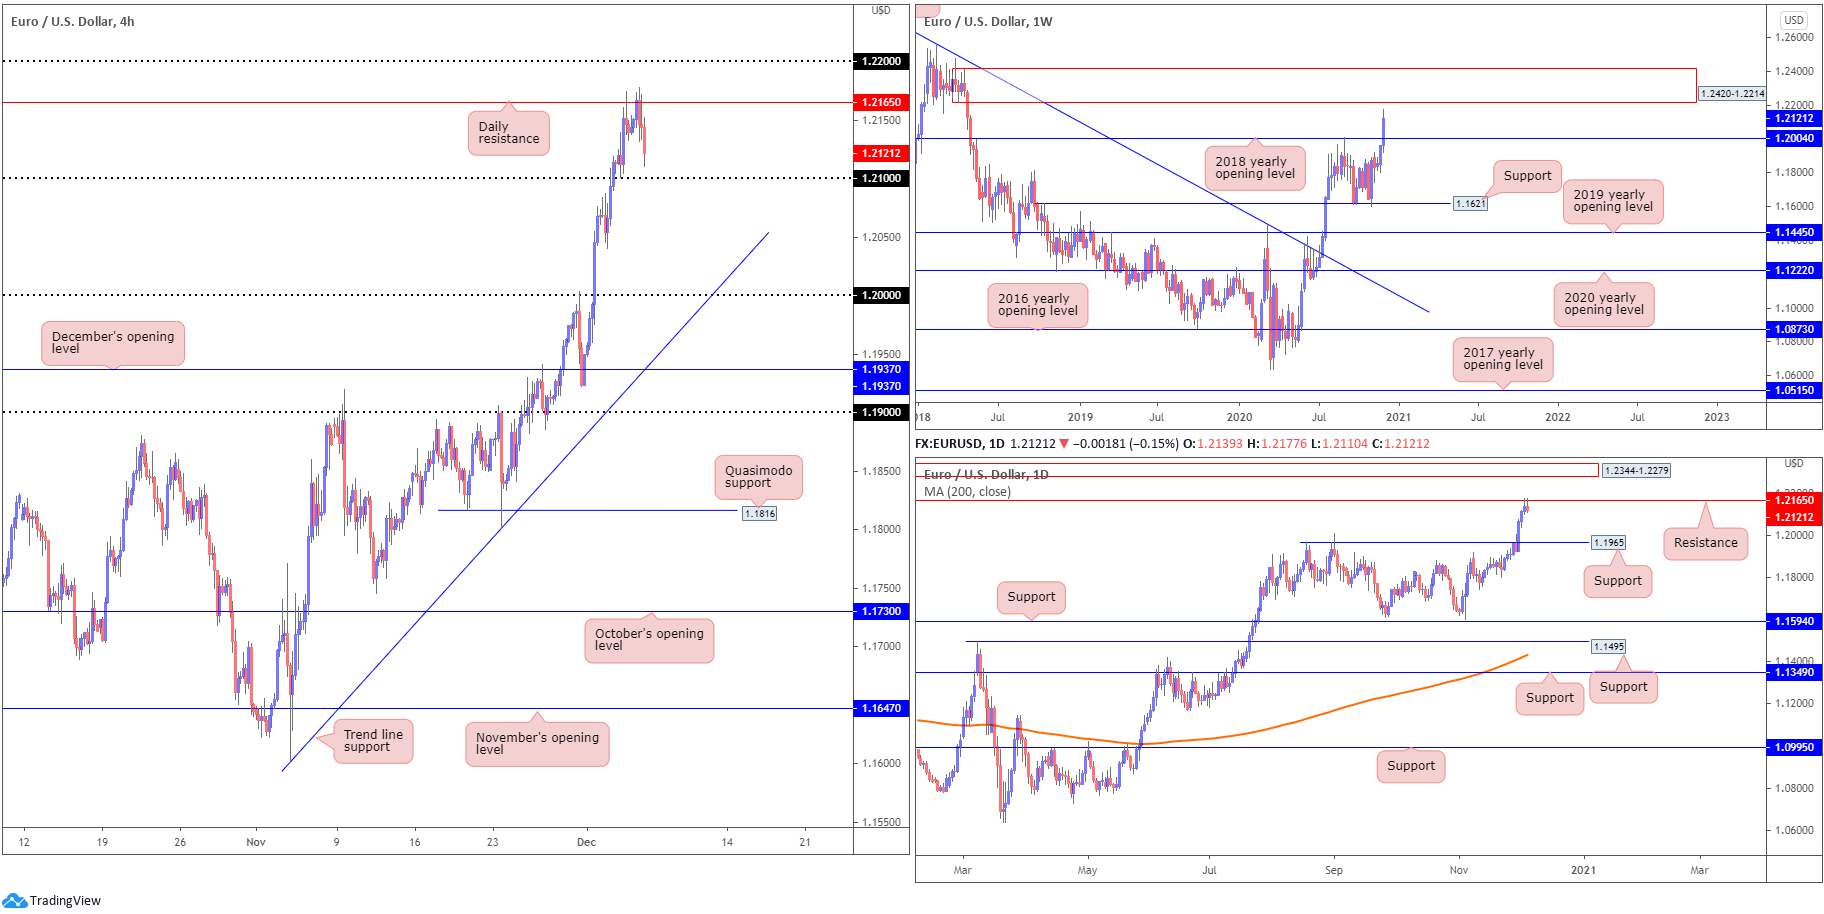
EUR/USD generated bold moves over the course of last week, rallying more than 150 pips and testing fresh YTD peaks. Underpinned on the back of USD softness (DXY ended the week down more than 1%), the technical picture on the weekly chart reveals the pair overwhelmed the 2018 yearly opening value at 1.2004, drawing out supply at 1.2420-1.2214.
In terms of trend, it seems upside remains favoured, more so if price overthrows the 1.2555 February 12 high (2018).
The above implies buyers may remain at the wheel this week until testing the aforementioned supply zone.
Daily perspective:
Before reaching weekly supply, buyers must contend with daily resistance at 1.2165.
1.2165 made an appearance into the second half of the week and produced back-to-back shooting star candles (bearish signals). A solid rejection here shines the spotlight on support at 1.1965, a previous Quasimodo resistance. A 1.2165 breach, on the other hand, swings the pendulum in favour of a run to supply drawn from 1.2344-1.2279 (sited within the parapets of current weekly supply).
H4 perspective:
Upside momentum slowed Friday, with buyers and sellers battling for position around daily resistance highlighted above at 1.2165. The US employment report revealed November payrolls increased by 240,000 vs. 480,000 consensus, while unemployment ticked lower to 6.7%, down from October’s 6.9% reading.
Important technical levels on the H4 this week, aside from resistance borrowed from the daily scale at 1.2165, are the 1.22 and 1.21 handles.
Areas of consideration:
- The uptrend remains in a healthy state, seen clearly from both the weekly and daily timeframes.
- Daily resistance (1.2165) is a level to be mindful of early week thanks to the recent daily bearish candlestick signals; downside pressure from here could bring in the 1.21 handle on the H4, a zone dip-buyers may draw to thanks to weekly price suggesting higher levels this week.
- 22 is a significant barrier, one which could entice sellers. A mild fakeout above the level, a whipsaw that not only taps into any buy-stop liquidity above 1.22 but also tests the underside of weekly supply at 1.2214, unlocks the possibility of fresh sellers making an appearance.
GBP/USD:
Weekly gain/loss: +0.93%
Weekly close: 1.3428
Weekly perspective:
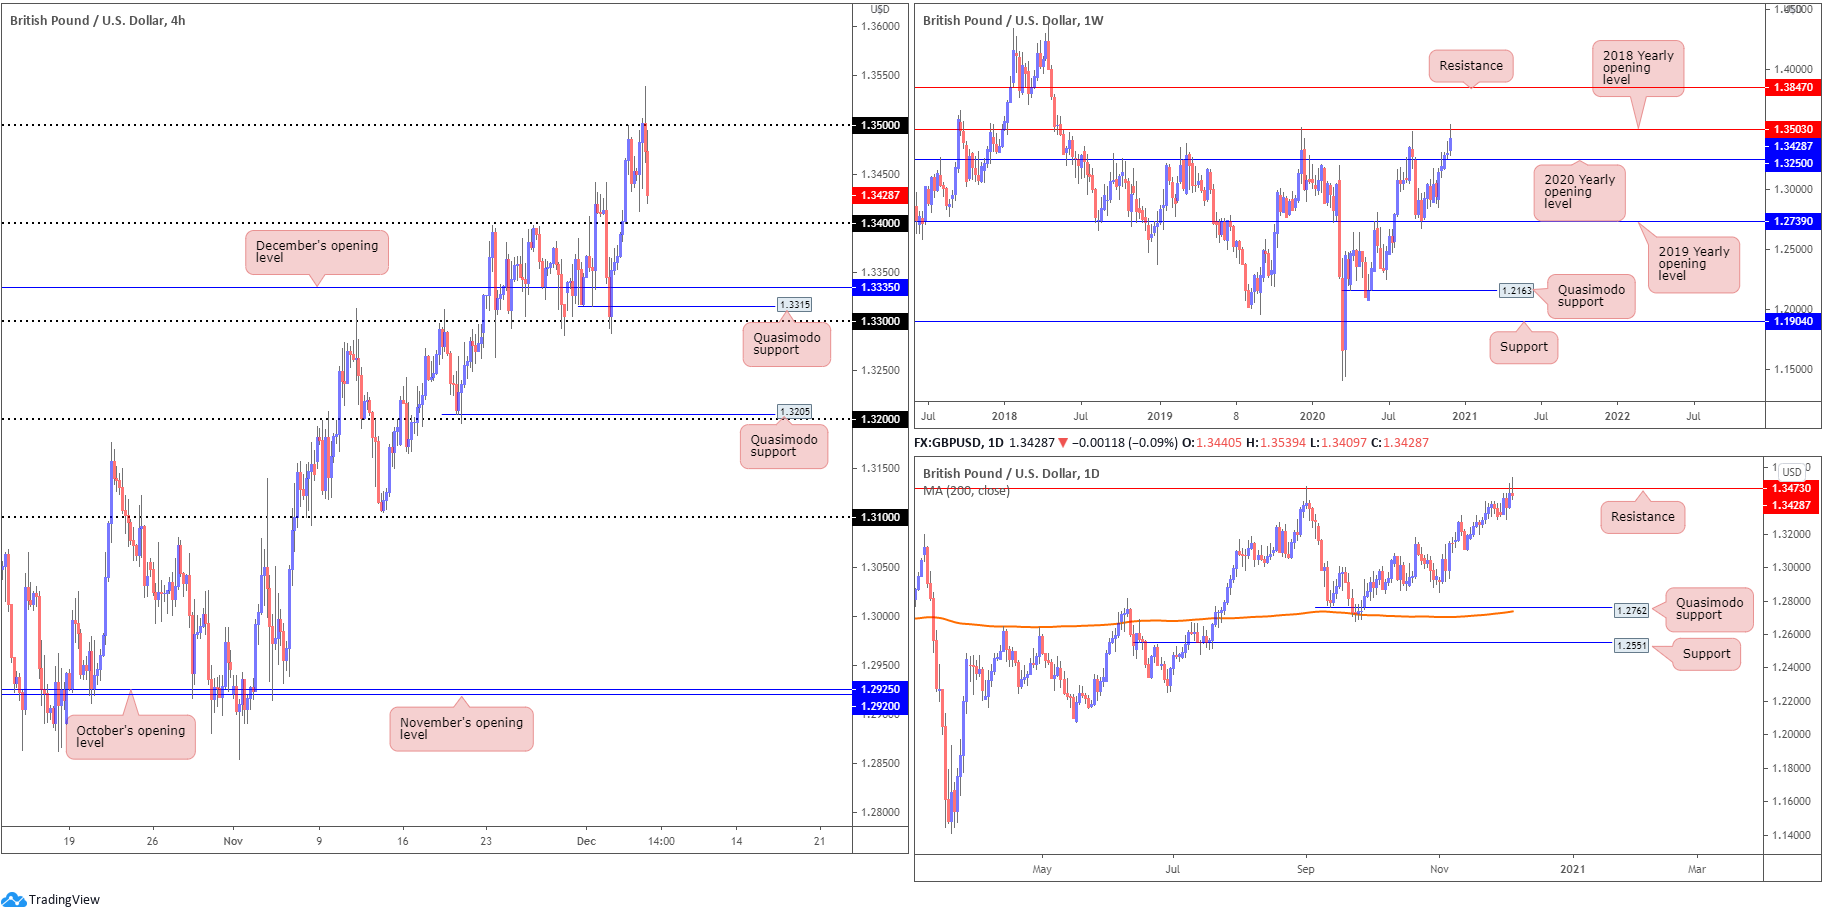
Over five consecutive weeks of upside, cable squeezed through the 2020 yearly opening value at 1.3250 and shook hands with the 2018 yearly opening value at 1.3503. A break of 1.3503 could send price as far north as resistance plotted at 1.3847.
Similar to EUR/USD, GBP/USD also managed to eke out fresh YTD highs last week, with the immediate trend pulling to the upside since March troughs at 1.1409.
Daily perspective:
The daily chart, as you can see, provides a magnified view of the current uptrend.
The chart also parades resistance at 1.3473, joining the fight on Thursday with price establishing a shooting star candle pattern Friday (bearish signal). Territory above the aforementioned resistance shows space for buyers to perhaps push as far north as resistance at 1.3763.
With both weekly and daily timeframes indicating resistance (capping upside since mid-2018), despite the uptrend in play, this could have sellers attempt to play offensively this week.
H4 perspective:
Unsurprisingly, the 1.35 handle on the H4 scale held ground Friday, bolstered by weekly and daily resistances (see above). The fakeout to yearly highs at 1.3539 likely caught a lot of traders on the wrong side of the market: breakout buyers and traders attempting to fade the round number.
Aside from possible resistance forming off 1.3569 (May 17 high, 2018), space above 1.35 shows 1.36 could be next in line should buyers make another push this week. However, with strong downside emerging into Friday’s close, the 1.34 handle is in sight.
Areas of consideration:
- The 1.35 region remains interesting resistance this week, merging closely with weekly resistance at 1.3503 and daily resistance found at 1.3473.
- The trend remains to the upside, therefore a daily close forming north of 1.35 could activate breakout bullish scenarios, targeting at least 1.36.
- 34 is a support area to be aware of, with a break lower (possibly triggering bearish action) throwing December’s opening value at 1.3335, H4 Quasimodo support at 1.3315 and the 1.33 handle in the mix.
AUD/USD:
Weekly gain/loss: +0.67%
Weekly close: 0.7425
Weekly perspective:
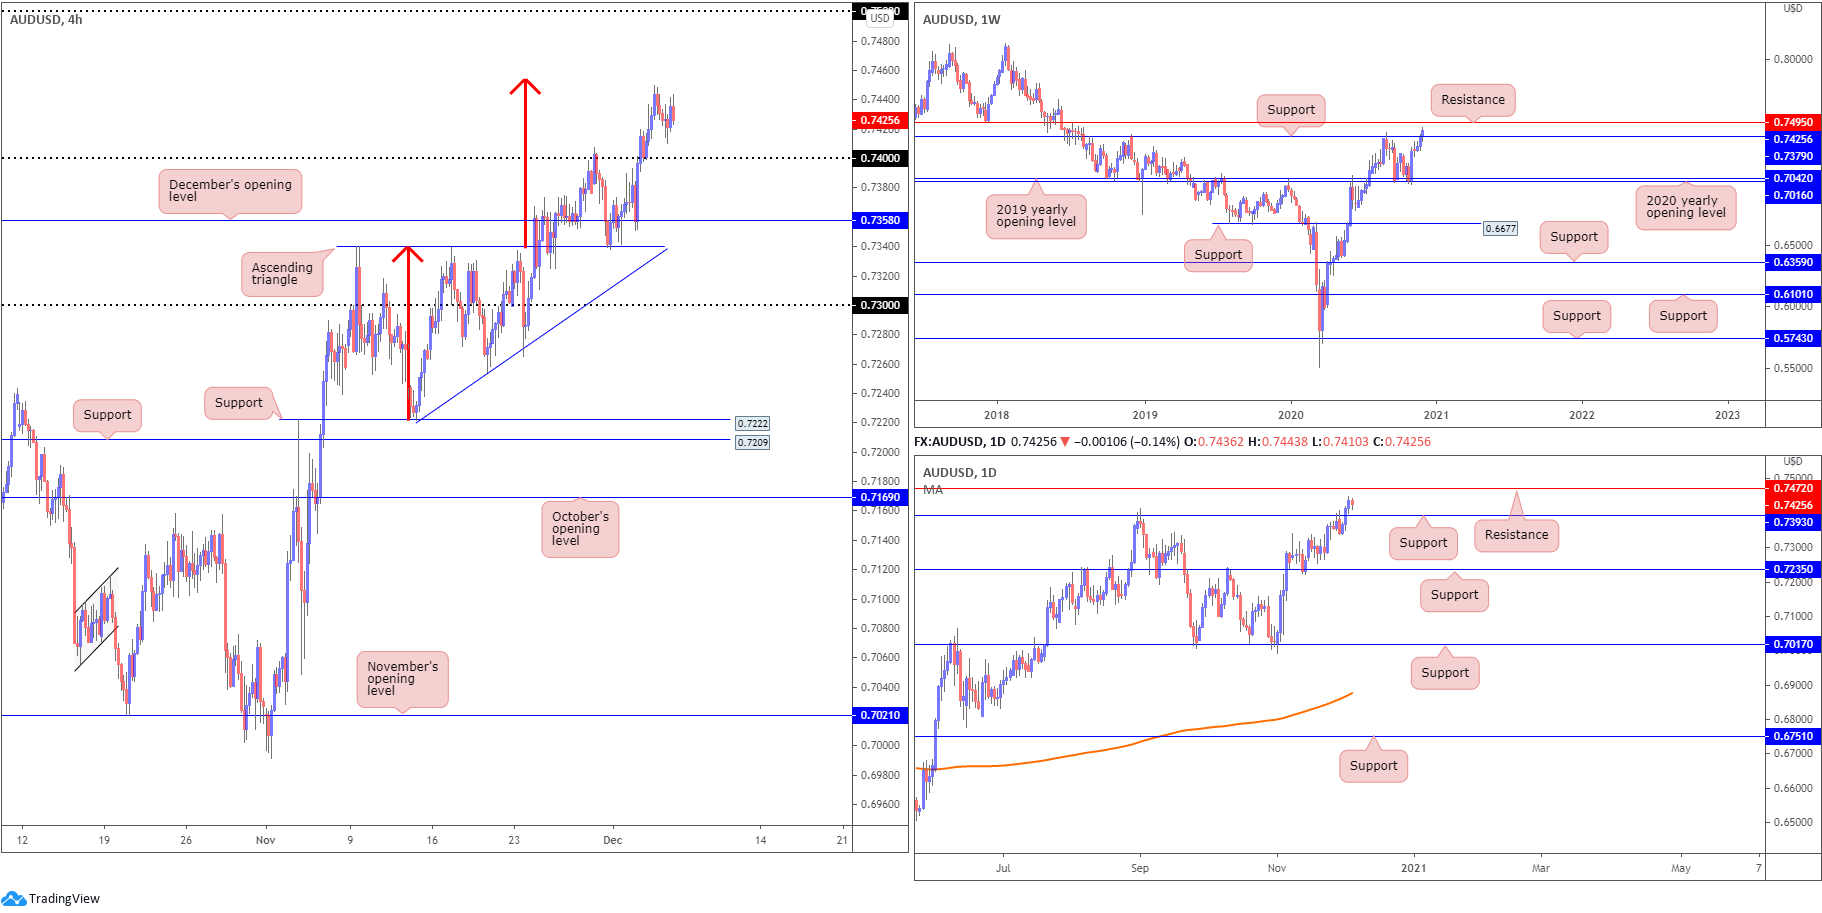
After retesting the 2020 (0.7016) and 2019 (0.7042) yearly opening values (supports) in early November, last week established a third consecutive weekly gain and climbed resistance at 0.7379 (now possible support), registering fresh YTD highs
In view of this market trending higher since early 2020, buyers may also be eyeballing resistance parked at 0.7495 this week.
Daily perspective:
In similar fashion to the weekly timeframe, price action on the daily timeframe bumped through resistance at 0.7393 during mid-week trading. This likely has traders’ crosshairs focused on resistance at 0.7472, sited just beneath weekly resistance at 0.7495.
Both weekly support at 0.7379 and daily support at 0.7393, therefore, may be a zone buyers have on their watchlists this week.
H4 perspective:
AUD/USD buyers found some legs Friday, following the latest US non-farm payrolls release which consequently formed a modest bottom above the 0.74 handle at 0.7410.
For those who read last week’s technical briefings you may recall the following (italics):
Recent trade retested 0.7340, the upper boundary of a H4 ascending triangle pattern, and challenged the underside of the 0.74 handle. Above, traders may be looking towards the ascending triangle take-profit target (red arrows) at 0.7453.
As can be seen from the H4 chart, 0.74 was recently taken with buyers seen closing in on the ascending triangle take-profit target.
Areas of consideration:
- Buyers long the ascending triangle support at 0.7340 likely reduced risk at 0.74 with many now eyeing 7453 as an initial take-profit region. Daily price demonstrating scope to approach resistance at 0.7472, together with weekly price honing in on resistance from 0.7495 shows buyers may push beyond 0.7453 in favour of higher timeframe resistances.
- In light of the above signalling a rally may come about, a dip to 0.74 (H4) may ignite dip-buyers, targeting the aforementioned resistances (bold). Conservative players from 0.74 could seek additional bullish confirmation to sidestep any potential 0.74 fakeout, a common viewing around round numbers.
USD/JPY:
Weekly gain/loss: +0.12%
Weekly close: 104.17
Weekly perspective:
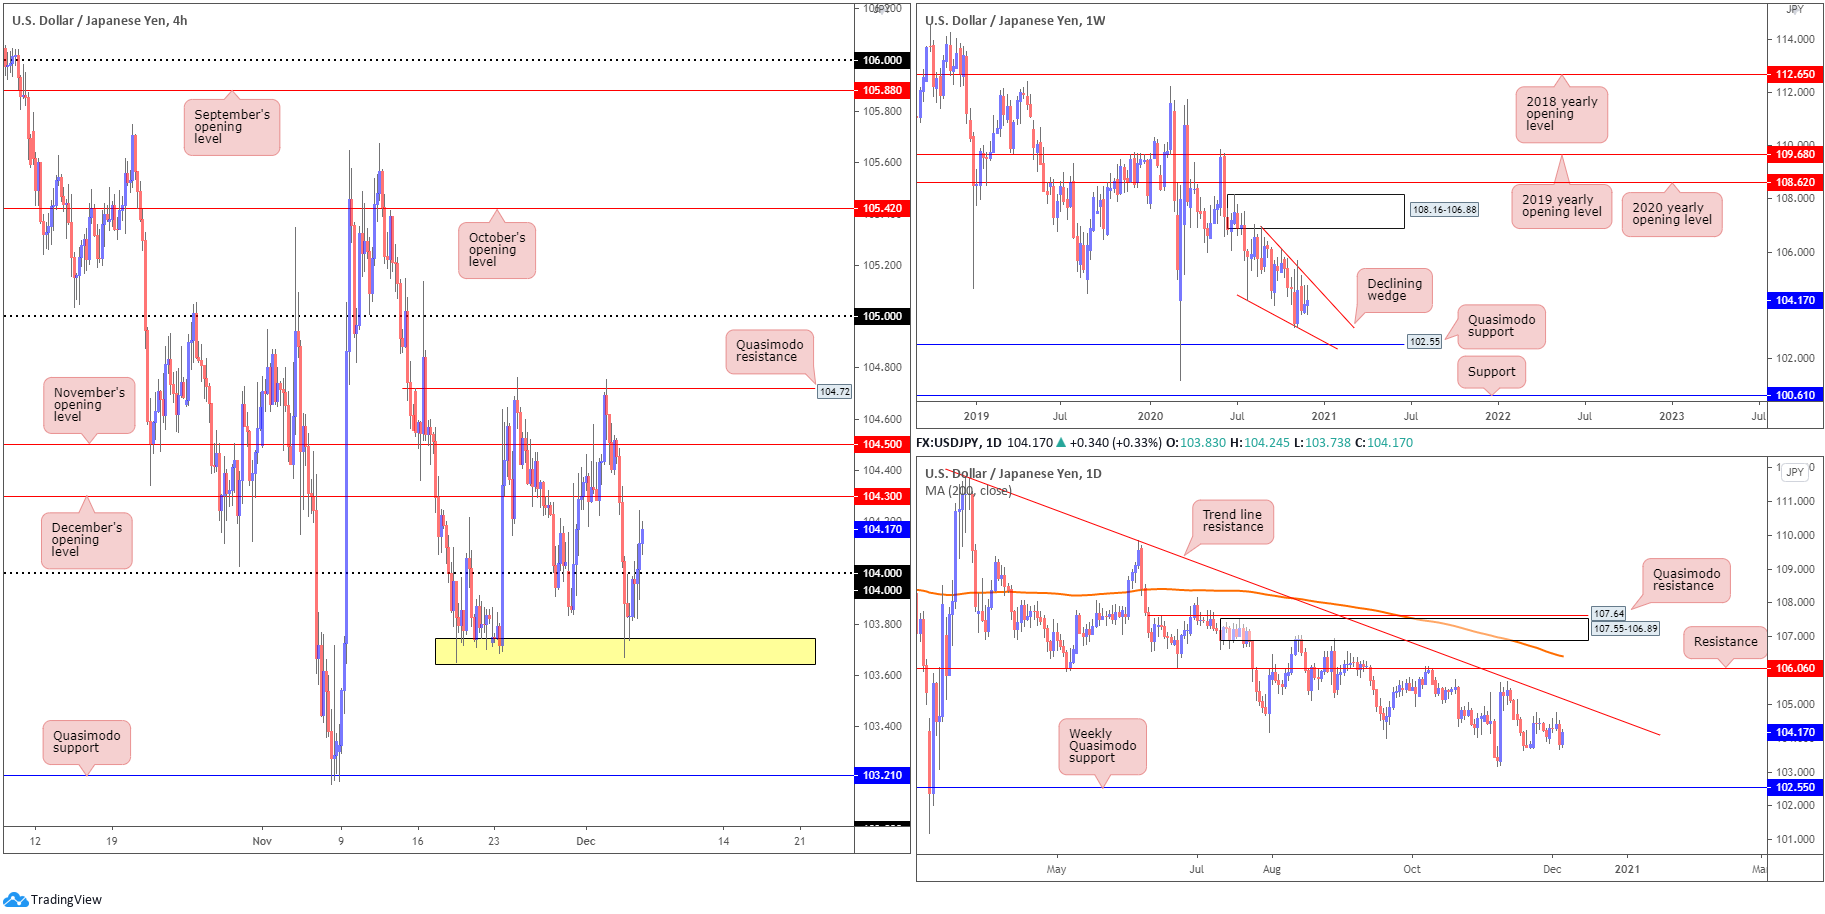
Since connecting with the underside of supply at 108.16-106.88 in August, price has gradually shifted lower and developed a declining wedge (106.94/104.18).
Quasimodo support at 102.55 is also in the picture this week, with a break revealing support plotted at 100.61. A strong bounce from 102.55 may provide enough impetus for buyers to attempt a breakout above the current declining wedge.
Daily perspective:
The technical landscape from the daily timeframe reveals scope to close in on trend line resistance, extended from the high 111.71. Sellers taking over, however, could lead price to the 103.17 November 6 low, followed by the noted weekly Quasimodo support at 102.55.
H4 perspective:
Upbeat risk sentiment along with rising US treasury yields lifted USD/JPY Friday, reclaiming a portion of Thursday’s losses. The plot of support around 103.70 (yellow) served buyers well, sending recent action back above the 104 handle to highs at 104.24.
Overhead, December’s opening value can be found at 104.30, closely shadowed by November’s opening value priced in at 104.50 and then Quasimodo resistance at 104.72.
Areas of consideration:
- Intraday flow conquering 104 to the upside possibly sets the stage for bullish themes towards December’s opening value at 104.30. As a result, a retest at 104 may take shape.
- Removing H4 support around 103.70 this week moves H4 Quasimodo support at 103.21 on to the radar as a possible downside objective for intraday bearish scenarios.
USD/CAD:
Weekly gain/loss: -1.59%
Weekly close: 1.2783
Weekly perspective:
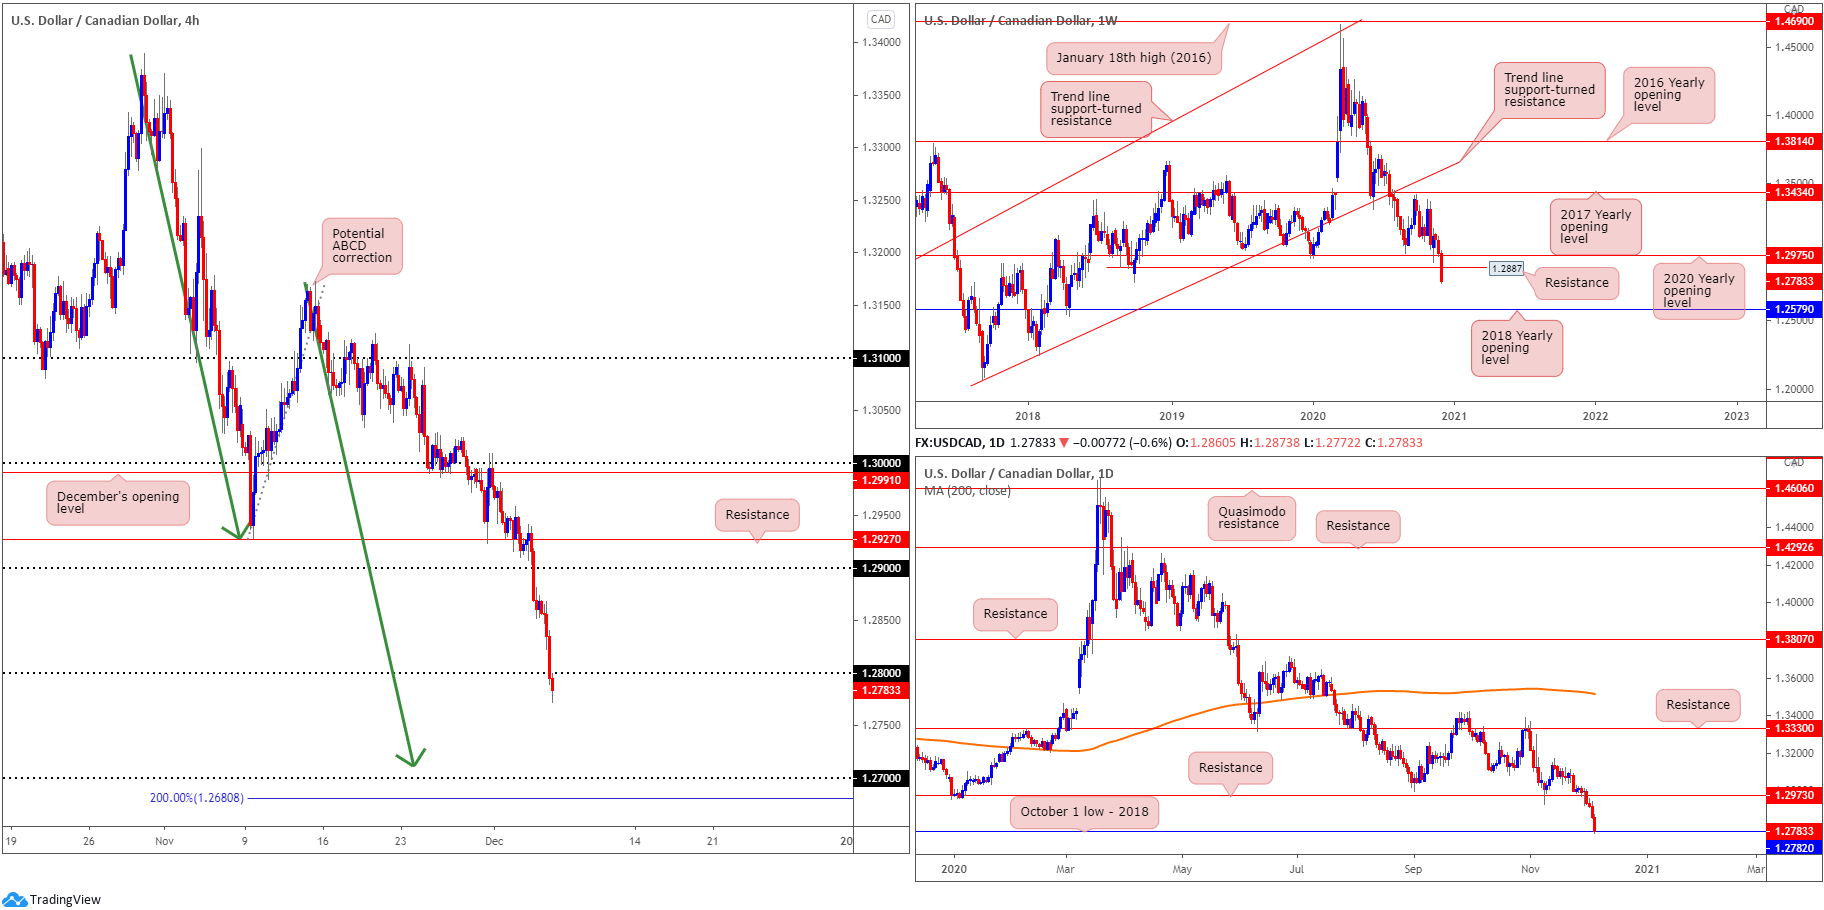
Down more than 200 pips, USD/CAD obliterated the 2020 yearly opening value at 1.2975 and Quasimodo support coming in at 1.2887. With both levels depicting resistance this week, sustained downside places the 2018 yearly opening value at 1.2579 in the firing line.
Long-term flow pointing lower since topping in March, sellers appear to be in the driving seat based on the weekly chart.
Daily perspective:
Over the course of four mostly dominant bearish candles, last week absorbed support at 1.2973 (now possible resistance) and crossed swords with October’s low (2018) at 1.2782.
A lack of bullish commitment from 1.2782 this week warrants attention, as limited support is seen beneath the level until the 2018 yearly opening value underlined above on the weekly scale.
H4 perspective:
Upbeat Canadian employment data reinforced demand for the Canadian dollar on Friday, consequently guiding USD/CAD lower.
In recent trading, the pair made swift work of 1.29 and 1.28 levels, arguing sellers still have some gas left in the tank this week to perhaps approach 1.27, a psychological level accompanied by an ABCD correction (green arrows) at 1.2711 and a 2.0 BC projection.
Areas of consideration:
- Weekly price showing a reasonably free rein to the 2018 yearly opening value at 1.2579, signals H4 breakout sellers south of 1.28 could target 1.27 this week. Despite this, a possible scenario to be mindful of is a retest at 1.28. Rejecting this level, particularly if shaped by a bearish candlestick pattern, could welcome additional sellers into the fight.
- Conservative sellers, however, may seek a daily close below October lows (2018) at 1.2782 (daily timeframe) before committing.
USD/CHF:
Weekly gain/loss: -1.41%
Weekly close: 0.8916
Weekly perspective:
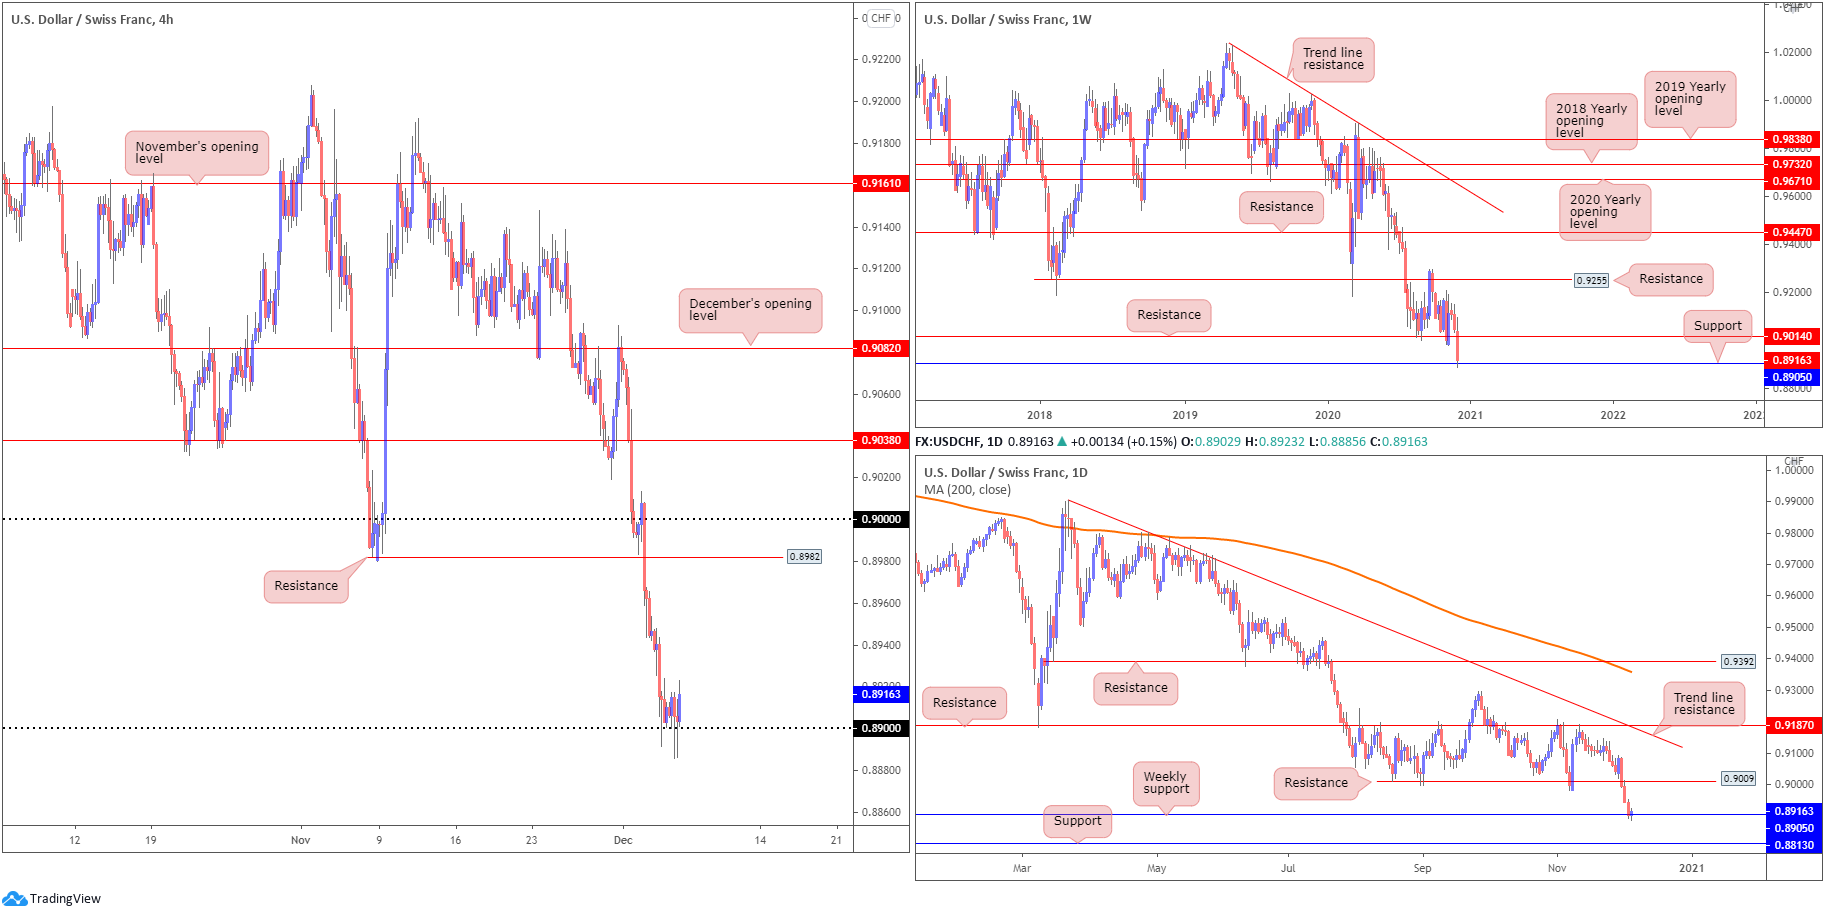
Last week’s 120-pip decline, detailing a third consecutive weekly loss, enveloped support at 0.9014 (now possible resistance) and embraced support coming in at 0.8905.
While buyers could attempt a recovery off 0.8905 this week, traders are urged to pencil in the possibility of refreshing multi-year lows and shining the limelight on support at 0.8696.
Interestingly, the trend in this market has been lower since early 2019.
Daily perspective:
A similar picture is evident on the daily timeframe as we head into a fresh week.
Below weekly support at 0.8905 on the daily scale, support is seen at 0.8813, while a 0.8905 rejection could reignite interest in daily resistance at 0.9009.
H4 perspective:
Friday’s US non-farm payrolls shuffled price action around the 0.89 handle, spiking beneath the round number and likely tripping stops. Limited resistance is visible on the H4 scale this week until reaching 0.8982 and the key figure 0.90, which merges closely with daily resistance at 0.9009.
Below 0.90, however, daily support is seen as the next downside target at 0.8813, fixed just north of the 0.88 handle.
Areas of consideration:
- 89 and weekly support at 0.8905 form strong confluence to be conscious of this week, though the trend in this market has been lower since April 2019 (see weekly timeframe).
- 89 giving way underscores a potential bearish scene to daily support at 0.8813. Conservative sellers may pursue a retest of 0.89 before pulling the trigger.
Dow Jones Industrial Average:
Weekly gain/loss: +0.72%
Weekly close: 30,156
Weekly perspective:
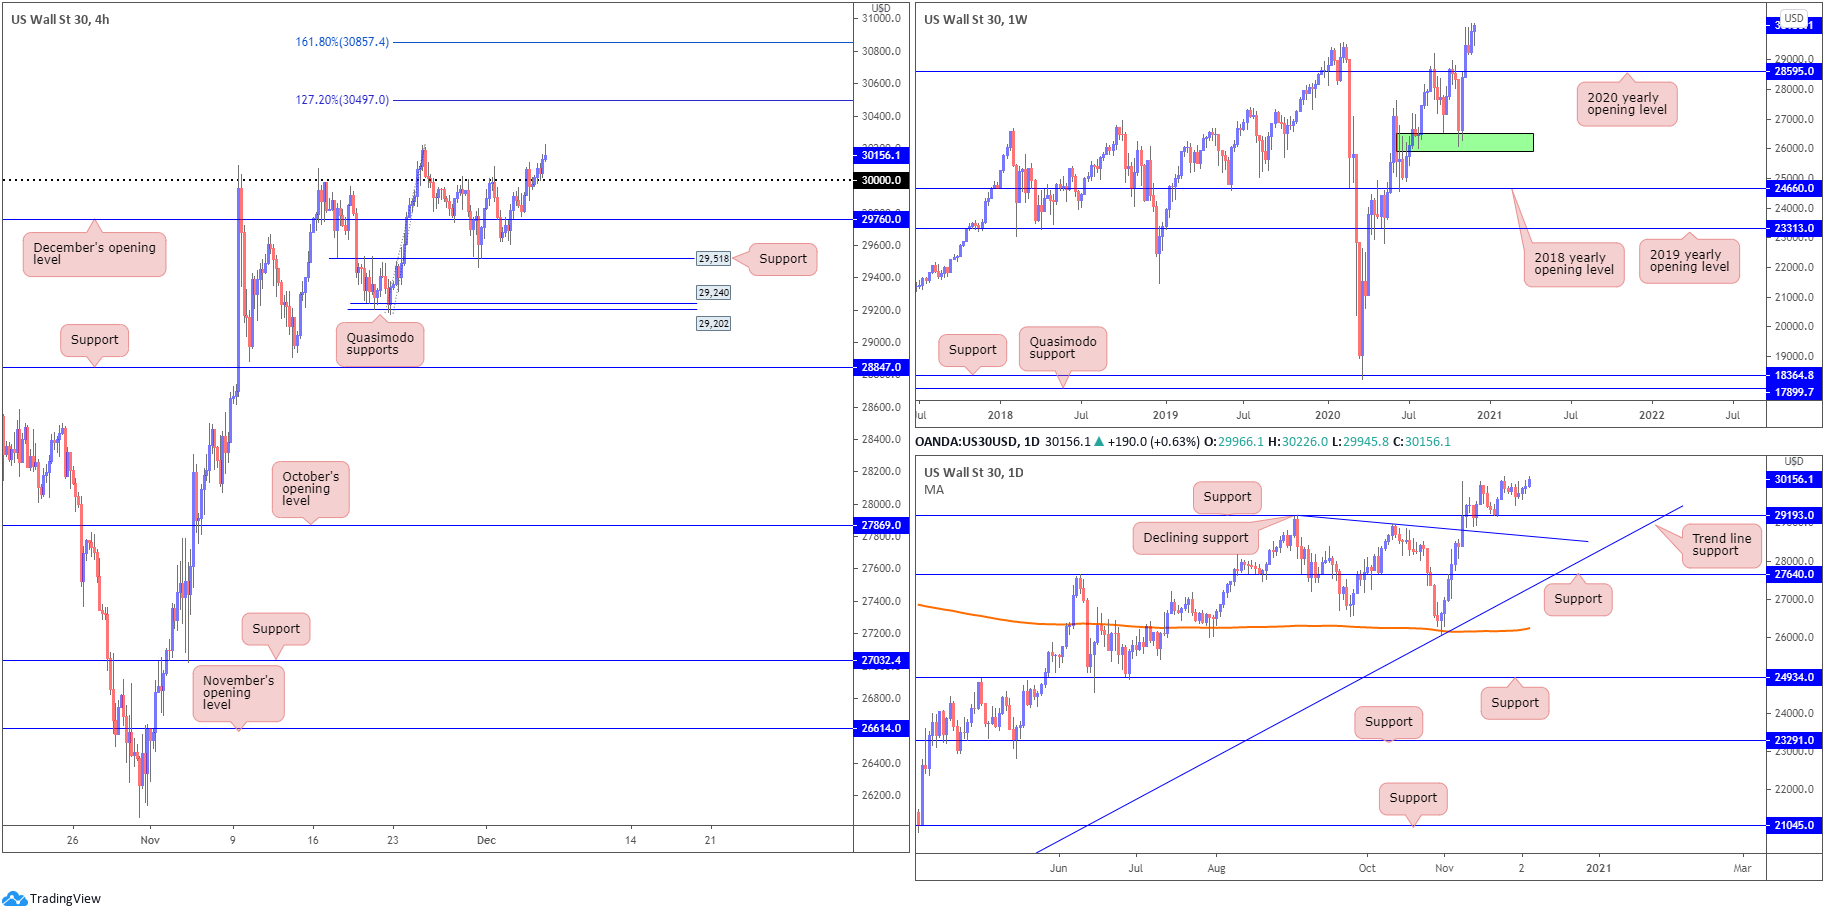
Last week, as evident from the weekly chart, ended the session considerably off lows and refreshed all-time highs at 30,226. Follow-through breakout buying, therefore, may unfold this week.
However, in the event a correction materialises, the 2020 yearly opening value from 28595 could be an area dip-buyers find interest in.
Daily perspective:
According to the daily timeframe, we can see price left support at 29,193 unchallenged last week, bottoming early in the session at 29,465.
Should a decline form this week, support at 29,193 will likely be the first port of call, with a break exposing declining support, taken from the high 29,193 (merges closely with 28595 on the weekly scale).
H4 perspective:
US equities finished the week in positive territory, with the Dow Jones clocking fresh all-time peaks and chalking up a second consecutive weekly gain.
The Dow Jones Industrial Average added 248.74 points on Friday, or 0.83%; the S&P 500 traded higher by 32.40 points, or 0.88% and the Nasdaq rallied by 87.05 points, or 0.70%.
The widely watched 30,000 figure was taken into the second half of the week, despite capping upside attempts since early November. The removal of 30,000 saw Friday’s H4 closing candle produce a shooting star pattern off all-time highs. Although a bearish signal, sellers are unlikely to commit with 30,000 perhaps serving as support.
Subsequent buying may reach for the 127.2% Fibonacci projection point at 30,497, followed by the 161.8% Fibonacci projection point at 30,857.
Areas of consideration:
- The swift 30,000 retest on the H4 Friday clearly interested buyers. Upside targets rest at 30.497 and 30,857. Should another 30,000 retest form this week, particularly if in the shape of a H4 bullish candle pattern, this may convince additional buyers to join.
XAU/USD (GOLD):
Weekly gain/loss: +2.90%
Weekly close: $1,838
Weekly perspective:
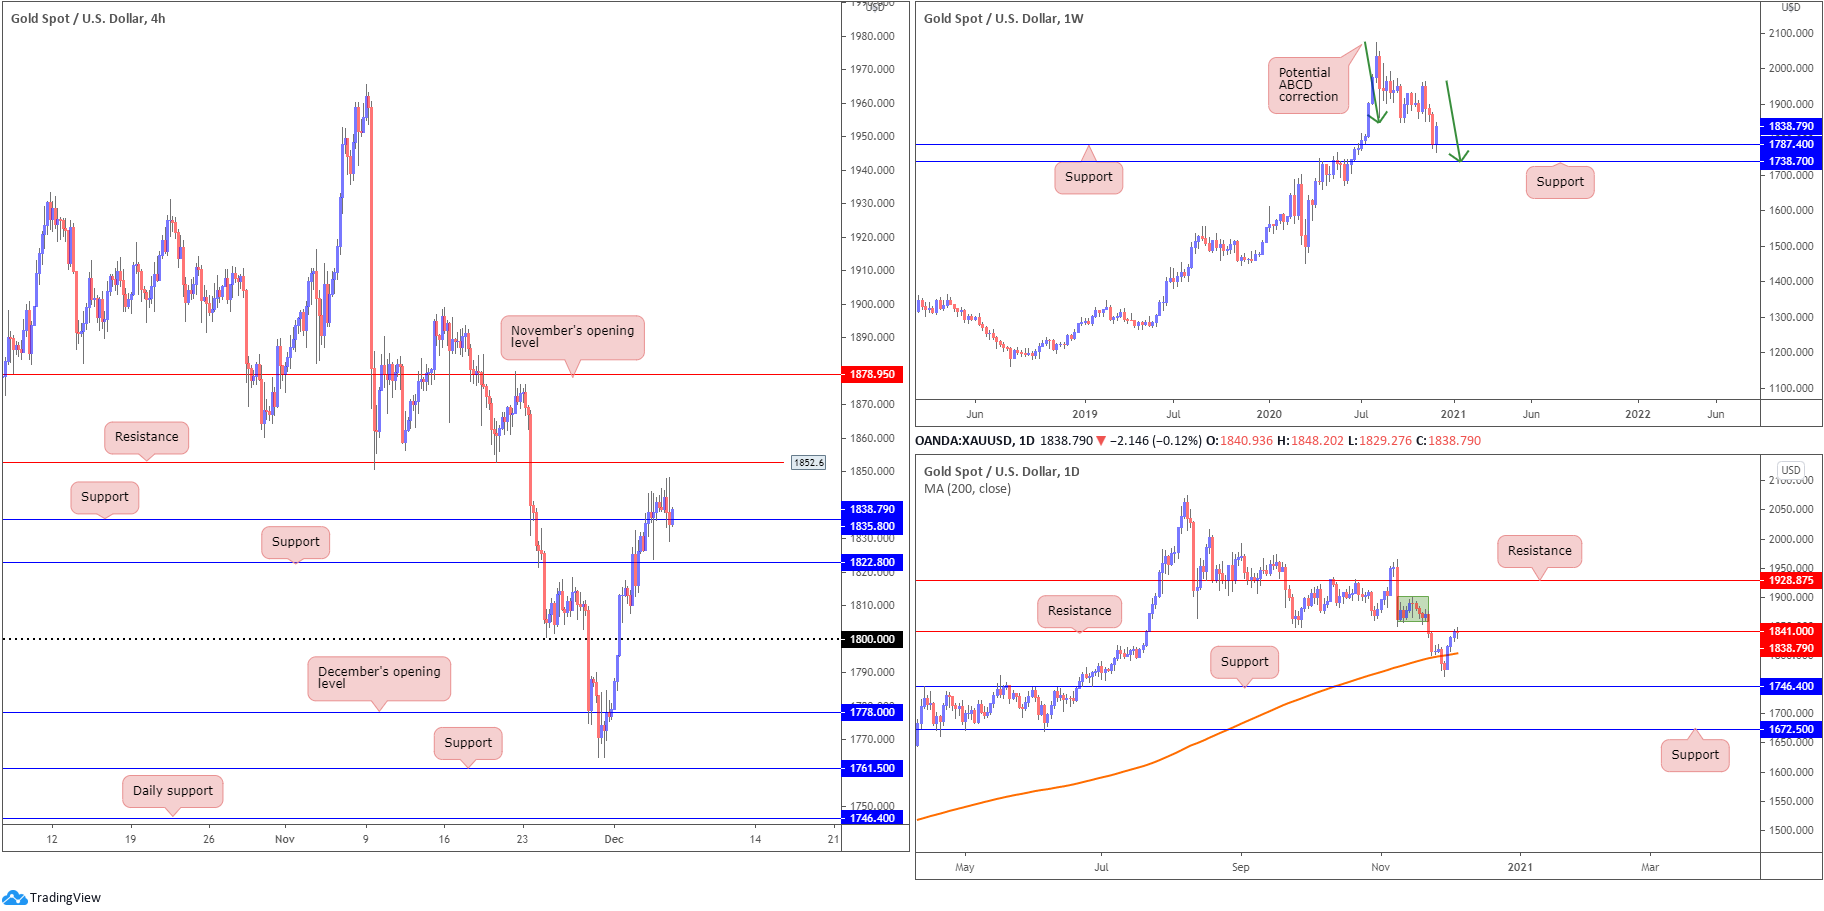
The weekly timeframe reveals the prospects of further buying, following the retest of support at $1,787 last week (sited ahead of another support at $1,738 and a potential ABCD correction [green arrows]). The fact the yellow metal has been decisively trending higher since the beginning of 2016 adds to the bullish narrative off $1,787.
Daily perspective:
Meanwhile, on the daily chart, buyers conquered the 200-day SMA (orange – $1,803) earlier in the week and eventually shook hands with resistance at $1,841 by Friday’s close. Considering the recent break of the 200-day SMA is likely to be interpreted as a bullish indication, rupturing the aforementioned resistance this week would help further confirm the weekly timeframe’s bullish vibe.
Defeating $1,841 also draws interest towards possible supply around 1,878ish and resistance plotted above it at $1,928.
Traders will also acknowledge Friday closed in the shape of an indecision candle.
H4 perspective:
Early week observed buyers climb $1,800 resistance, with subsequent buying overthrowing resistance at $1,822 (now support). Another layer of resistance was taken at $1,835 on Thursday, with the break exposing resistance at $1,852.
Although buyers held $1,835 as support Friday, opposition is seen nearby in the form of daily resistance mentioned above at $1,841.
Areas of consideration:
- Uptrend remains strong (check weekly timeframe).
- Buyers appear free to take things higher this week, according to the trend and weekly support at $1,787.
- H4 buyers have some room to climb off support at $1,835, targeting H4 resistance at $1,852. Nevertheless, buyers are clearly cautious given daily resistance entering the fold at $1,841. A H4 bullish candlestick signal forming could help convince some buying. Conservative buyers may even seek a H4 close above $1,852 before considering bullish positions, targeting November’s opening value at $1,878 (H4).
The accuracy, completeness and timeliness of the information contained on this site cannot be guaranteed. IC Markets does not warranty, guarantee or make any representations, or assume any liability regarding financial results based on the use of the information in the site.
News, views, opinions, recommendations and other information obtained from sources outside of www.icmarkets.com.au, used in this site are believed to be reliable, but we cannot guarantee their accuracy or completeness. All such information is subject to change at any time without notice. IC Markets assumes no responsibility for the content of any linked site.
The fact that such links may exist does not indicate approval or endorsement of any material contained on any linked site. IC Markets is not liable for any harm caused by the transmission, through accessing the services or information on this site, of a computer virus, or other computer code or programming device that might be used to access, delete, damage, disable, disrupt or otherwise impede in any manner, the operation of the site or of any user’s software, hardware, data or property


