
DXY:
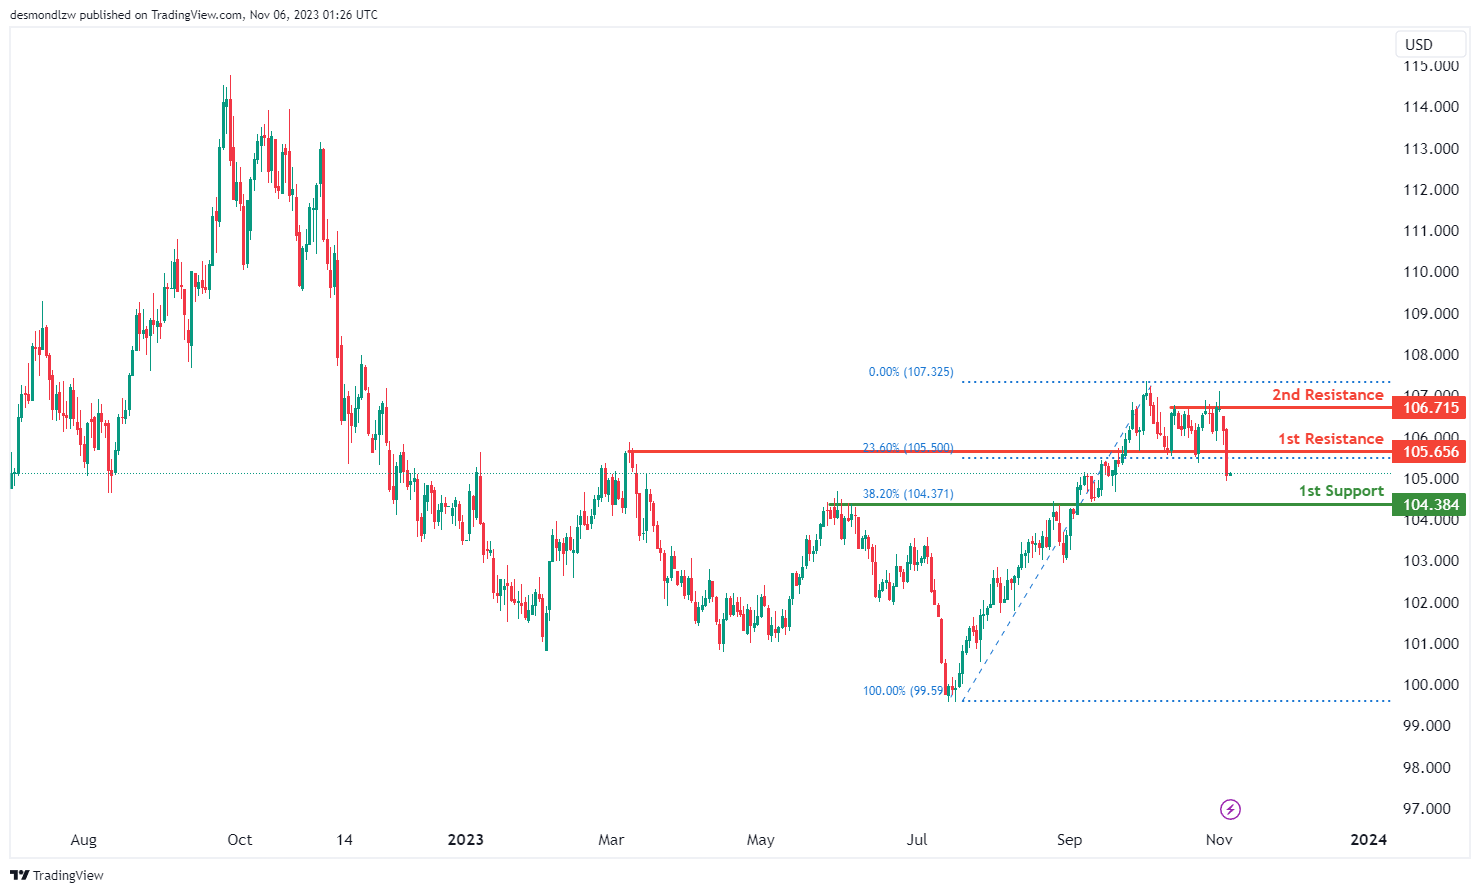
The DXY (US Dollar Index) chart currently has a bearish overall momentum, suggesting the potential for a bearish reaction off the 1st resistance level and a drop towards the 1st support.
The 1st support at 104.38 is identified as an overlap support and is associated with the 38.20% Fibonacci Retracement level, indicating it could be a significant level where the price might find some buying interest.
On the resistance side, the 1st resistance at 105.65 is categorized as a pullback resistance, suggesting it could act as a level where the price may face selling pressure.
The 2nd resistance at 106.71 is defined as a multi-swing high resistance, indicating another potential level where the price may encounter obstacles in its upward movement.
EUR/USD:
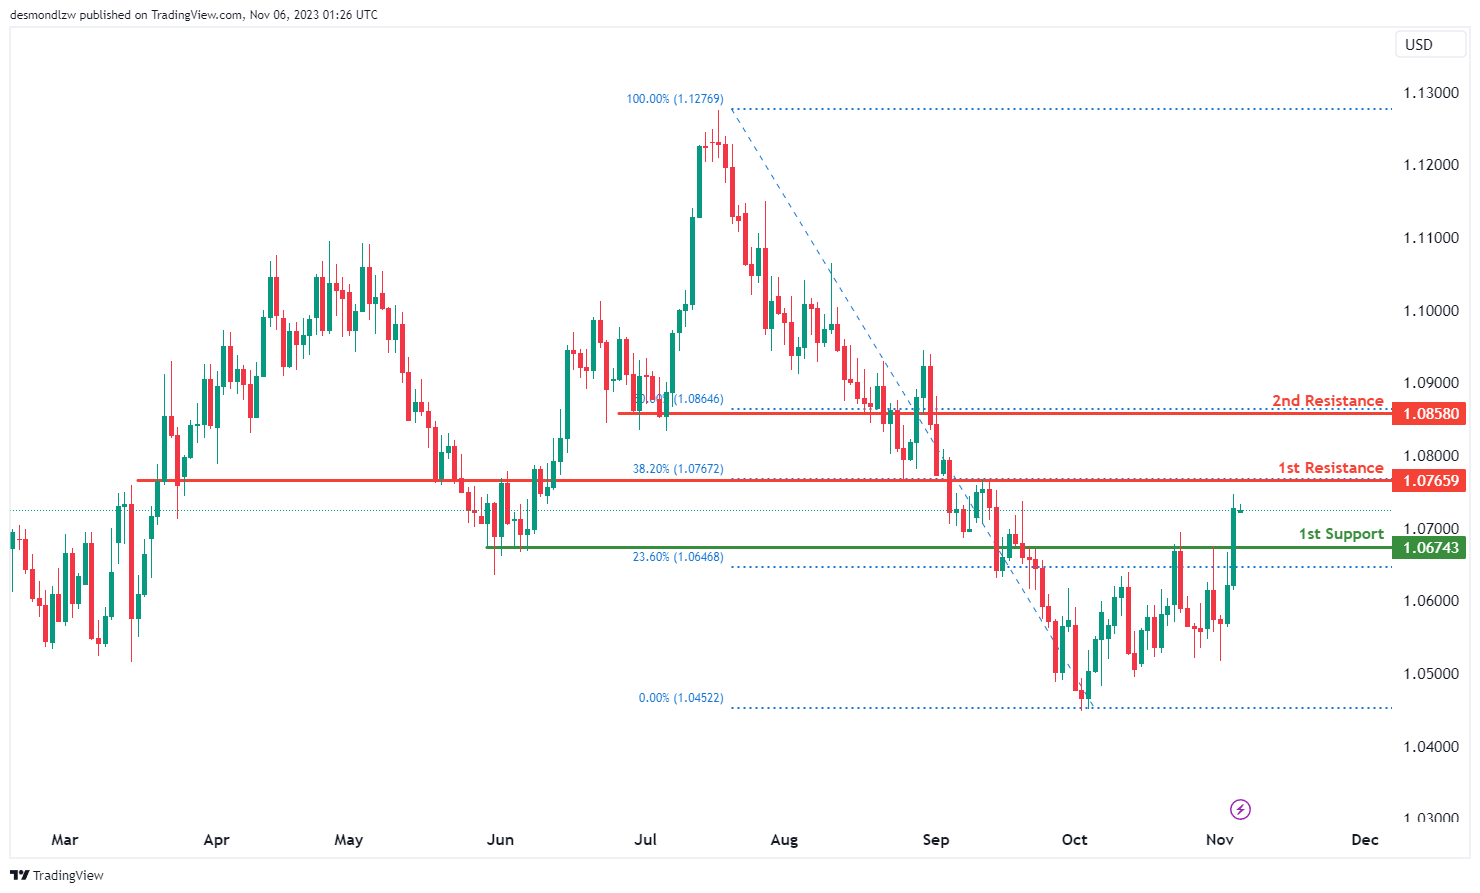
The EUR/USD chart currently has a bullish overall momentum, indicating the potential for a bullish continuation towards the 1st resistance.
The 1st support at 1.0674 is identified as a pullback support and is associated with the 23.60% Fibonacci Retracement level, suggesting it could be a significant level where the price might find buying interest.
On the resistance side, the 1st resistance at 1.0765 is categorized as an overlap resistance and is linked to the 38.20% Fibonacci Retracement level, indicating it could act as a level where the price may encounter selling pressure.
The 2nd resistance at 1.0858 is identified as a pullback resistance and is related to the 50% Fibonacci Retracement level, further reinforcing its potential as a level where the price might face obstacles in its upward movement.
EUR/JPY:
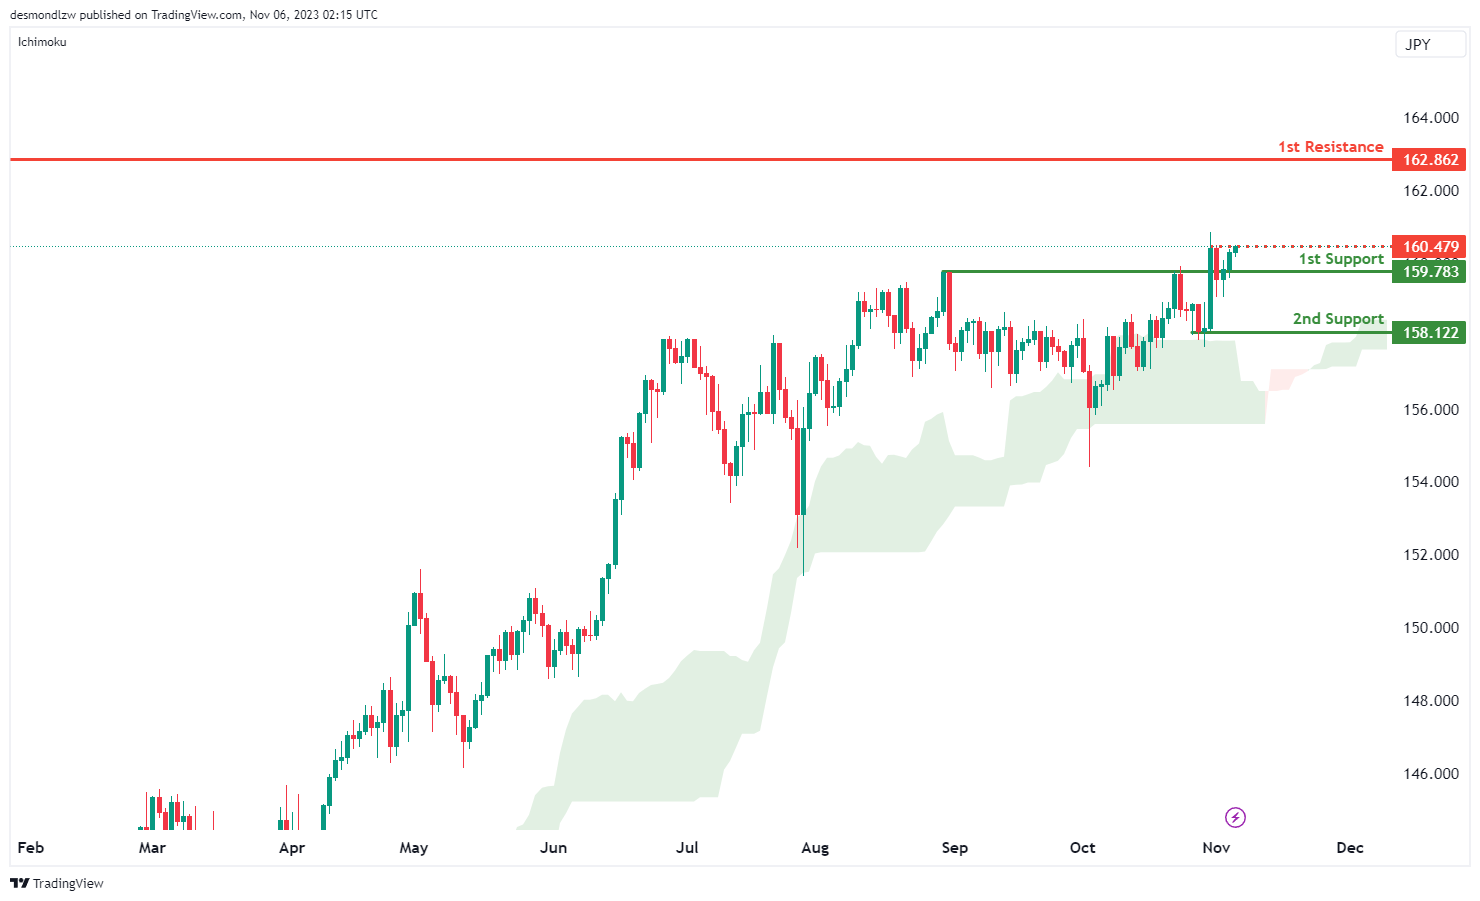
For EUR/JPY, the chart’s overall momentum is currently bullish, supported by the price trading above the bullish Ichimoku cloud. There’s a potential for a bullish continuation towards the first resistance.
The first support at 159.78 is identified as a pullback support, representing a level where the price might find support during any potential retracement in the bullish trend.
The second support at 158.12 is recognized as swing low support, indicating an additional level that might offer support during the bullish trend.
On the resistance side, the first resistance at 162.86 is characterized as swing high resistance, signifying a level that could potentially act as a significant barrier to the price’s upward movement within the current bullish scenario.
Additionally, an intermediate resistance at 160.47 is associated with swing high resistance, further supporting a potential level that could pose an obstacle to the price’s upward movement within the bullish trend.
EUR/GBP:
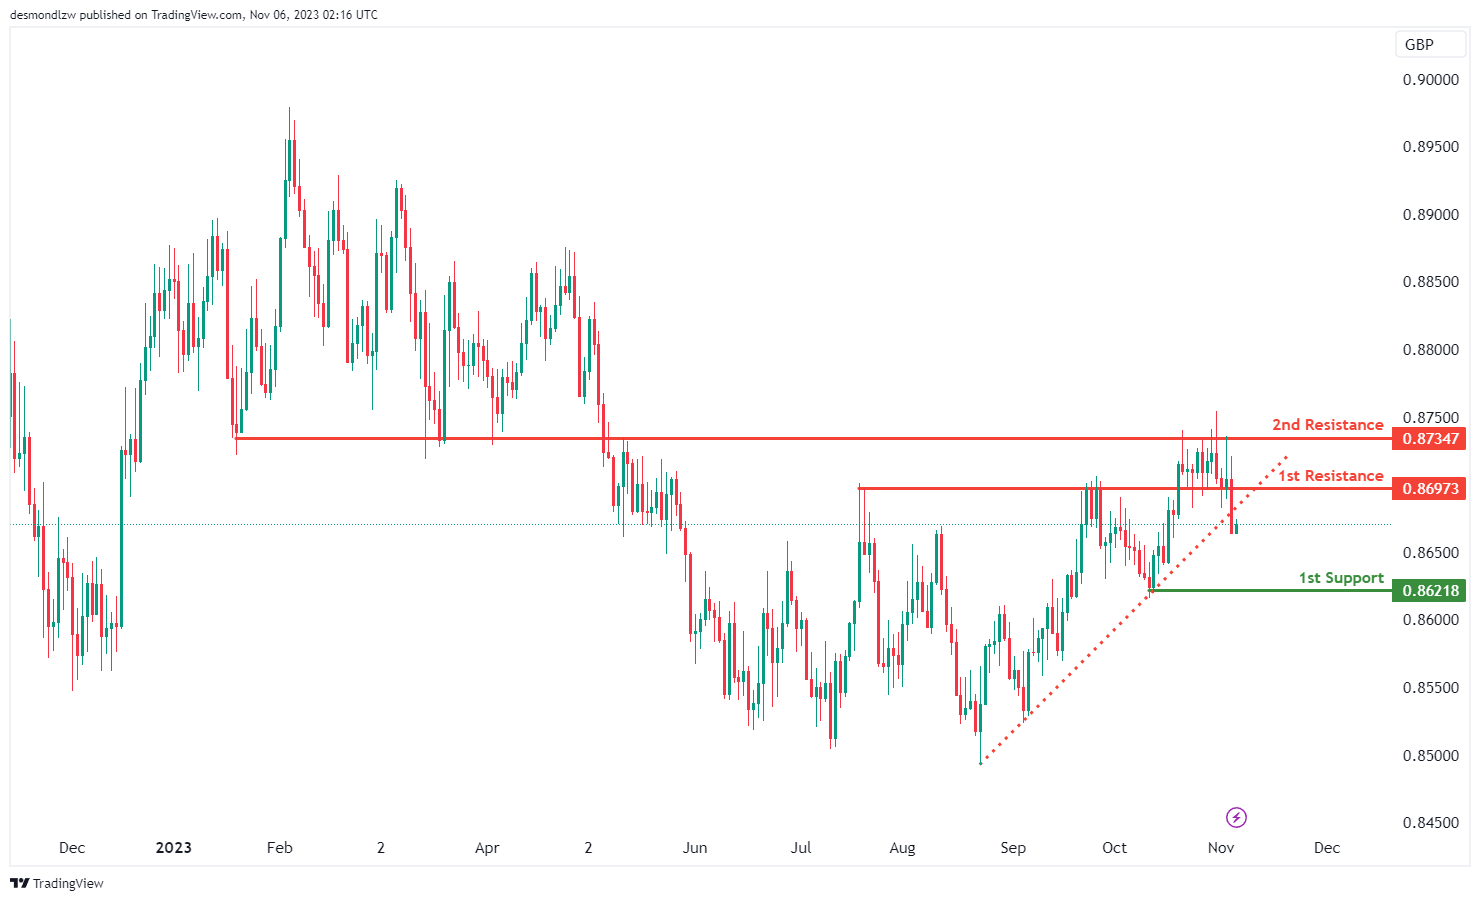
For EUR/GBP, the overall momentum of the chart is presently bearish, triggered by the price breaking below an ascending support line, suggesting a potential for a bearish move.
There’s a possibility that the price might rise towards the first resistance at 0.8697 in the short term before reversing and potentially dropping towards the first support.
The first support at 0.8621 is recognized as a level of swing low support, indicating a point where the price might find support during a potential downward movement.
On the resistance side, the first resistance at 0.8697 is identified as pullback resistance, suggesting a level that could potentially act as a barrier to the short-term upward movement within the overall bearish context.
Furthermore, the second resistance at 0.8734 is characterized as an overlap resistance, indicating it could serve as an additional substantial barrier to the price’s upward movement within the prevailing bearish trend.
.
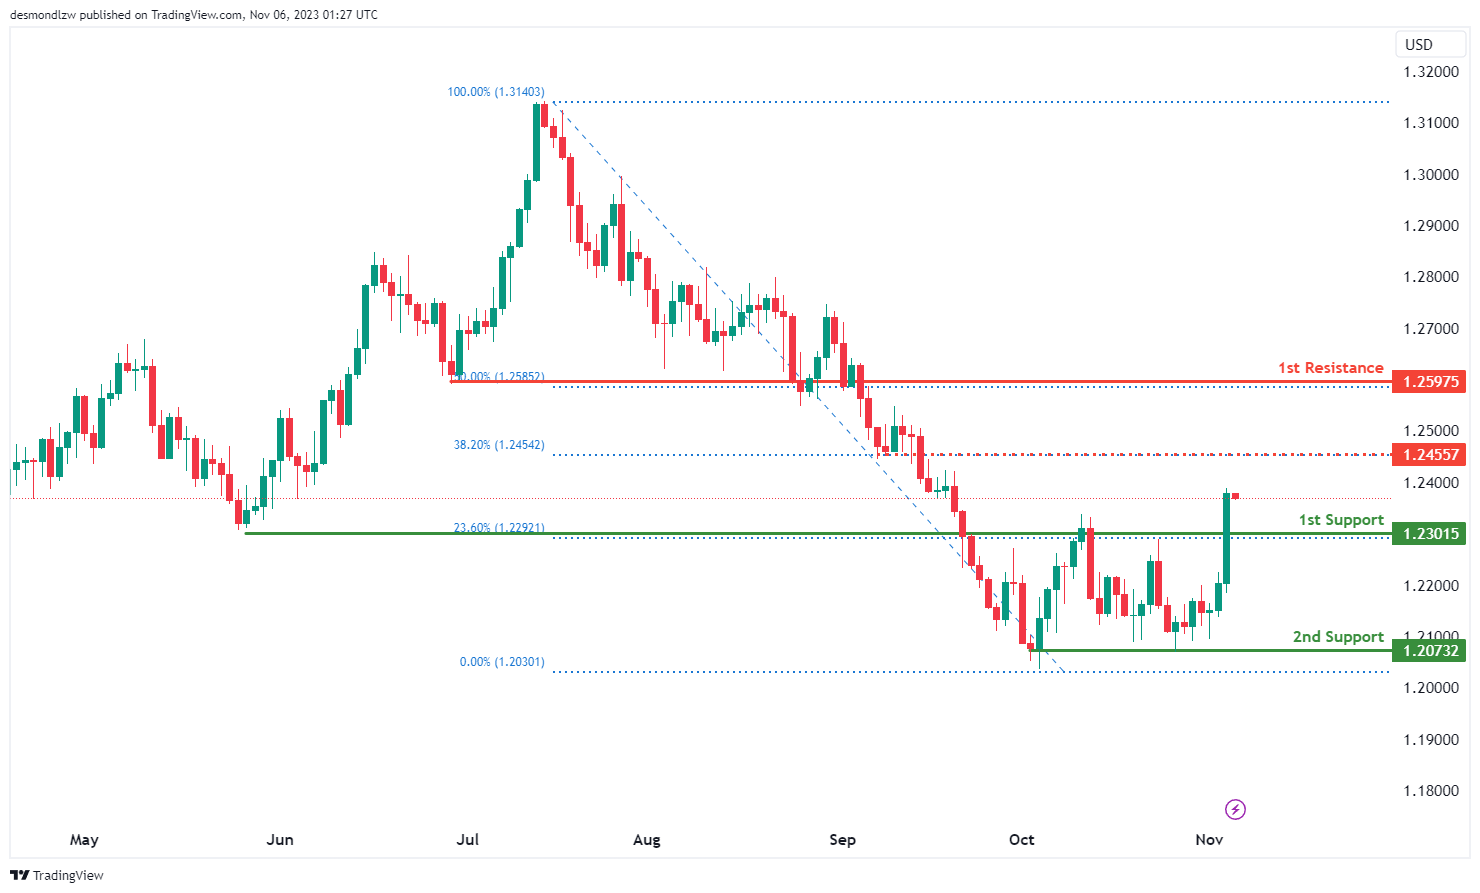
GBP/USD:
The GBP/USD chart currently has a bullish overall momentum, suggesting the potential for a bullish continuation towards the 1st resistance.
The 1st support at 1.2301 is identified as a pullback support and is associated with the 23.60% Fibonacci Retracement level, indicating it could be a significant level where the price might find buying interest.
The 2nd support at 1.2073 is considered a multi-swing low support, further reinforcing its potential as a support level.
On the resistance side, the 1st resistance at 1.2597 is categorized as a pullback resistance and is linked to the 50% Fibonacci Retracement level, suggesting it could act as a level where the price may encounter selling pressure.
Intermediate resistance at 1.2455 is also noted as a pullback resistance and is related to the 38.20% Fibonacci Retracement level, adding to the potential areas where the price might find resistance.
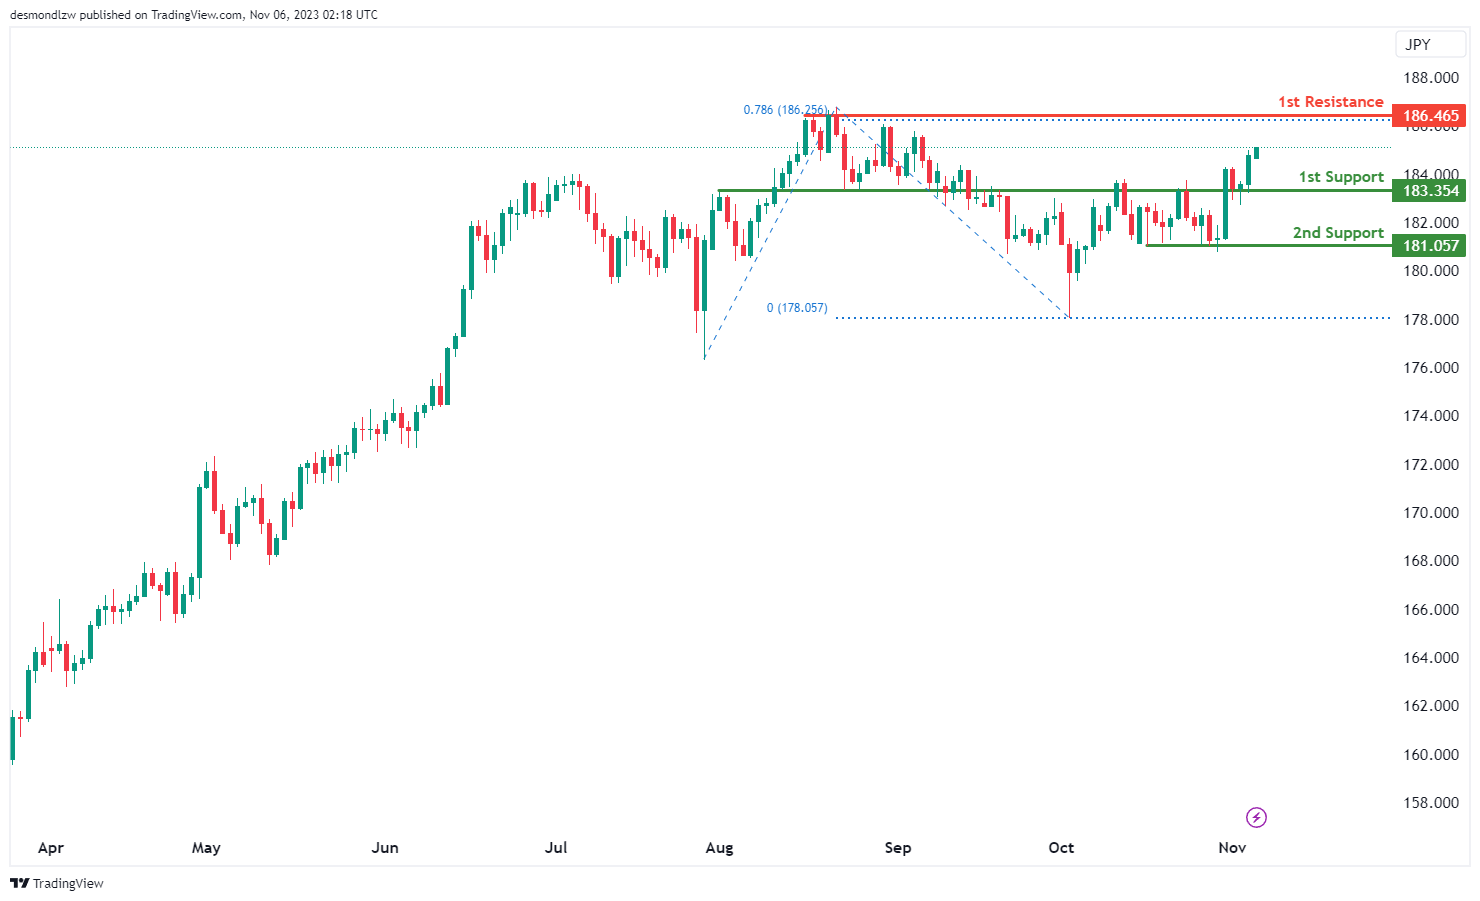
GBP/JPY:
For GBP/JPY, the chart currently reflects a bullish momentum, indicating a potential scenario for a bullish continuation towards the first resistance.
The first support at 183.35 is identified as a level of pullback support, suggesting it might act as a supportive level during any potential retracement in the bullish trend.
The second support at 181.05 is recognized as multi-swing low support, providing an additional level that might offer support during the bullish trend.
On the resistance side, the first resistance at 186.46 is characterized as multi-swing high resistance, coinciding with the 78.60% Fibonacci Projection. This suggests that it could act as a significant level, potentially hindering further bullish movement within the current upward trend.
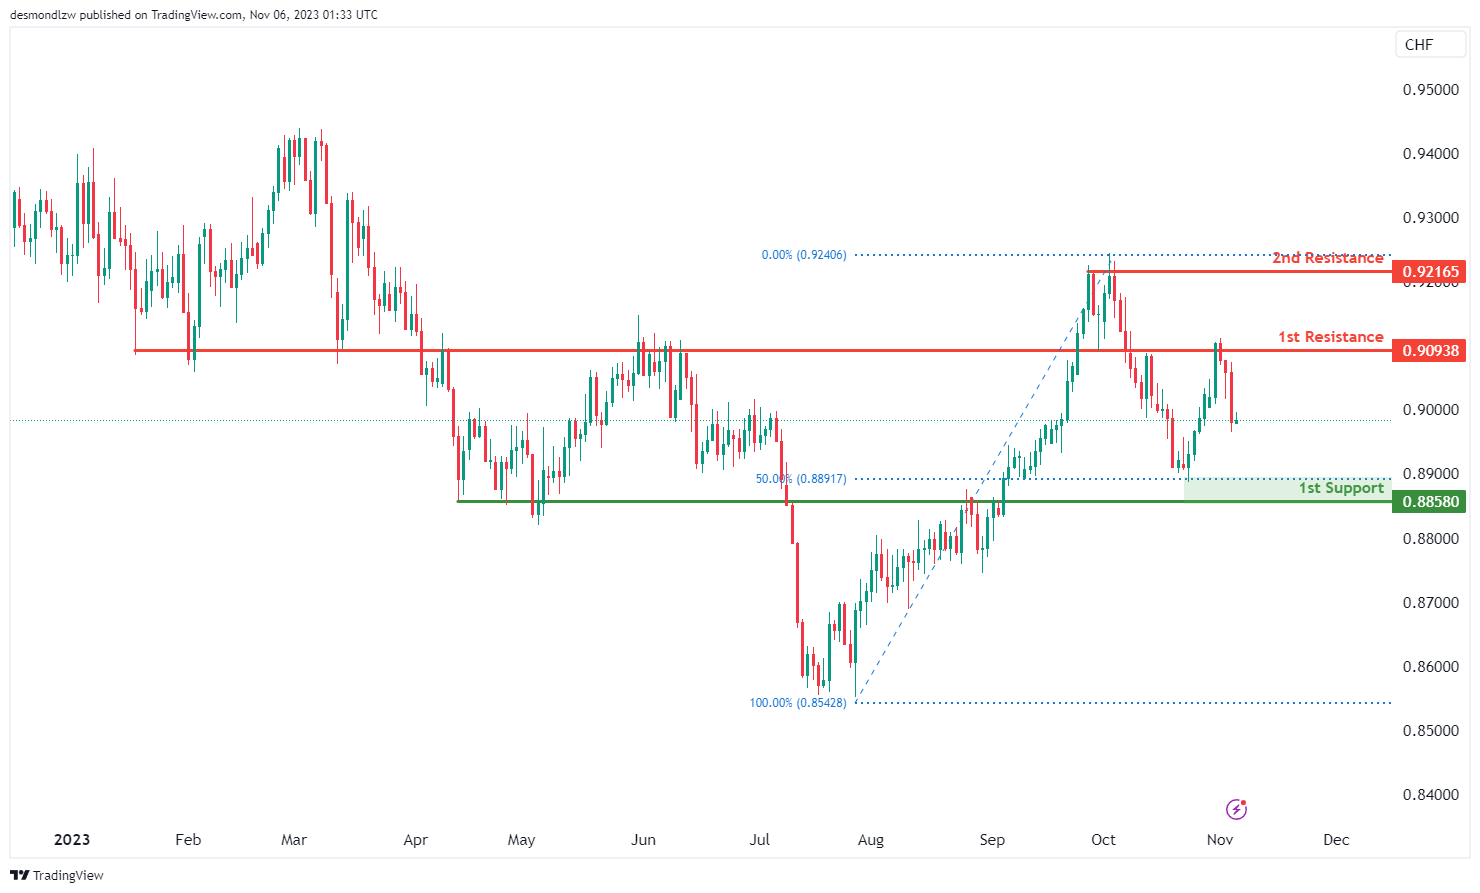
USD/CHF:
The USD/CHF chart currently has a bearish overall momentum, suggesting the potential for a bearish continuation towards the 1st support.
The 1st support at 0.8858 is identified as an overlap support and is associated with the 50% level, indicating it could be a significant level where the price might find some buying interest.
On the resistance side, the 1st resistance at 0.9093 is categorized as an overlap resistance, suggesting it could act as a level where the price may face selling pressure.
The 2nd resistance at 0.9216 is considered a multi-swing high resistance, indicating another potential level where the price may encounter obstacles in its upward movement.
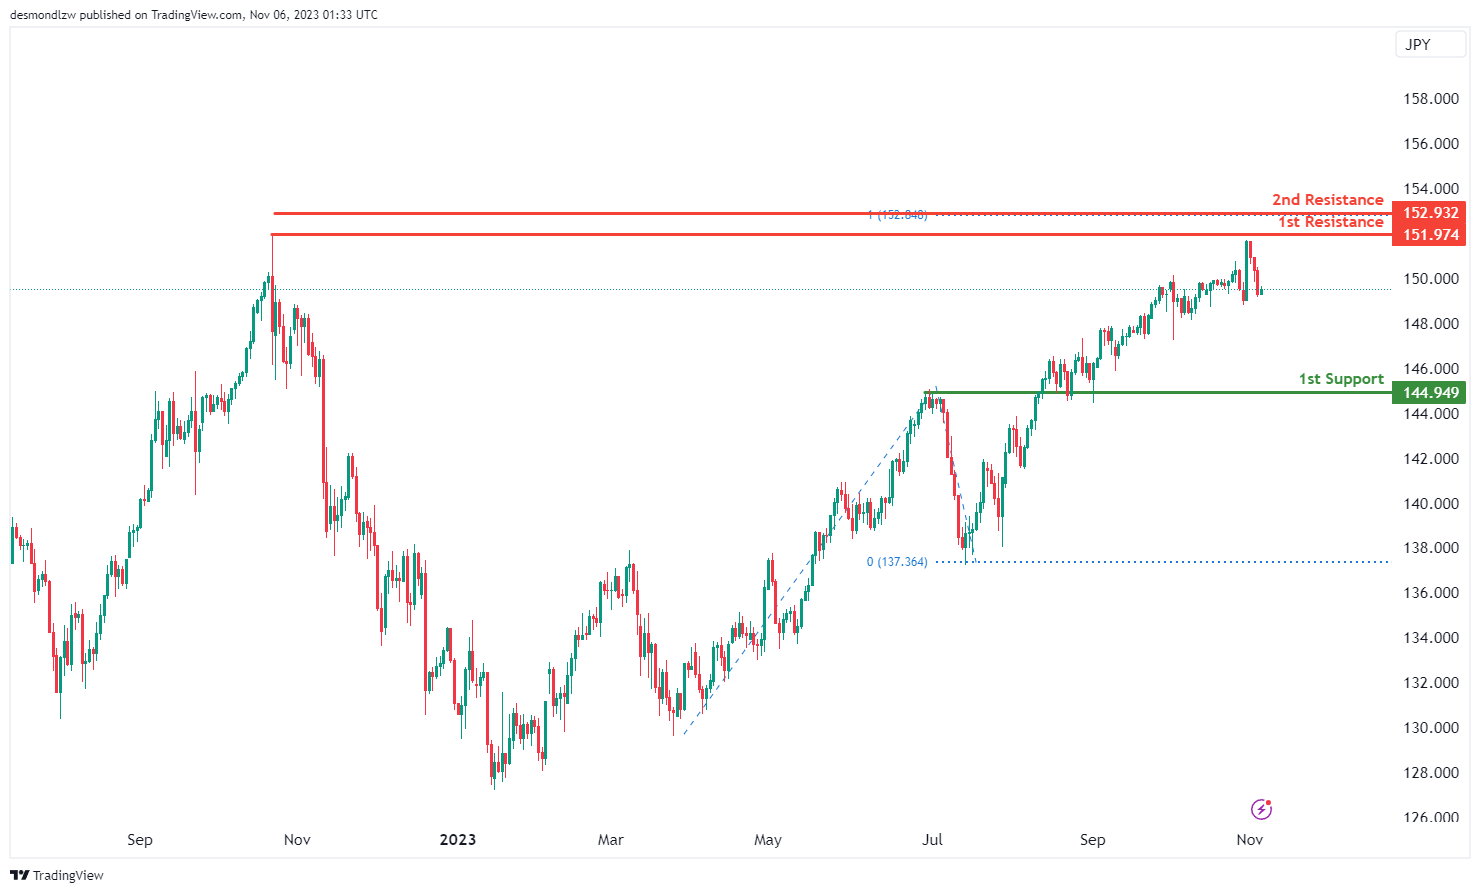
USD/JPY:
The USD/JPY chart currently has a bearish overall momentum, suggesting the potential for a bearish continuation towards the 1st support.
The 1st support at 144.94 is identified as an overlap support, indicating it could be a significant level where the price might find some buying interest.
On the resistance side, the 1st resistance at 151.97 is categorized as a swing high resistance, suggesting it could act as a level where the price may face selling pressure.
The 2nd resistance at 152.93 is associated with the 100% Fibonacci Projection, indicating another potential level where the price may encounter obstacles in its upward movement.
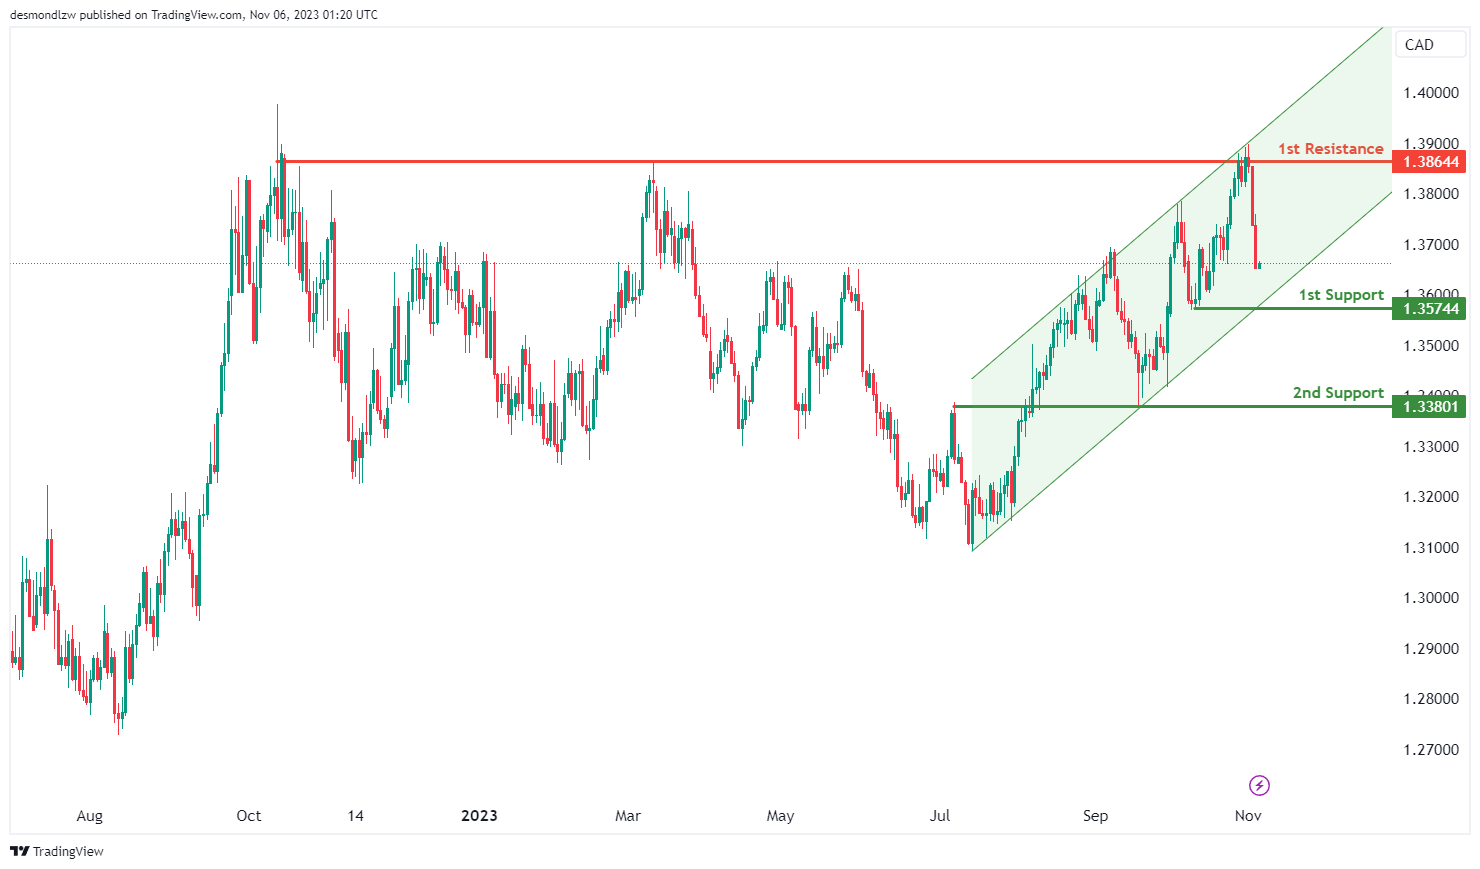
USD/CAD:
The USD/CAD chart currently demonstrates an overall bearish momentum. However, there is a potential scenario for price to make a bullish bounce off the 1st support. Price is also trading within a bullish channel, potentially acting as a support zone.
The 1st support level at 1.3574 is identified as a pullback support. Further below, the 2nd support level at 1.3380 is marked as an overlap support, indicating a potential area of price support.
To the upside, the 1st resistance level at 1.3864 is identified as a multi-swing-high resistance that aligns close to the upper trendline of the bullish channel, further reinforcing the potential for resistance in that region.
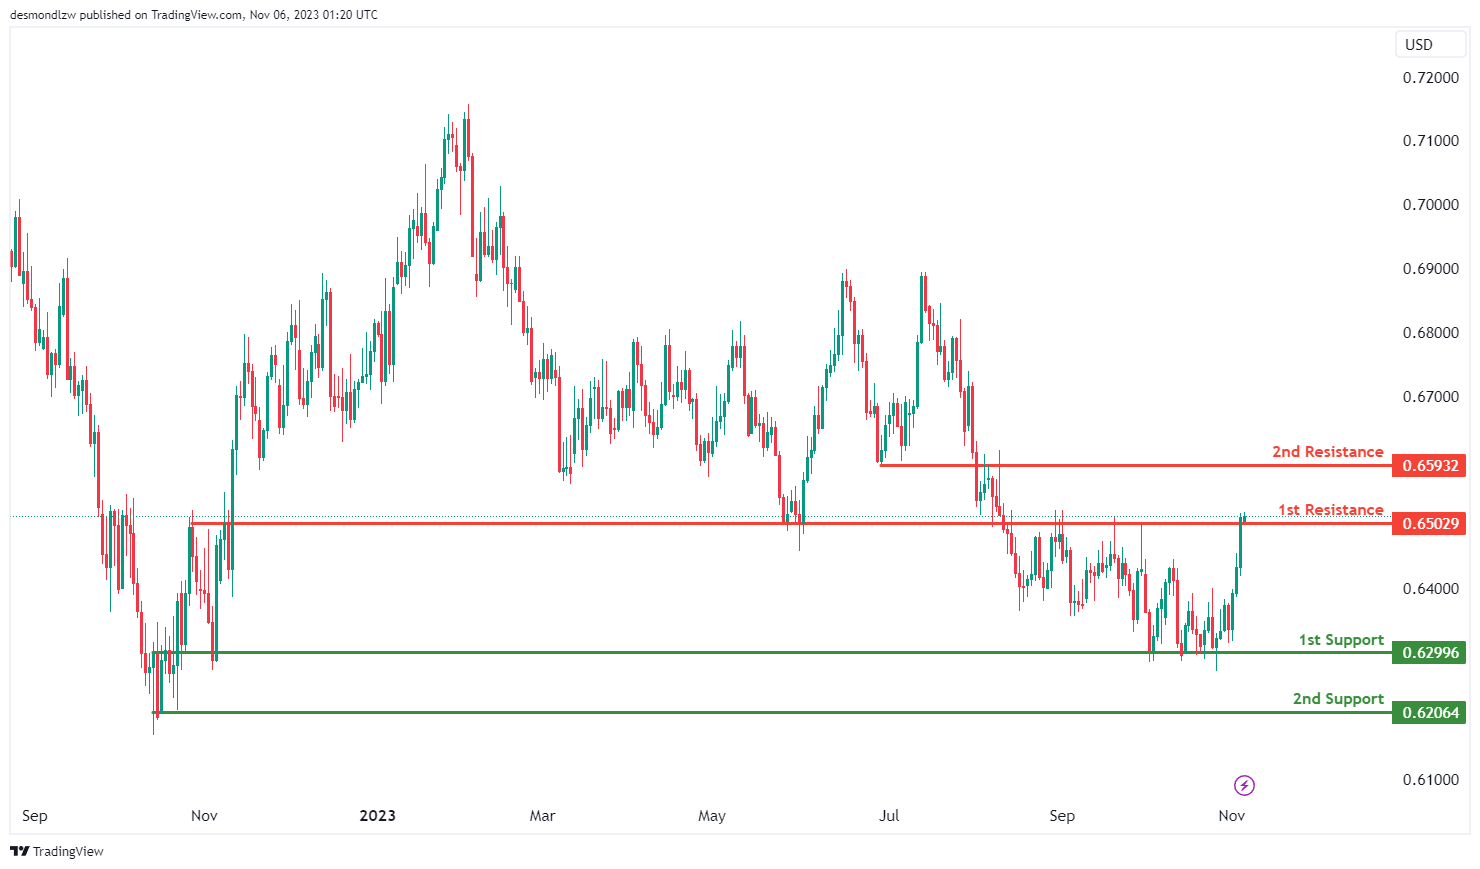
AUD/USD:
The AUD/USD chart currently exhibits an overall bullish momentum, suggesting a potential for a bullish breakout of the 1st resistance and move higher towards the 2nd resistance.
The 1st resistance level at 0.6503 is identified as an overlap resistance. Higher up, the 2nd resistance level at 0.6593 is also noted as an overlap resistance.
To the downside, the 1st support level at 0.6299 is identified as an overlap support. Further below, the 2nd support level at 0.6206 is marked as a swing-low support, indicating a potential for a strong price support.
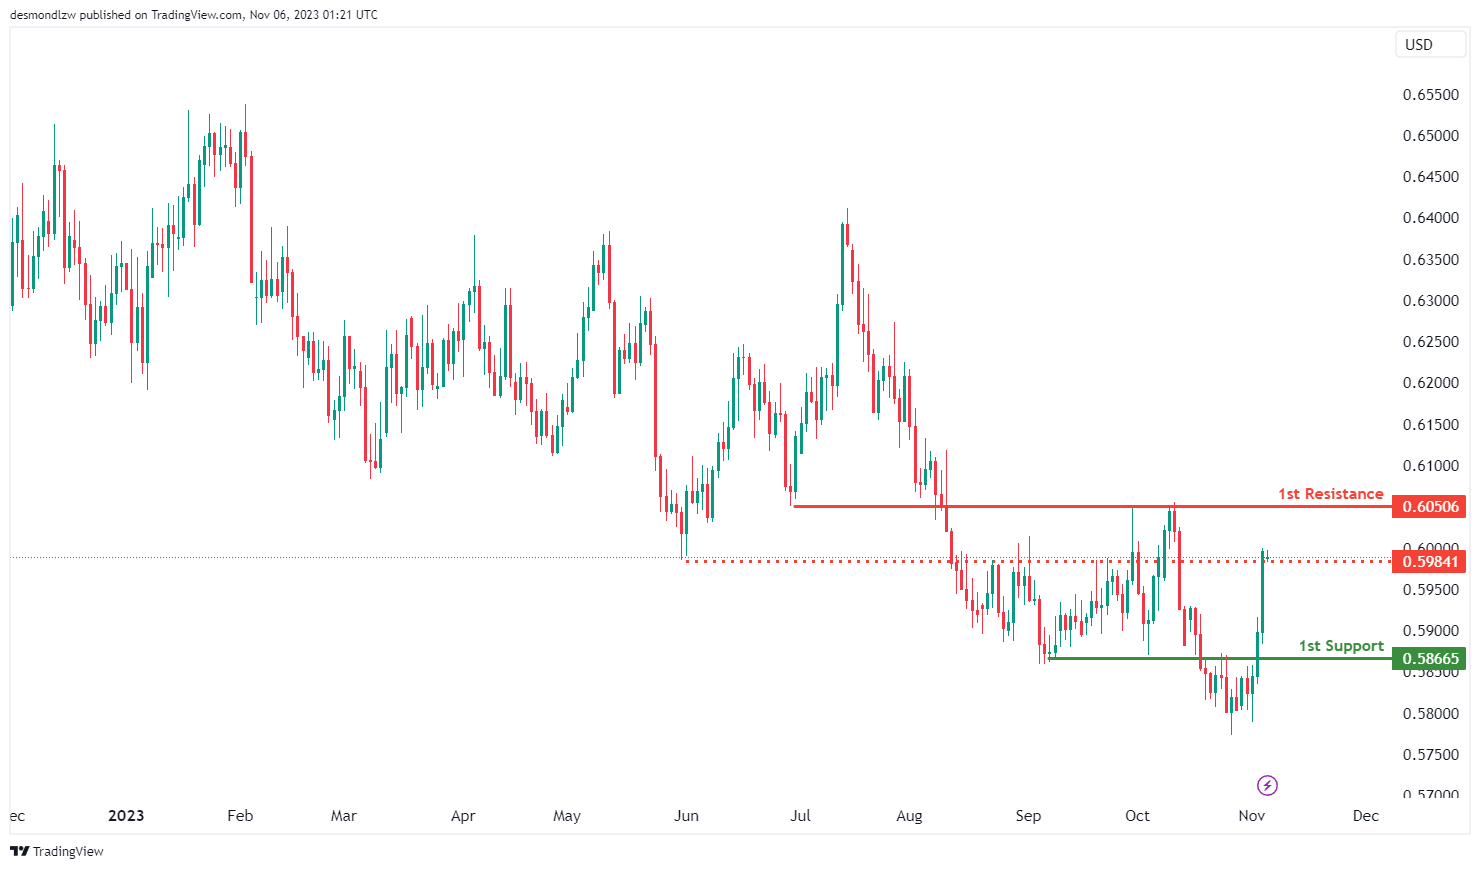
NZD/USD
The NZD/USD chart currently demonstrates an overall bullish momentum, suggesting a potential for a bullish continuation towards the 1st resistance.
The intermediate resistance level at 0.5984 is identified as an overlap resistance while the 1st resistance level at 0.6051 is also marked as an overlap resistance, acting as a potential barrier to upward price movements.
To the downside, the 1st support level at 0.5867 is identified as an overlap support, potentially acting as a strong support zone.
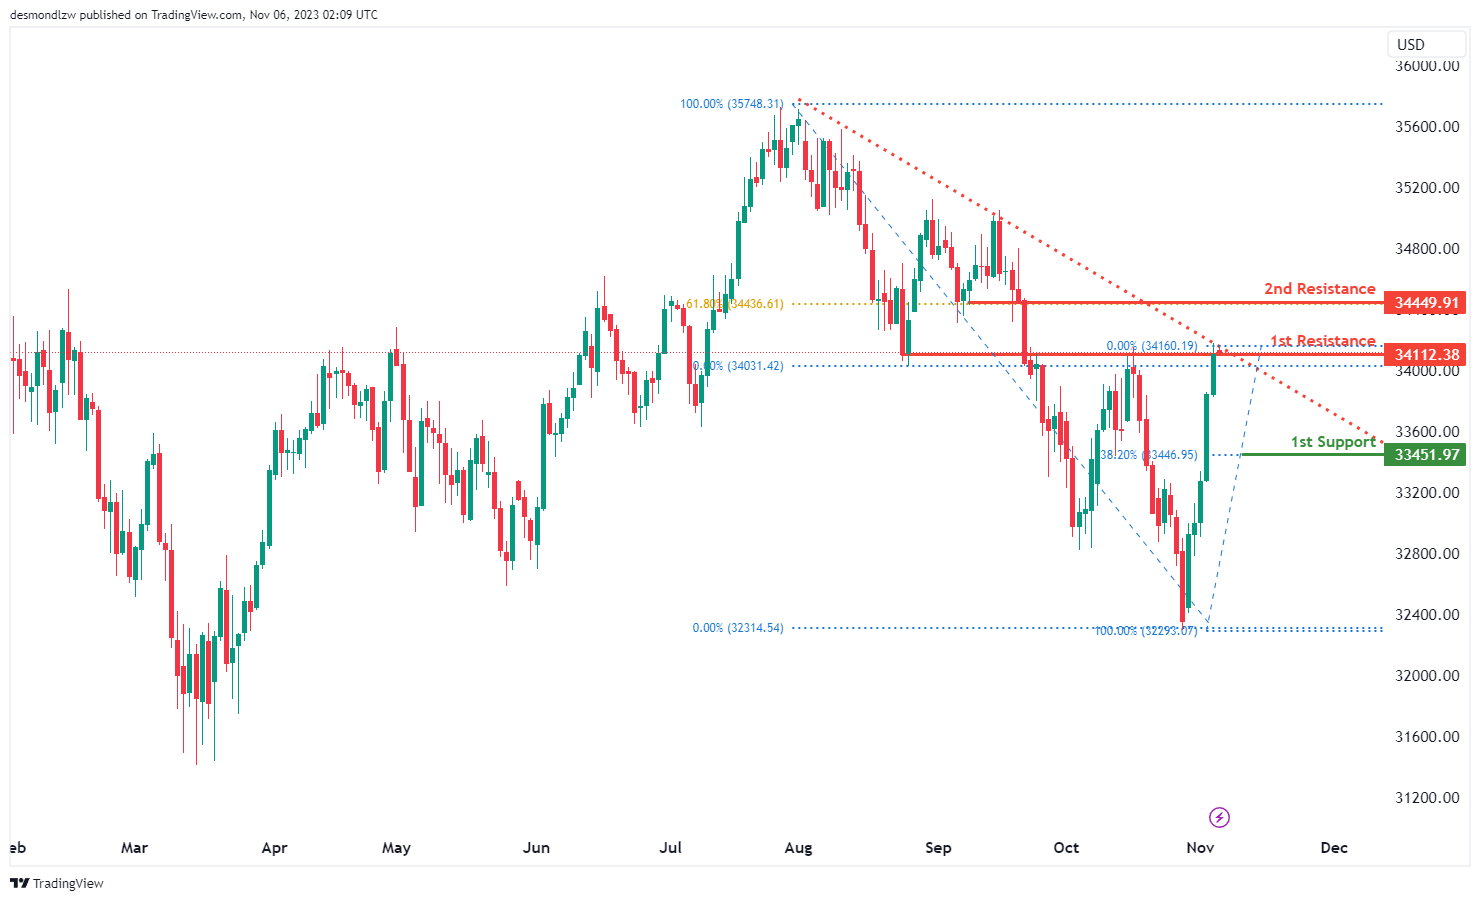
DJ30:
The DJ30 chart currently shows a bearish momentum, characterized by the price being below a major descending trend line, suggesting a potential continuation of bearish sentiment.
There is a likelihood for a bearish reaction off the first resistance at 34112.38, potentially leading to a drop to the first support.
The first support at 33451.97 is associated with the 38.20% Fibonacci Retracement, indicating a level where the price might find support during its potential decline in the bearish trend.
On the resistance side, the first resistance at 34112.38 is recognized as an overlap resistance, representing a significant barrier to the price’s upward movement in the current bearish scenario.
The second resistance at 34449.91 is identified as pullback resistance, suggesting it might pose another substantial obstacle for the price’s upward movement within the prevailing bearish trend.
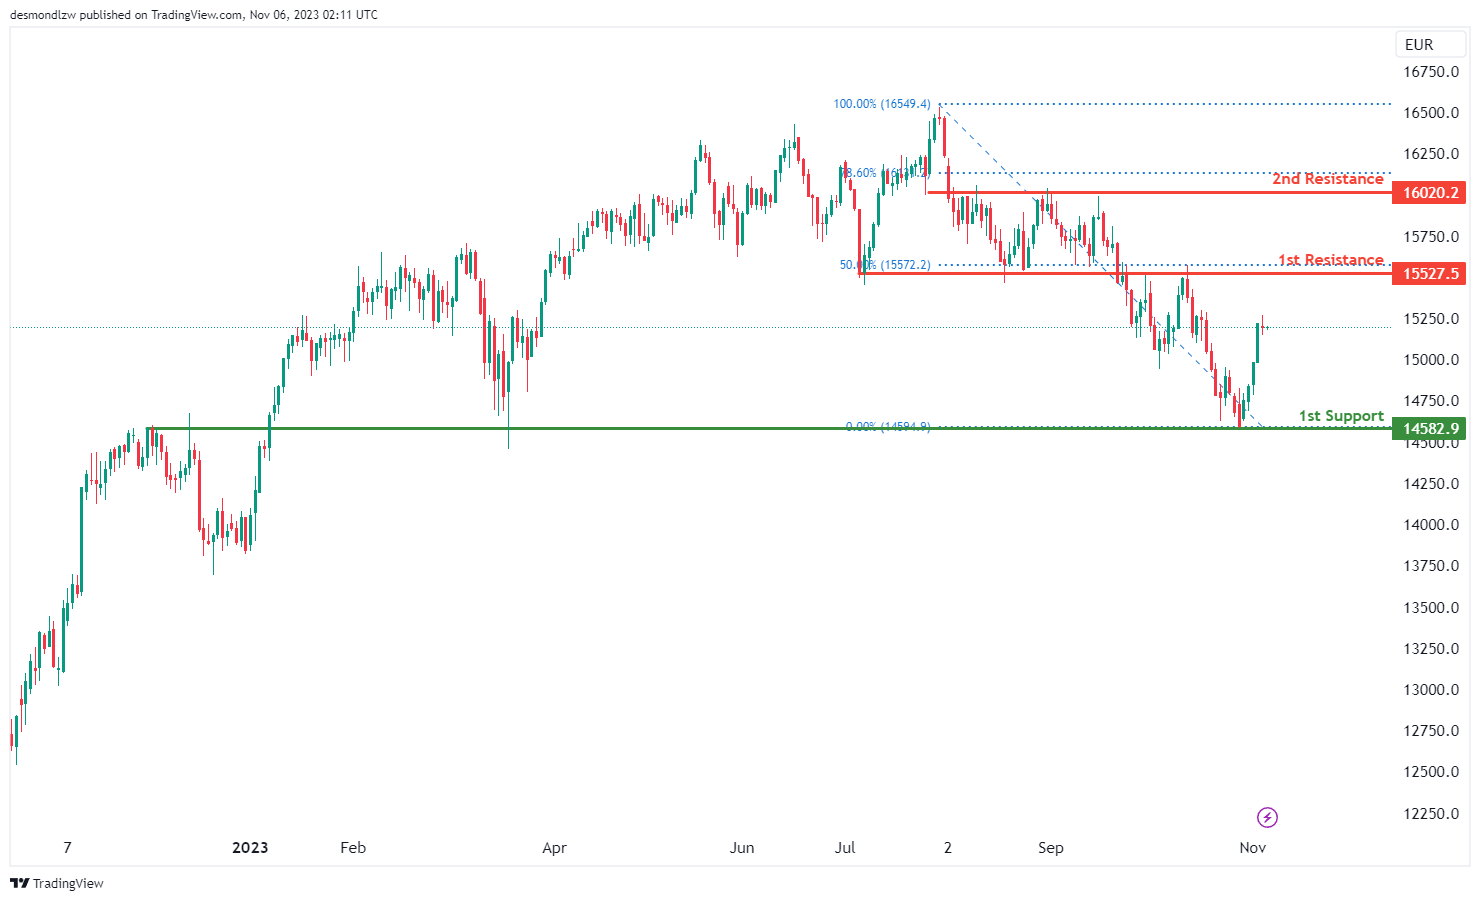
GER40:
For GER40, the chart currently demonstrates a bullish momentum, suggesting a potential scenario for a bullish continuation towards the first resistance.
The first support at 14582.90 is recognized as an overlap support, indicating a level where the price might find support during any potential retracement or decline in the bullish trend.
On the resistance side, the first resistance at 15527.50 is characterized as an overlap resistance and coincides with the 50% Fibonacci Retracement level, suggesting it as a significant barrier to the price’s upward movement in the current bullish scenario.
Moreover, the second resistance at 16020.20 aligns with another overlap resistance and the 78.60% Fibonacci Retracement, further solidifying it as a potentially stronger level that could impede the price’s upward movement within the bullish trend.
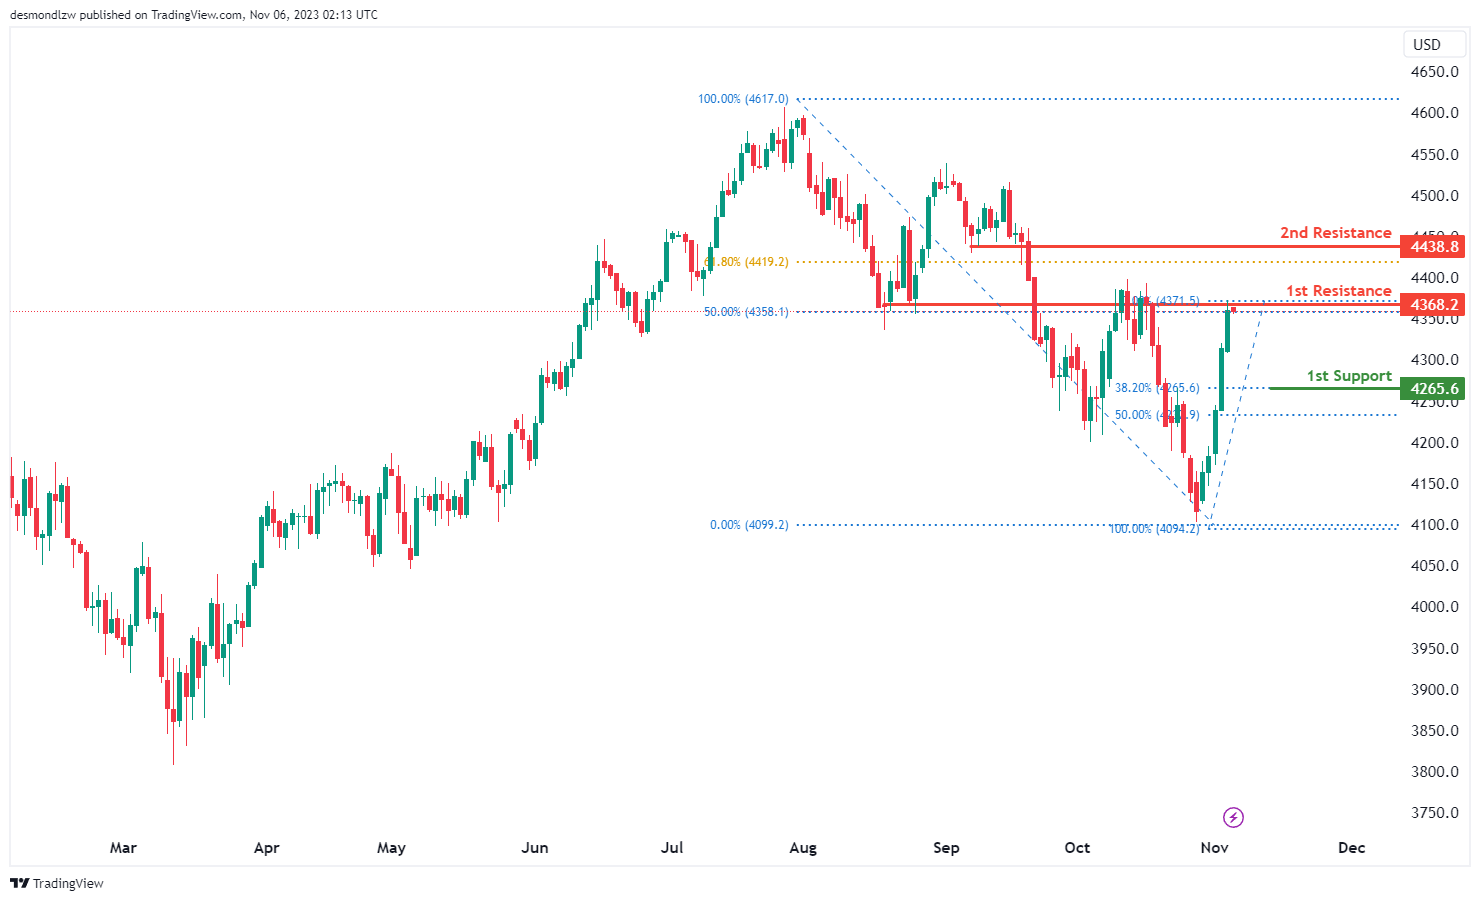
`US500
For US500, the chart currently indicates a bearish momentum, suggesting a potential scenario for a bearish reaction off the first resistance at 4368.2, possibly leading to a drop to the first support.
The first support at 4265.6 is related to the 38.20% Fibonacci Retracement, suggesting a level where the price might find support during its potential decline in the bearish trend.
On the resistance side, the first resistance at 4368.2 is identified as an overlap resistance and coincides with the 50% Fibonacci Retracement, indicating a significant barrier to the price’s upward movement in the current bearish scenario.
Furthermore, the second resistance at 4438.8 aligns with pullback resistance and the 61.80% Fibonacci Retracement, suggesting it as another potentially strong level that could act as a significant barrier to the price’s upward movement within the bearish trend.
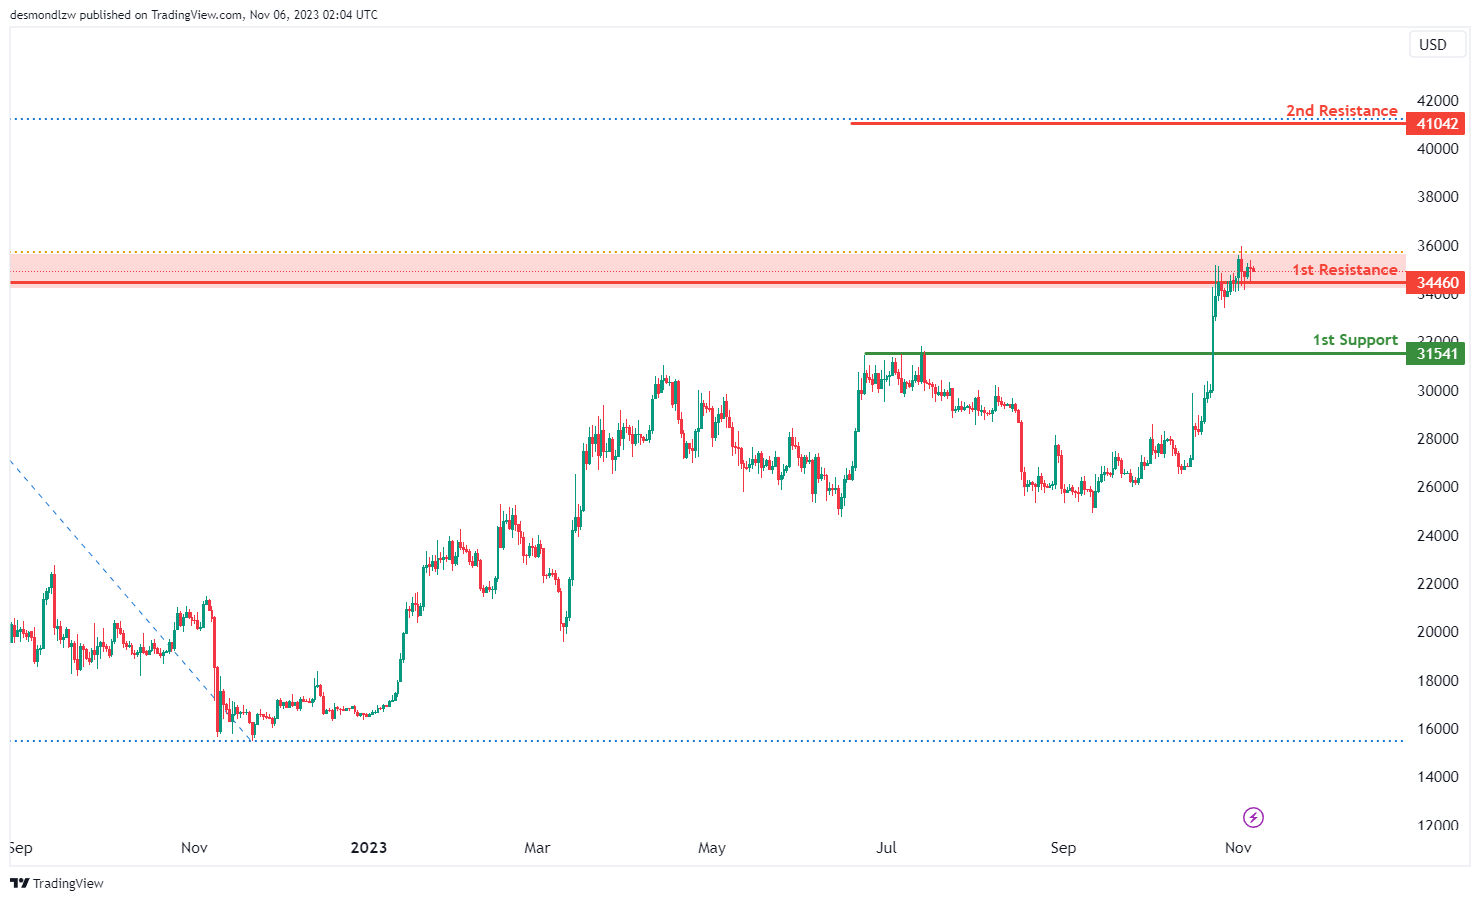
BTC/USD:
The BTC/USD chart currently suggests a bullish momentum, indicating a potential scenario for a bullish break through the first resistance at 34460, potentially rising towards the second resistance.
The first support at 31541 is considered a pullback support, signifying a level where the price might find support during its upward movement or retracement.
On the resistance side, the first resistance at 34460 is recognized as pullback resistance and aligns with the 61.80% Fibonacci Retracement level. This level indicates a significant hurdle that the price may need to break through for its further upward movement.
Additionally, the second resistance at 41042 is associated with the 78.60% Fibonacci Retracement, indicating a potentially stronger level that could act as a substantial barrier to the price’s upward movement within the bullish trend.
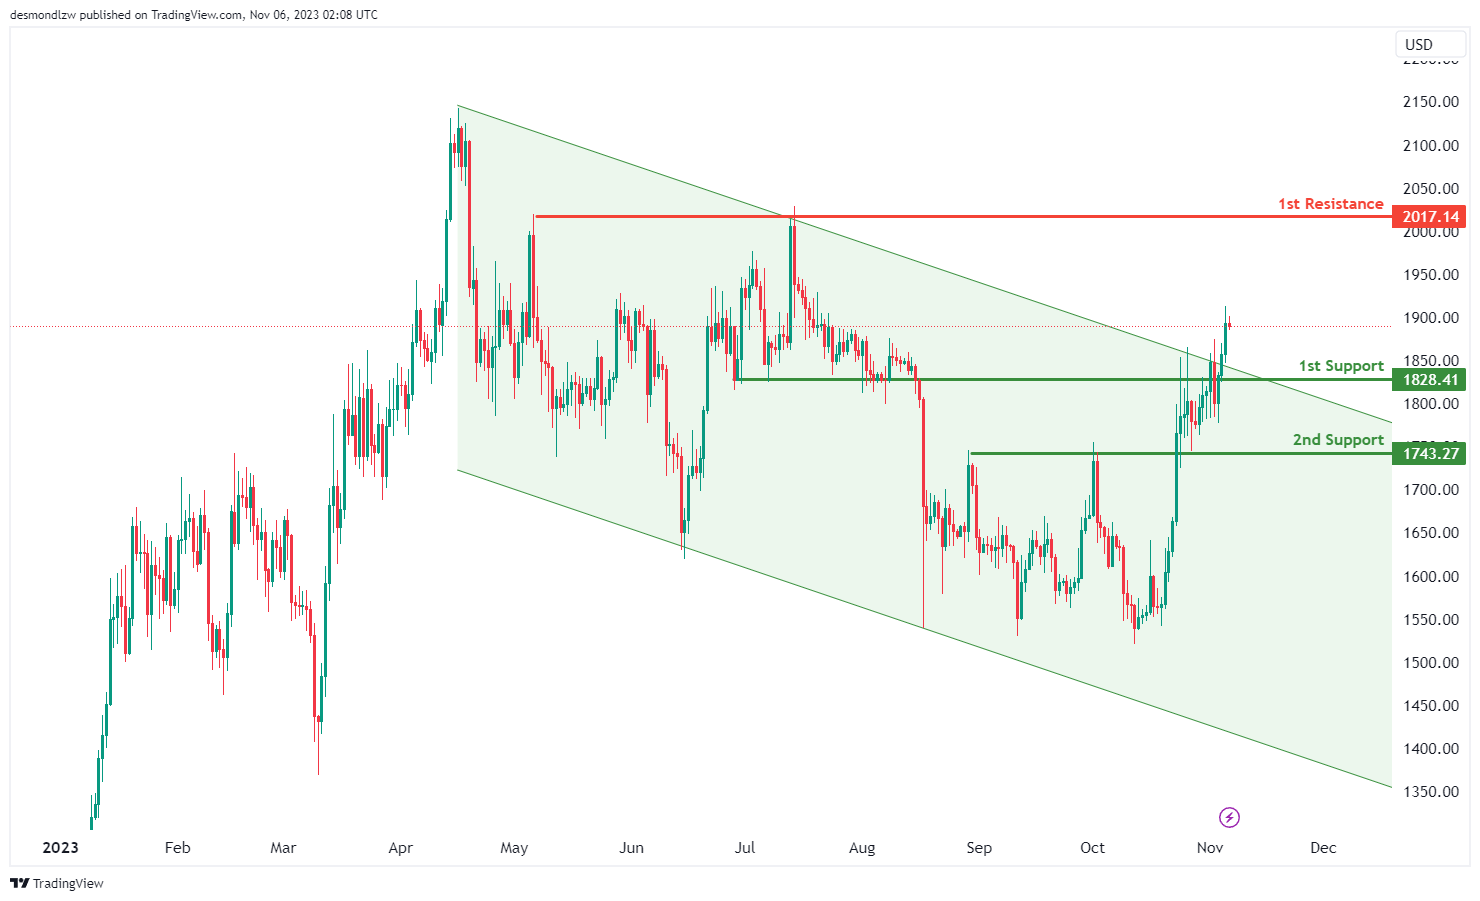
ETH/USD:
The ETH/USD chart currently exhibits a bullish momentum, driven by the breakthrough above a descending resistance line, which has triggered the potential for a bullish move.
There’s a potential for a bullish continuation towards the first resistance at 2017.14.
The first support at 1828.41 is identified as a pullback support, indicating a level where the price might find support during any potential retracement or decline in its upward movement.
The second support at 1743.27 is recognized as an overlap support, providing an additional level that might offer support during the bullish trend.
On the resistance side, the first resistance at 2017.14 is characterized as multi-swing high resistance, signifying a level that could potentially act as a significant barrier to the price’s upward movement within the current bullish scenario.
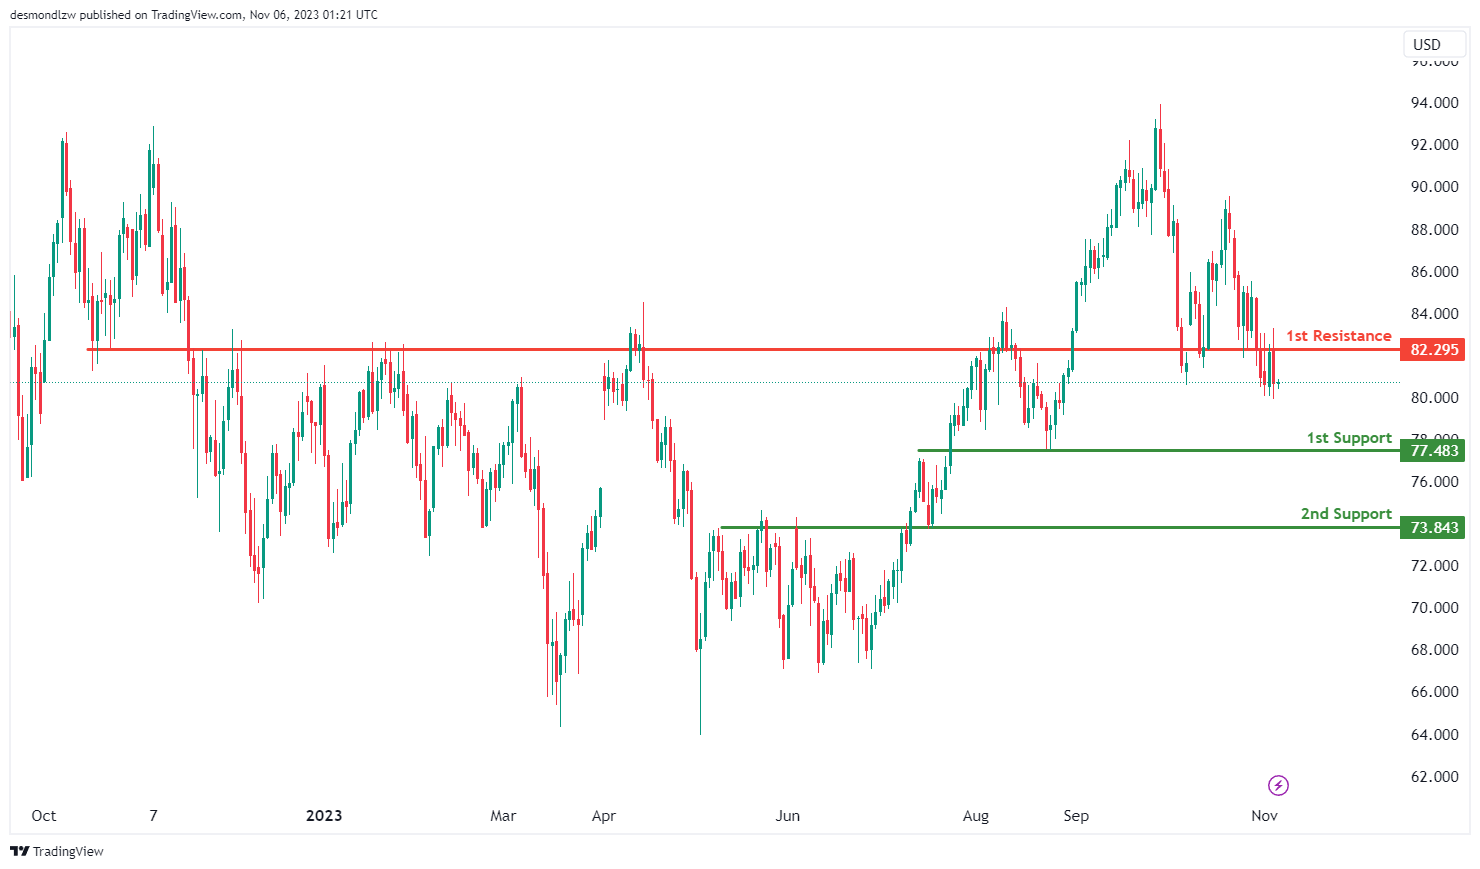
WTI/USD:
The WTI chart currently exhibits an overall bearish momentum. However, there is a potential for price to make a bullish continuation towards the 1st resistance before resuming the downturn.
The 1st resistance level at 82.29 is noted as an overlap resistance.
To the downside, the 1st support level at 77.48 is identified as an overlap support. Additionally, the 2nd support level at 73.84 is also marked as an overlap support, reinforcing a potential support zone.
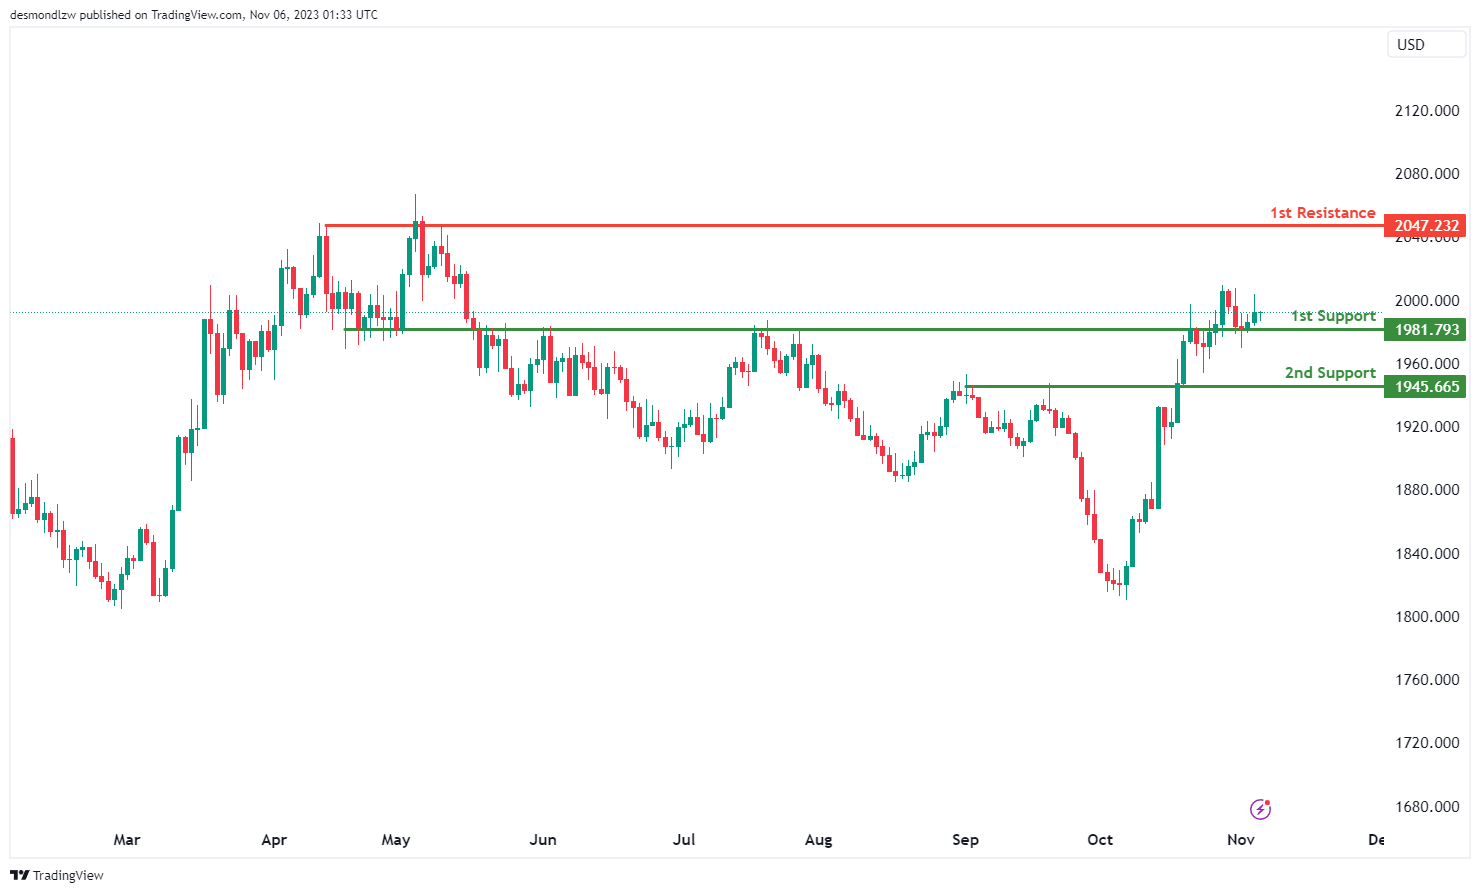
XAU/USD (GOLD):
The XAU/USD chart currently has a bullish overall momentum, suggesting the potential for a bullish continuation towards the 1st resistance.
The 1st support at 1981.79 is identified as an overlap support, indicating it could be a significant level where the price might find some buying interest.
The 2nd support at 1945.66 is considered a pullback support, further reinforcing its potential as a support level.
On the resistance side, the 1st resistance at 2047.23 is categorized as a multi-swing high resistance, suggesting it could act as a level where the price may face selling pressure.
The accuracy, completeness and timeliness of the information contained on this site cannot be guaranteed. IC Markets does not warranty, guarantee or make any representations, or assume any liability regarding financial results based on the use of the information in the site.
News, views, opinions, recommendations and other information obtained from sources outside of www.icmarkets.com, used in this site are believed to be reliable, but we cannot guarantee their accuracy or completeness. All such information is subject to change at any time without notice. IC Markets assumes no responsibility for the content of any linked site.
The fact that such links may exist does not indicate approval or endorsement of any material contained on any linked site. IC Markets is not liable for any harm caused by the transmission, through accessing the services or information on this site, of a computer virus, or other computer code or programming device that might be used to access, delete, damage, disable, disrupt or otherwise impede in any manner, the operation of the site or of any user’s software, hardware, data or property.


