
Key risk events today:
Eurogroup Meetings; US ISM Non-Manufacturing PMI.
(Previous analysis as well as outside sources – italics).
EUR/USD:
Weekly gain/loss: +0.74%
Weekly close: 1.1713
Weekly perspective:
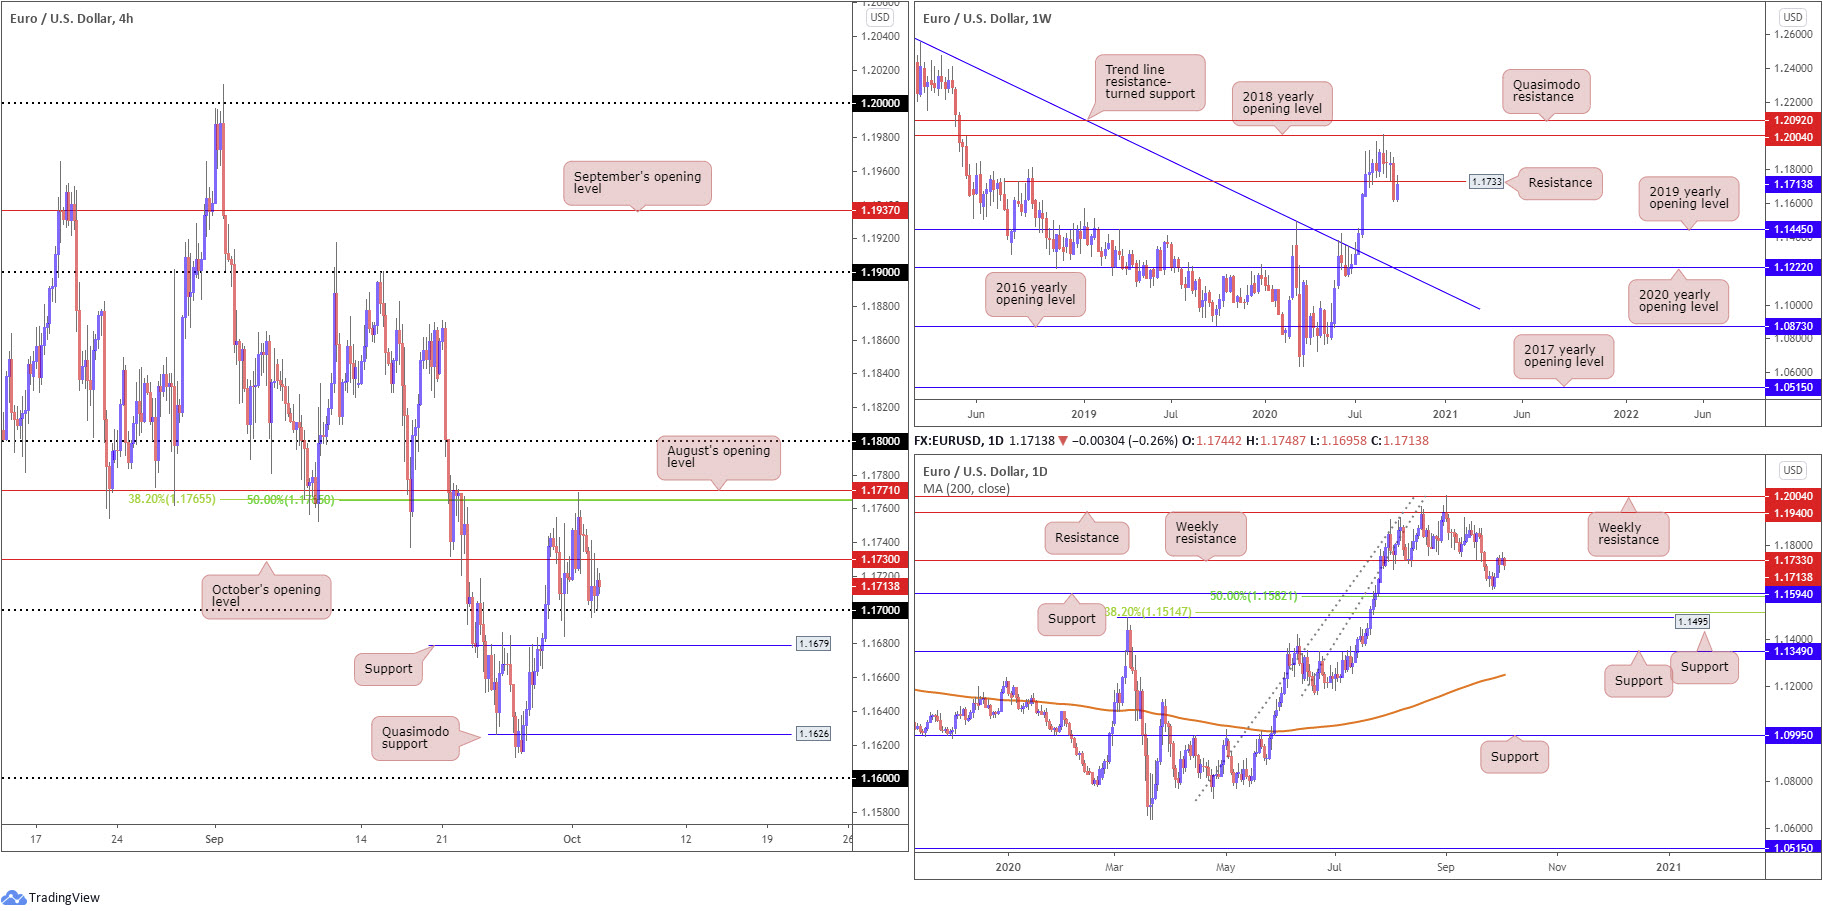
Led by the DXY tailing off from daily resistance around 94.65, Europe’s shared currency mounted a modest recovery last week, movement that took a bite out of the recent 3.4% retracement from 1.2004, a 2018 yearly opening value.
The week, as you can see, settled shaking hands with resistance at 1.1733. Should sellers establish a presence here this week, grappling with the 2019 yearly opening value at 1.1445 could be on the cards.
Daily perspective:
Leaving support at 1.1594 unchallenged, as well as the 50.0% retracement ratio complementing the level at 1.1582, weekly resistance mentioned above at 1.1733 entered the frame early last week.
Candle movement around the weekly level presented an indecisive stance. Technically, this could be due to dip-buyers seeking higher levels within the current trend on the daily timeframe and sellers battling for control off weekly resistance.
In the event weekly resistance cedes ground this week, this gives rise for a rally towards daily resistance at 1.1940.
H4 perspective:
Total US non-farm payroll employment rose by 661k in September (vs. an expected 900k print), and the unemployment rate declined to 7.9%, the US Bureau of Labour Statistics reported Friday.
In terms of market reaction, it was somewhat muted, mildly tailing off the underside of October’s opening value at 1.1730 to test the 1.17 handle. Beyond the aforementioned levels, August’s opening value at 1.1771 (as well as a 38.2% Fibonacci retracement ratio and a 50.0% retracement ratio at 1.1765) offers notable resistance, whereas support can be found at 1.1679, followed by a Quasimodo formation at 1.1626.
Areas of consideration:
- October’s opening value at 1.1730 sharing a connection with weekly resistance at 1.1733 could tempt intraday sellers to pass things through 1.17 early week to test H4 support at 1.1679 and potentially, H4 Quasimodo support at 1.1626.
- On the other hand, a fakeout through 1.17, a move that taps H4 support at 1.1679 and forces H4 to close back above 1.17, may stir intraday buying, in line with the current trend on the daily timeframe.
GBP/USD:
Weekly gain/loss: +1.48%
Weekly close: 1.2928
Weekly perspective:
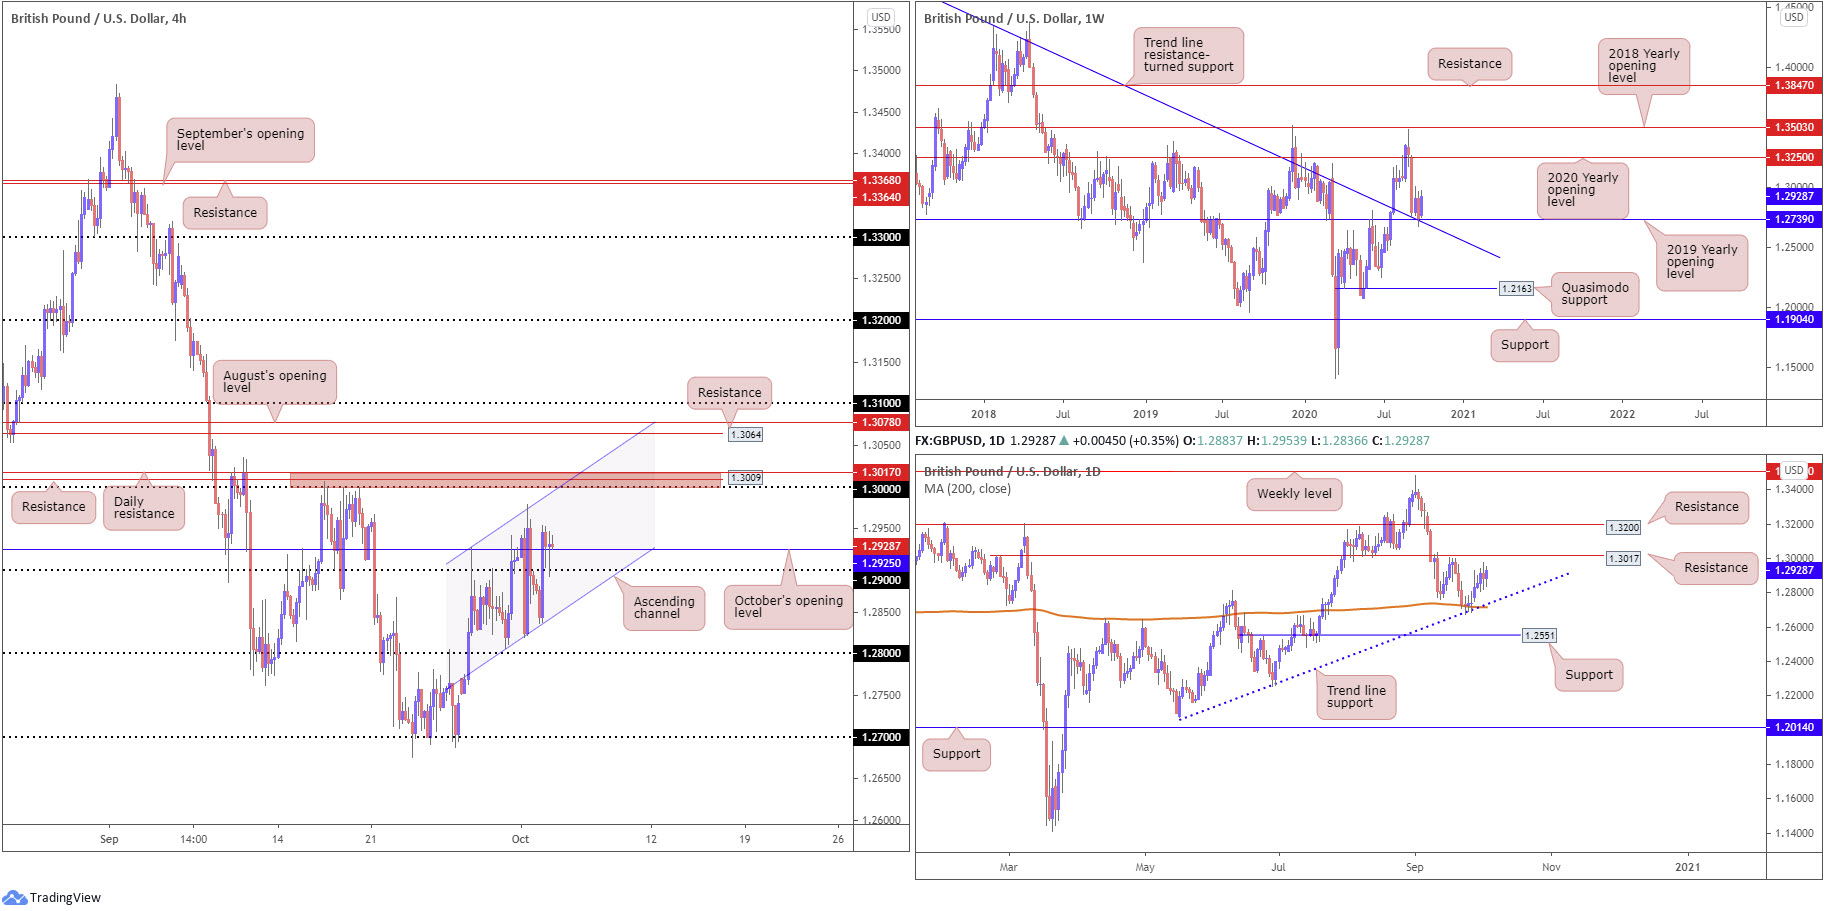
GBP/USD finished the week higher by nearly 200 points after recently crossing swords with support at 1.2739, a 2019 yearly opening value. Technicians will acknowledge the level also blends with trend line resistance-turned support, extended from the high 1.5930.
In terms of resistance, price has room to advance as far north as the 2020 yearly opening value at 1.3250 this week. Crossing 1.2739, on the other hand, registers a bearish setting, with the 1.2251 June 29 low targeted, closely shadowed by Quasimodo support priced in at 1.2163.
Daily perspective:
On top of weekly support, the prior week had daily price welcome the 200-day SMA (orange – 1.2715) and joining trend line support, extended from the low 1.2075.
Resistance at 1.3017 is seen within striking distance as we head into the new week, with a break exposing another layer of resistance at 1.3200.
H4 perspective:
The 1.29 handle on the H4 timeframe ended the week battered and bruised, encountering a number of whipsaws. Technicians will also observe an ascending channel in play between 1.2806/1.2927.
Friday, as you can see, retested the round number as support and held a few pips north of October’s opening value at 1.2925 into the close. Resistance can be seen around the key figure 1.30, closely shadowed by H4 resistance at 1.3009 and daily resistance at 1.3017 (red).
Areas of consideration:
Buyers, technically speaking, enter the first full week of October with the upper hand, exhibiting room for an intraday push higher on all three timeframes to at least the 1.30 neighbourhood.
With the above in mind, seeking bullish scenarios above October’s opening value at 1.2925 on the H4 in early trading could be an option.
AUD/USD:
Weekly gain/loss: +1.95%
Weekly close: 0.7160
Weekly perspective:
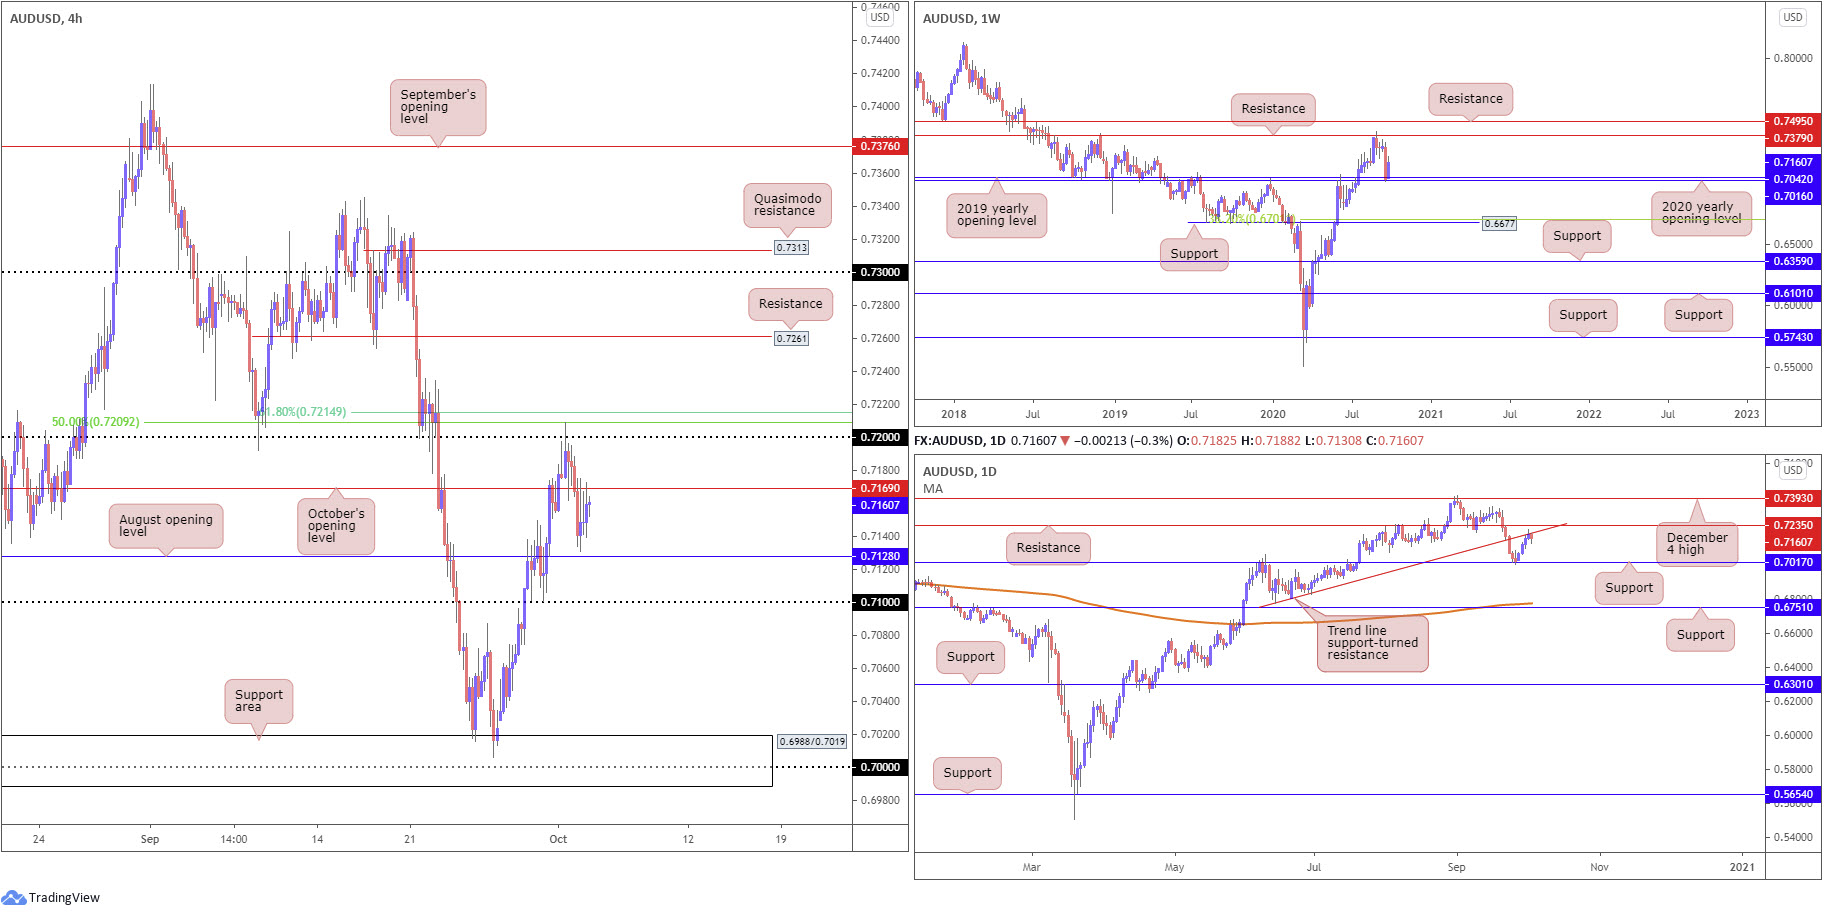
Buyers pencilled in a presence last week off the 2020 and 2019 yearly opening values at 0.7016 and 0.7042, respectively, following a 3.6% decline the week prior. Additional bullish sentiment this week could target as far north as resistance at 0.7379.
It might also be worth noting the trend in this market remains to the upside, therefore the rebound from 0.7016/0.7042 may be interpreted as a dip-buying signal.
Should the market fail to extend recovery gains, nonetheless, support priced in at 0.6677 is next in the firing range, alongside a 38.2% Fibonacci retracement ratio at 0.6701.
Daily perspective:
The rebound from support at 0.7017 sparked a wave of buying last week, drawing enough impetus to challenge trend line support-turned resistance, extended from the low 0.6776 (sited just south of resistance coming in at 0.7235).
Friday demonstrated modest selling interest off the aforementioned trendline resistance, consequently snapping a four-day bullish phase.
H4 perspective:
Against the backdrop of higher timeframe flow, intraday activity dipped a toe in waters above 0.72 on Thursday and knocked on the door of a 50.0% retracement ratio at 0.7209 (positioned a few pips under a 61.8% Fibonacci retracement ratio at 0.7214). This was sufficient to lure sellers back into the fold to overthrow October’s opening value at 0.7169, which, as you can see, served as resistance on Friday.
August’s opening value sits just beneath current action at 0.7128, closely followed by the 0.71 handle.
Areas of consideration:
Buyers, based on the weekly timeframe, face substantial resistance on the daily and H4 timeframes. For that reason, although the weekly chart indicates buying, bearish themes could present themselves this week.
- October’s opening value at 0.7169 offers interesting intraday resistance on the H4, knowing we’re bouncing from daily trend line resistance. Breaking lower from here, movement that overruns August’s opening value at 0.7128, places 0.71 on the hit list.
- Breakout buyers eyeing a move above 0.72, on the back of weekly price rebounding from support, must contend with daily resistance at 0.7235. Conservative traders are likely to seek at least a H4 close above 0.7235 before considering bullish positions.
USD/JPY:
Weekly gain/loss: -0.22%
Weekly close: 105.31
Weekly perspective:
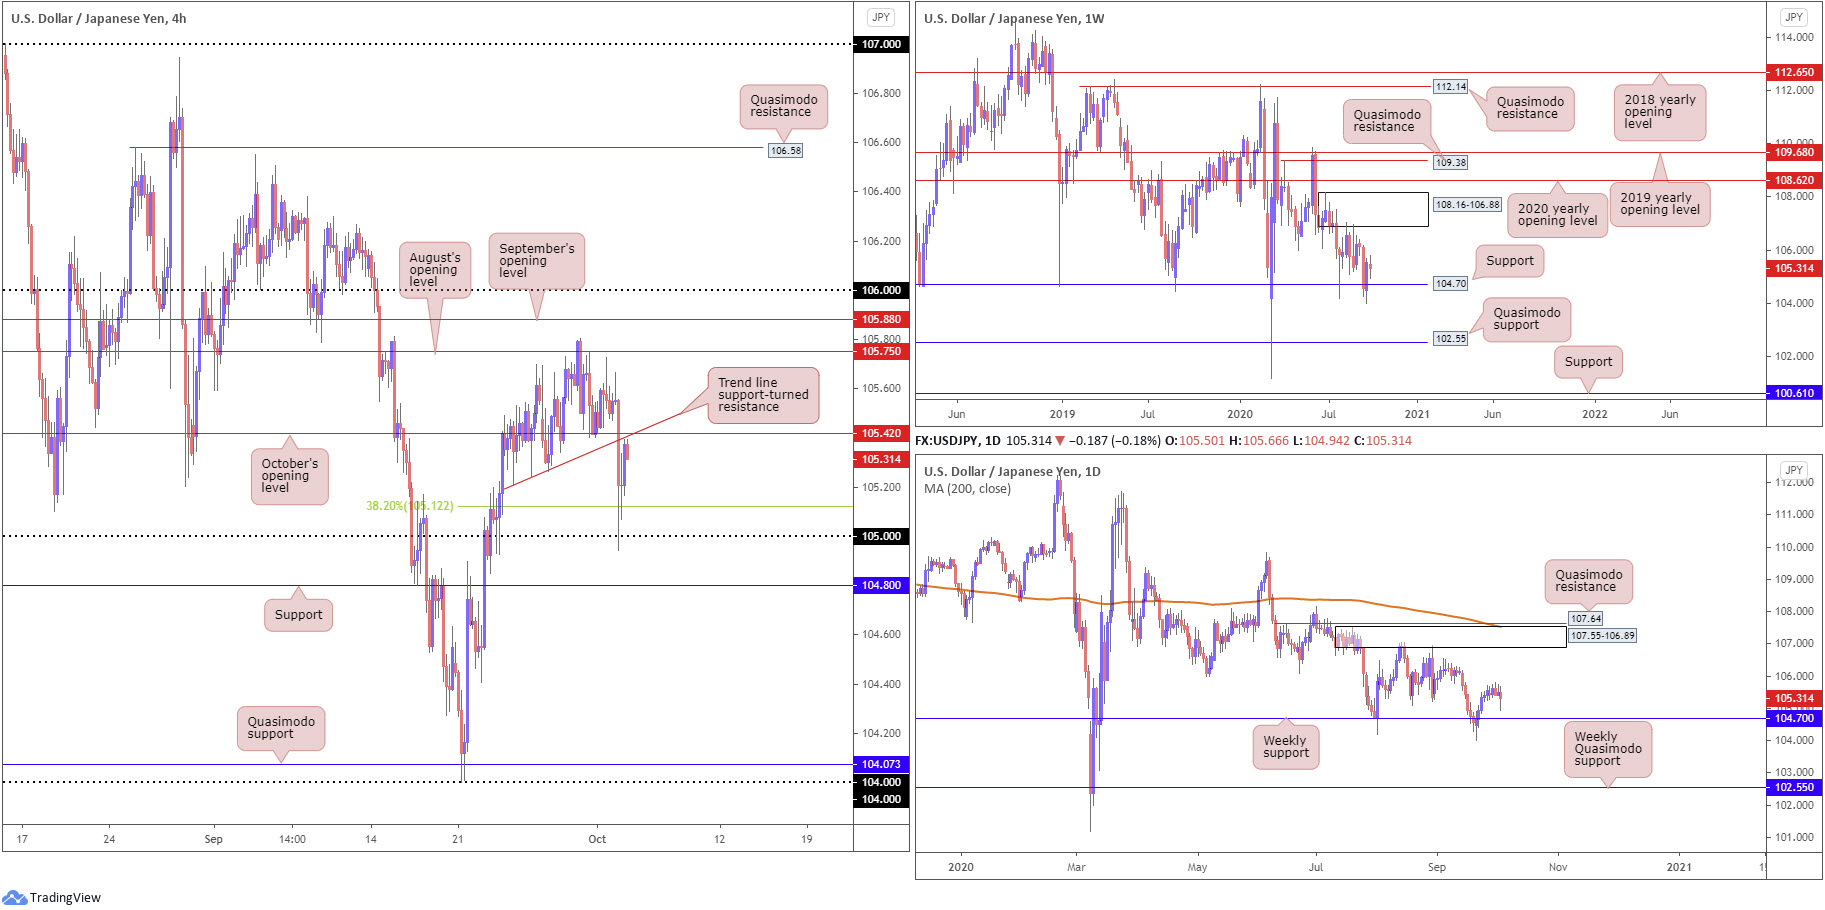
Supply at 108.16-106.88 remains prominent on the weekly timeframe, capping upside since price made its way off support at 104.70 at the end of July. The aforementioned support also recently made a second showing, with price rebounding nearly 1%. Both areas, therefore, remain firmly on the watchlist this week.
Quasimodo support at 102.55 offers a feasible target beyond current support in the event we turn south, while removing supply draws the 2020 yearly opening value at 108.62 into the fight.
Daily perspective:
Supply at 107.55-106.89, an area housed within the lower boundary of weekly supply mentioned above at 108.16-106.88, remains on the radar.
Upside momentum derived from weekly support at 104.70, although appears to have run out of steam in recent movement, highlights the possibility of readdressing the aforementioned supply this week. Of note, we can see the daily area also benefits from nearby Quasimodo resistance at 107.64 and the 200-day SMA (orange – 107.52).
H4 perspective:
Going into the close of Asia Friday, the US dollar fell sharply against the Japanese yen following US president Donald Trump announcing he tested positive for coronavirus. This guided USD/JPY to the 105 handle amid increased demand for safe-haven assets, including the Japanese yen.
However, after transitioning into European hours, the pair staged a meaningful recovery, enough to pull the candles back to just beneath October’s opening value at 105.42 and converging trend line support-turned resistance, taken from the low 105.20.
Areas of consideration:
- October’s opening value at 105.42 and trend line confluence on the H4 potentially invites intraday bearish themes this week. Should we move through 105.42, on the other hand, breakout buying to August’s opening value at 105.75 could be in the offing, followed by September’s opening value at 105.88.
- 80 support on the H4 timeframe might also be worth pencilling in this week, in the event we press lower, having seen the level combine with weekly support at 104.70.
USD/CAD:
Weekly gain/loss: -0.58%
Weekly close: 1.3306
Weekly perspective:
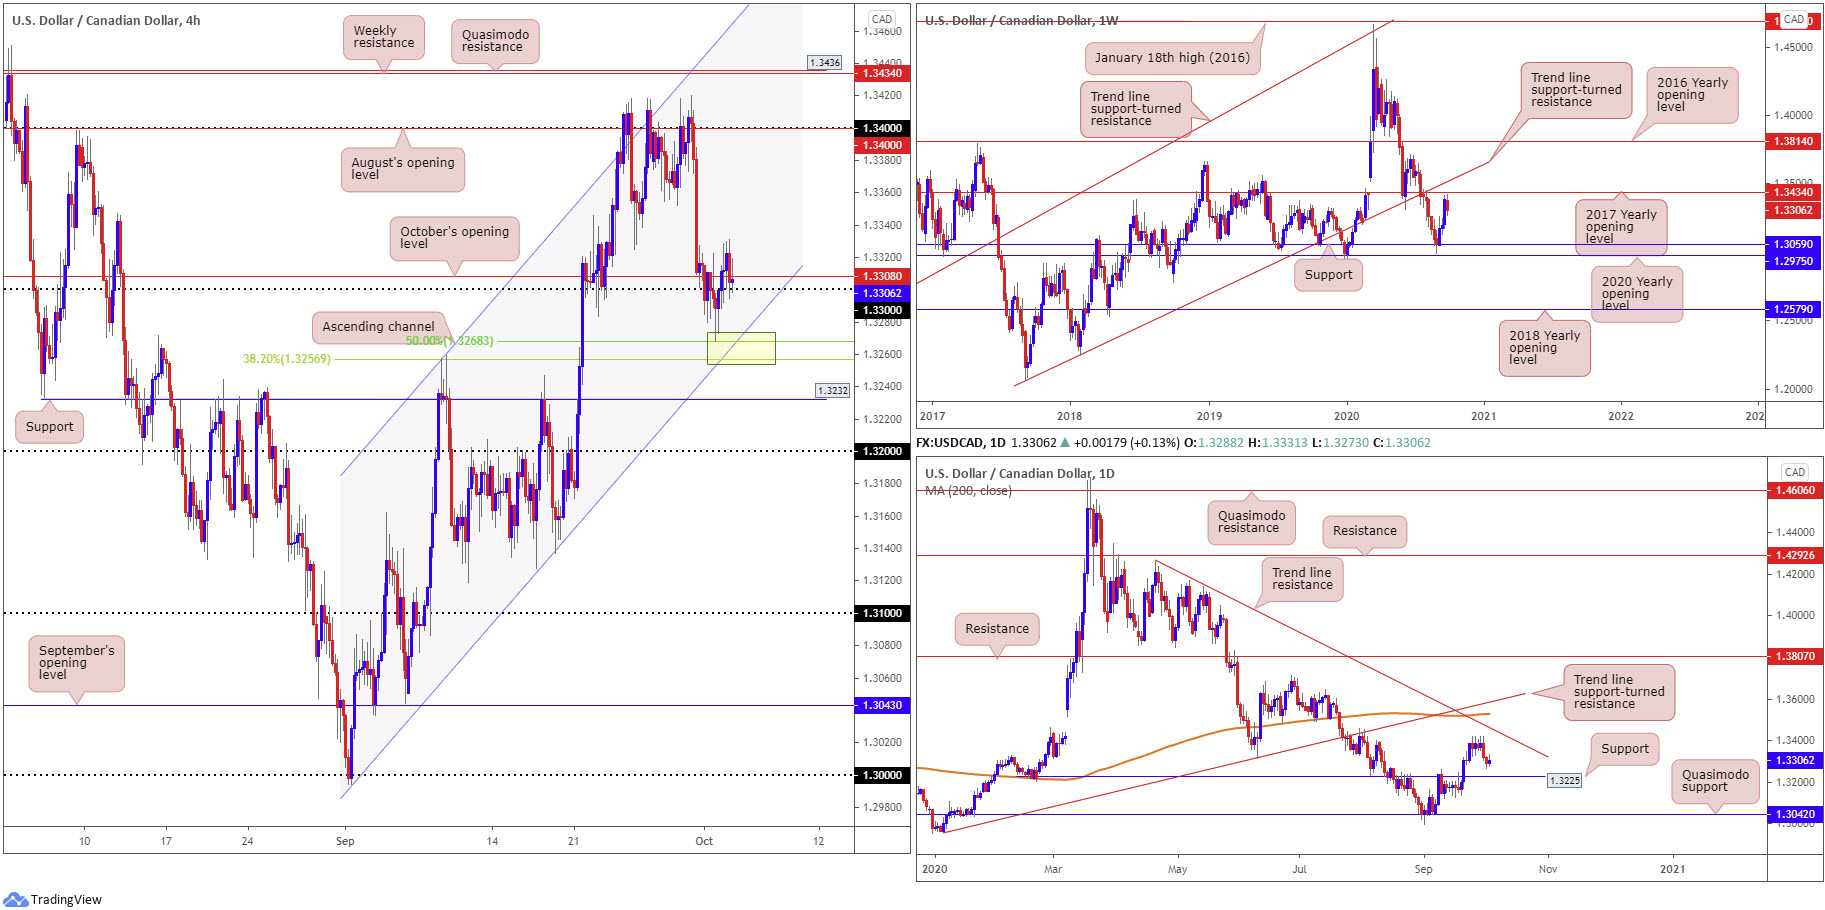
Snapping a three-week bullish phase, USD/CAD switched gears last week and rotated lower ahead of the 2017 yearly opening value at 1.3434 (sited just under trend line support-turned resistance, taken from the low 1.2061). Despite the recent downturn, 1.3434 is still likely to be a watched level this week.
Follow-through selling could eventually tug the currency pair back to support at 1.3059, pinned just north of the 2020 yearly opening value at 1.2975.
Daily perspective:
Resistance on the daily timeframe is not expected to make an appearance until trend line resistance, etched from the high 1.4265. Directly above here also rests the 200-day SMA (orange – 1.3528) and a trend line support-turned resistance, taken from the low 1.2957.
1.3225 support is also worth monitoring this week.
H4 perspective:
Thursday’s rebound from the 50.0% retracement ratio at 1.3268 witnessed limited follow-through buying on Friday, finding thin air above the 1.33 handle (and October’s opening value at 1.3308) in the shape of a bearish engulfing candle.
Price readers will also acknowledge channel support, extended from the low 1.2994, set close by, joined with a 38.2% Fibonacci retracement ratio at 1.3256.
Areas of consideration:
- The area shaded in yellow on the H4 (channel support and Fibonacci convergence) may entice buyers this week. Despite the confluence seen here, traders are urged to consider we recently turned south just ahead of weekly resistance (1.3434).
- Another H4 level worth taking into account is support priced in at 1.3232, owing to the base fusing with daily support at 1.3225.
- Should we hold above 1.33 in early trading (H4), however, this could also spark a wave of intraday buying towards the 1.34 handle.
USD/CHF:
Weekly gain/loss: -0.91%
Weekly close: 0.9201
Weekly perspective:
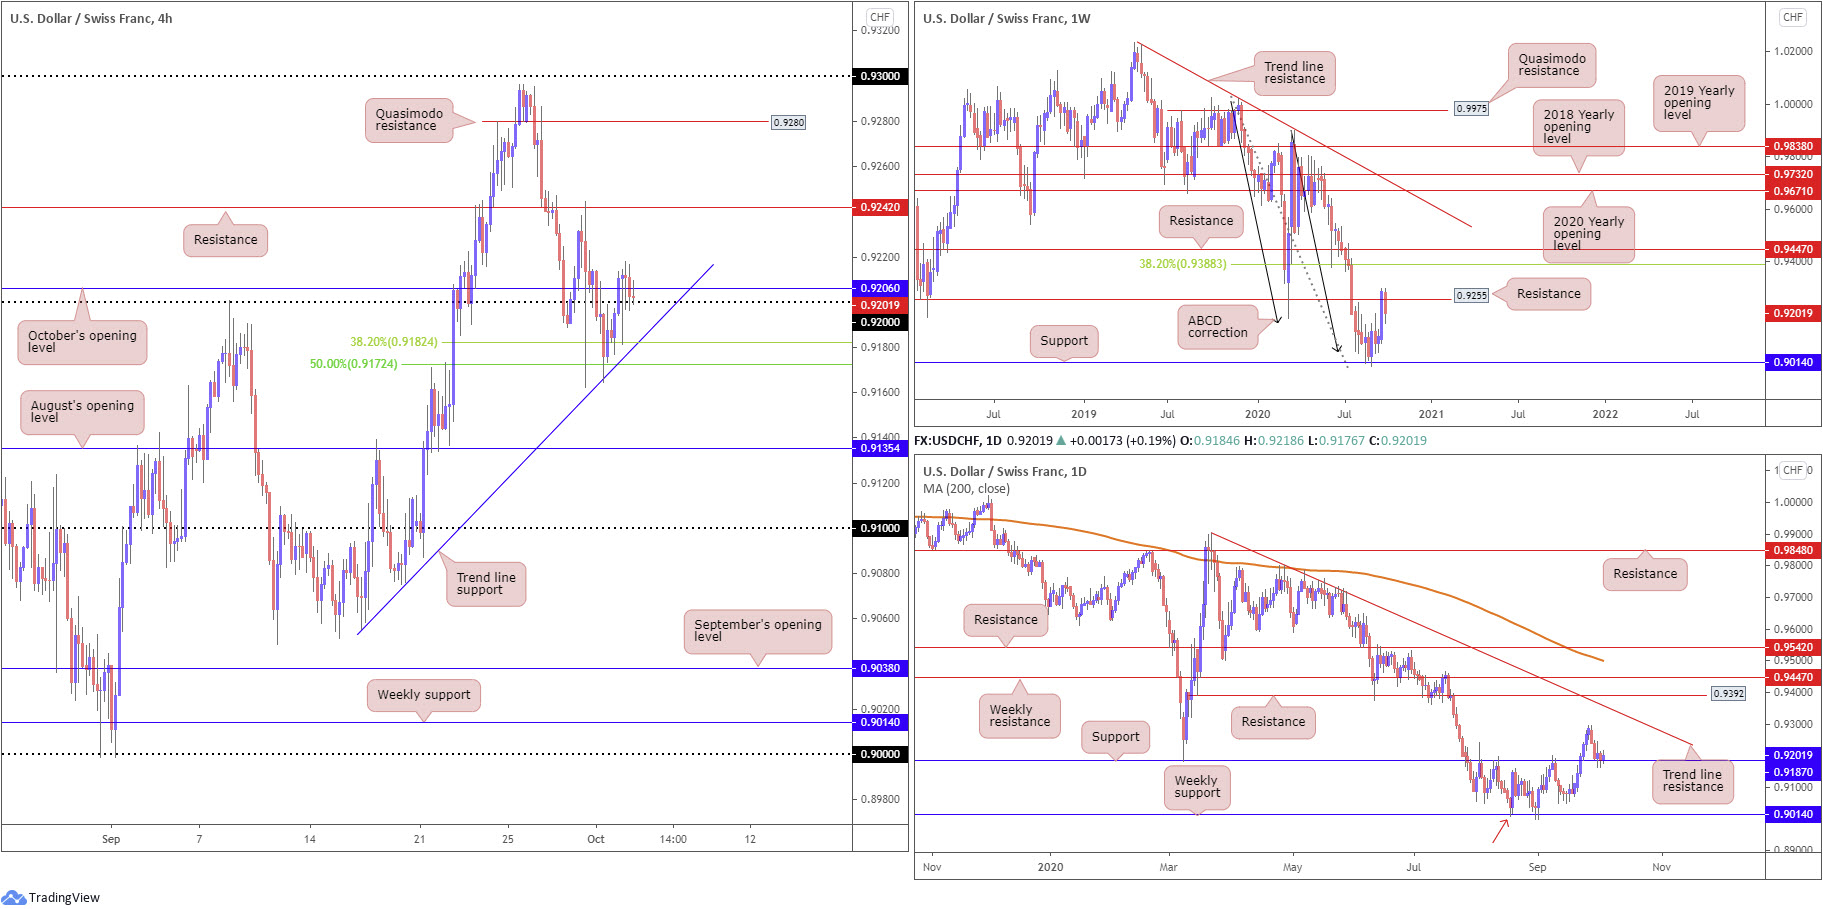
Following a decisive move north of support at 0.9014, potentially gleaning additional impetus from ABCD support at 0.9051 (black arrows), resistance at 0.9255 (a previous Quasimodo support level) recently put in an appearance.
Extending downside this week is, of course, a possibility. The focus above current resistance, nonetheless, falls in at a 38.2% Fibonacci retracement ratio at 0.9388, a common take-profit target out of ABCD patterns (derived from legs A-D).
Daily perspective:
Support at 0.9187 on the daily timeframe has served as a critical level for USD/CHF over the past week, following the dip from the aforementioned weekly resistance.
The daily chart does not seem to be throwing up any red flags in terms of resistance until a trend line formation, etched from the high 0.9901, makes a show. Dropping through daily support this week, however, potentially offers an early cue to further weakness on the weekly timeframe, targeting weekly support (also stands as a Quasimodo support on the daily chart – red arrow).
H4 perspective:
Joining daily support at 0.9187, the H4 chart displays a 50.0% retracement ratio at 0.9172, a 38.2% Fibonacci retracement ratio at 0.9182 and a trend line support, coming in from the low 0.9055. Together, this was enough confluence to encourage buyers to reclaim 0.92+ status Friday and tackle October’s opening value at 0.9206.
Keeping hold of the 0.92 handle in early trading this week shines the spotlight on a possible run to H4 resistance at 0.9242, with a break perhaps unearthing H4 Quasimodo resistance at 0.9280.
Areas of consideration:
A decisive H4 close above October’s opening value at 0.9206 may be enough to confirm bullish intent off daily support at 0.9187 and excite intraday buyers, targeting H4 resistance at 0.9242.
Beyond the 50.0% retracement ratio at 0.9172 (H4), should price extend losses off weekly resistance at 0.9255, sellers will likely hone in on August’s opening value at 0.9135 as an initial downside target.
Dow Jones Industrial Average:
Weekly gain/loss: +2.22%
Weekly close: 27761
Weekly perspective:
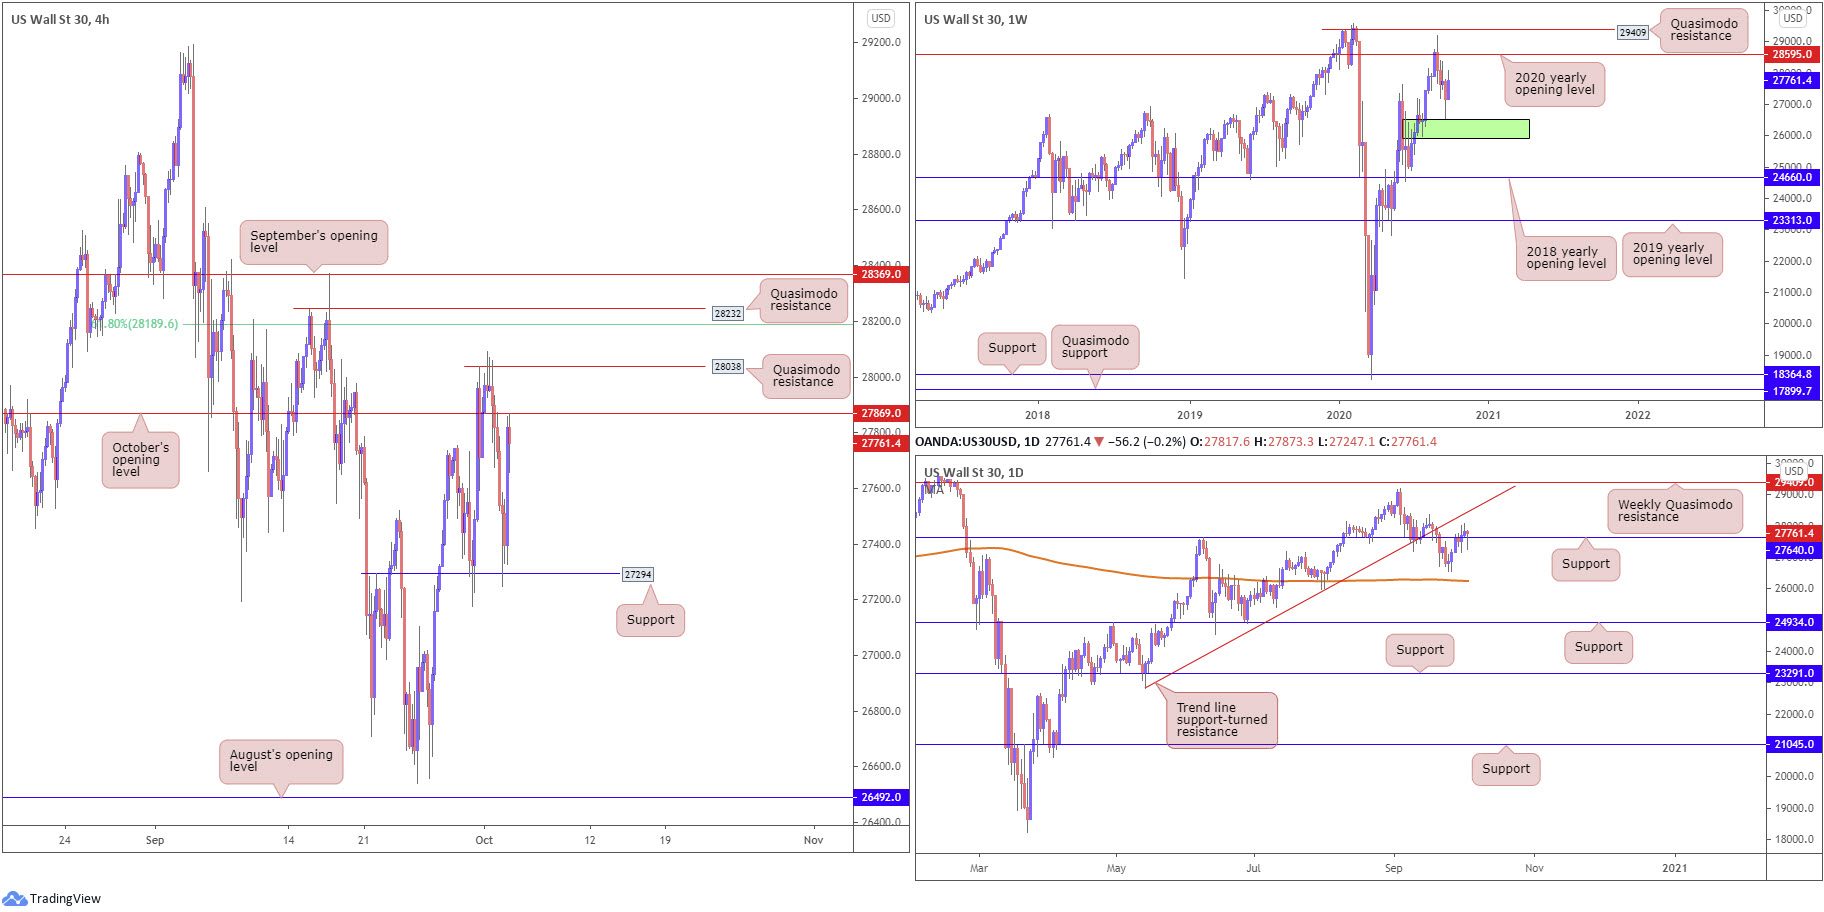
After a somewhat energetic spike to lows at 26541, missing demand (green) at 25916-26523 by a hair, sellers handed the baton to buyers in recent trading, clocking peaks at 28092.
A steady pick-up in demand this week throws the 2020 yearly opening value at 28595 into the mix as feasible resistance, placed ahead of Quasimodo resistance at 29409.
Daily perspective:
Last week had buyers and sellers battle for position around support at 27640. Notably, Friday concluded in the shape of a hammer candlestick formation, informing market participants that buyers are present.
Sustained upside this week may find the unit engages with a trend line support-turned resistance, extended from the low 22803, which happens to intersect with the 2020 yearly opening value at 28595 highlighted above on the weekly timeframe.
H4 perspective:
Major US equity benchmarks declined Friday, following news that US President Trump and the first lady tested positive for coronavirus. In spite of this, all three major indexes recorded weekly gains.
Friday saw the Dow Jones Industrial Average drop 134.09 points, or 0.48%; the S&P 500 fell 32.36 points, or 0.96% and the Nasdaq traded lower by 251.49 points, or 2.22%.
News of Trump’s positive virus test sent the DJIA sharply lower in late Asian trading Friday, scoring lows at 27247 and challenging support coming in at 27294. The move lower, however, was short-lived as European hours witnessed a recovery that was extended into the US session, enough movement to test October’s opening value at 27869 by the close.
Areas of consideration:
Sellers may not have the firepower to extend price south of October’s opening value on the H4 at 27869 this week, knowing we have room to push higher on the weekly timeframe and daily price recently concluded off support by way of a hammer candle pattern.
As a result, bullish themes could be found above 27869, targeting H4 Quasimodo resistance at 28038, followed by a 61.8% Fibonacci retracement ratio at 28189. However, the 2020 yearly opening value at 28595 on the weekly timeframe, along with daily trend line resistance, is likely marked as an ultimate upside target this week.
XAU/USD (GOLD):
Weekly gain/loss: +2.02%
Weekly close: $1,899
Weekly perspective:
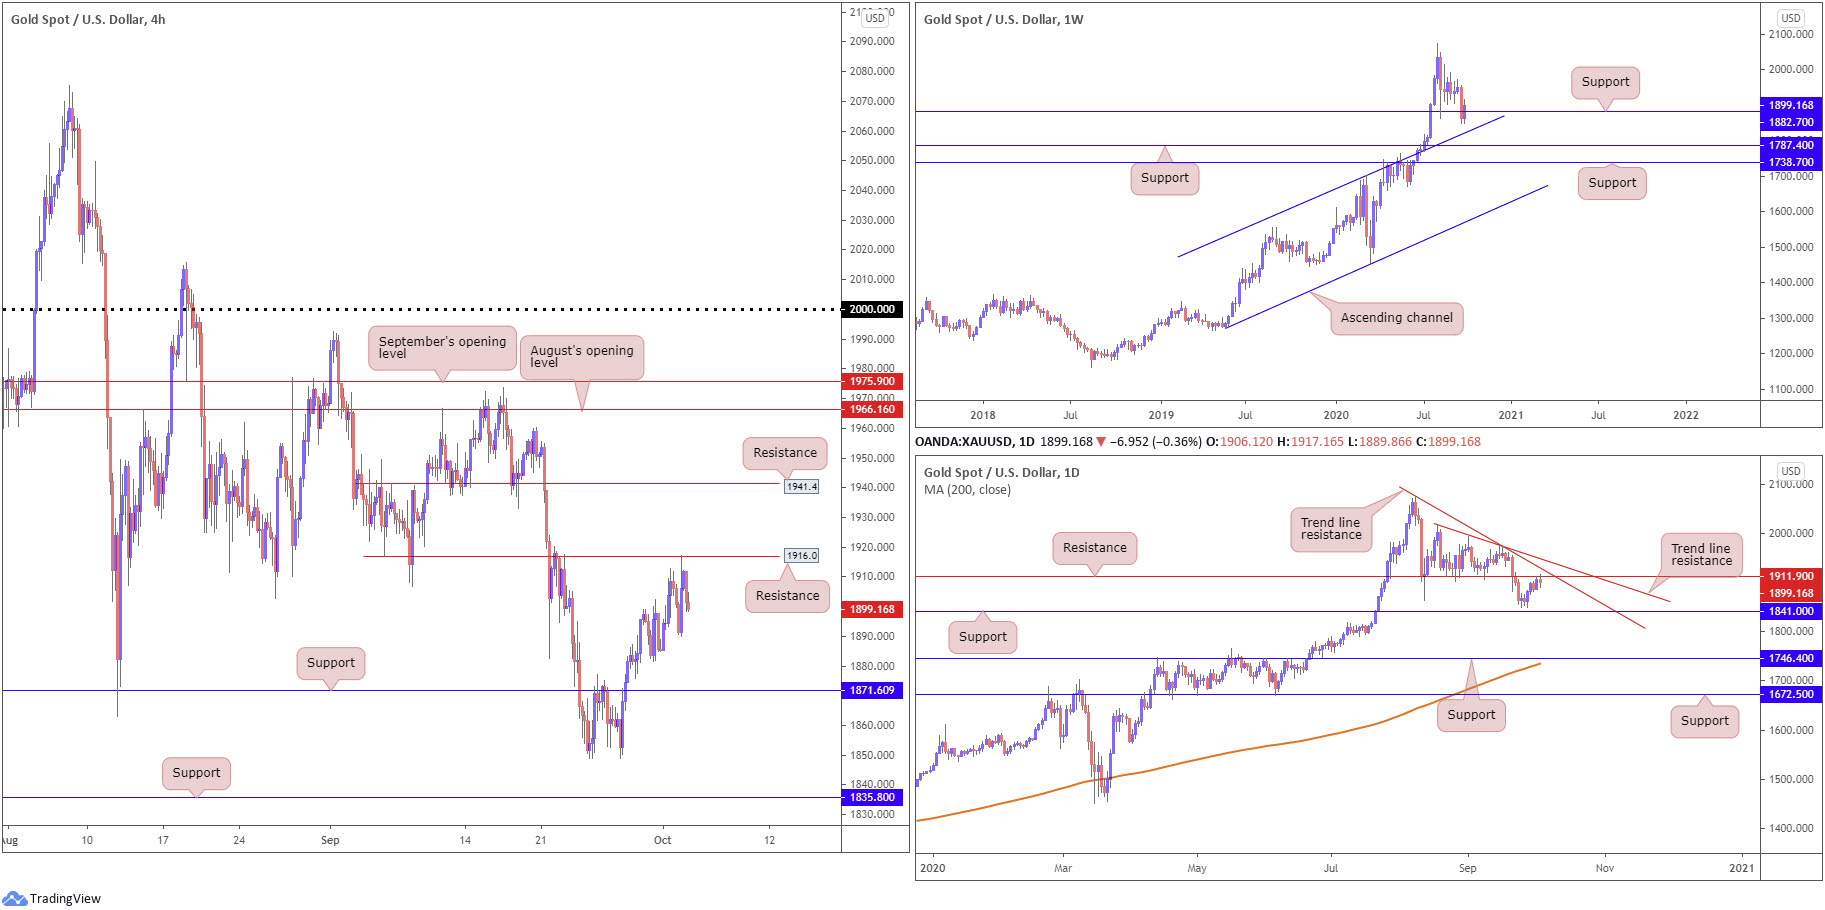
Bullion is seen attempting to regain some status above support at $1,882, despite leaving behind channel resistance-turned support, etched from the high $1,703.
If buyers maintain a dominant position north of $1,882 this week, are traders likely to seek all-time peaks at $2,075?
Daily perspective:
Resistance at $1,911, as you can see, made an appearance heading into the second half of the week. This is a reasonably solid S/R level that’s sited just south of trend line resistance, taken from the high $2,075, as well as another trend line resistance, drawn from the high $2,015.
To the downside, the yellow metal could stretch as far south as support at $1,841, fixed just beneath the $1,848 September 28 low.
H4 perspective:
Upside momentum subsided heading into Wednesday’s session, and continued to establish deep retracements before finally testing resistance at $1,916 on Friday. Note price sold off from here into the close, underlining the possibility of reaching for support at $1,871 sometime this week.
Areas of consideration:
Given H4 demand to the left of price appears mostly consumed and daily price recently tested resistance at $1,911, cruising back to H4 support at $1,871 this week is possible.
On the flip side, a H4 close above $1,916 may call for H4 resistance at $1,941, in line with weekly price holding above support at $1,882.
The accuracy, completeness and timeliness of the information contained on this site cannot be guaranteed. IC Markets does not warranty, guarantee or make any representations, or assume any liability regarding financial results based on the use of the information in the site.
News, views, opinions, recommendations and other information obtained from sources outside of www.icmarkets.com.au, used in this site are believed to be reliable, but we cannot guarantee their accuracy or completeness. All such information is subject to change at any time without notice. IC Markets assumes no responsibility for the content of any linked site.
The fact that such links may exist does not indicate approval or endorsement of any material contained on any linked site. IC Markets is not liable for any harm caused by the transmission, through accessing the services or information on this site, of a computer virus, or other computer code or programming device that might be used to access, delete, damage, disable, disrupt or otherwise impede in any manner, the operation of the site or of any user’s software, hardware, data or property.


