
Key risk events today:
UK Services PMI; US ISM Non-Manufacturing PMI.
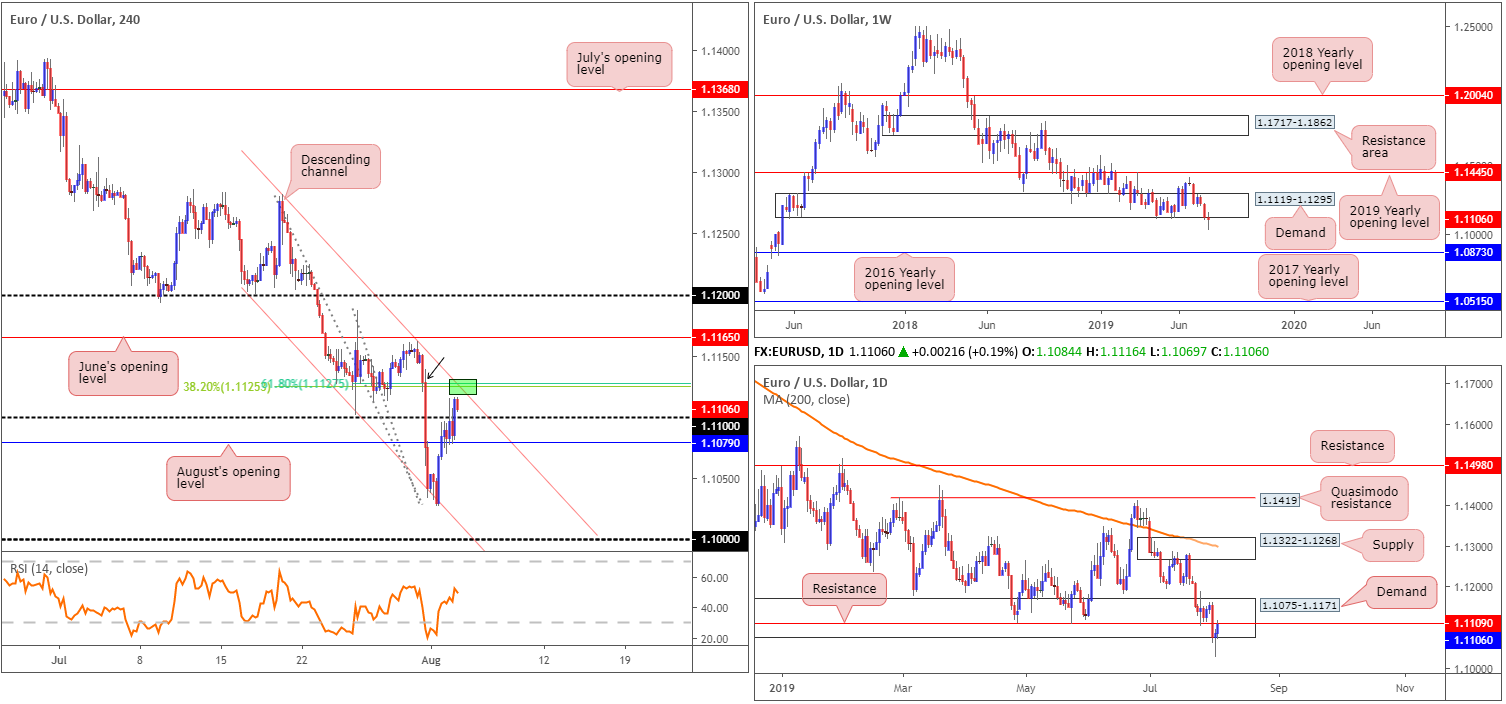
EUR/USD:
Weekly gain/loss: -0.17%
Weekly close: 1.1106
Weekly perspective:
Europe’s single currency relinquished additional ground to the dollar last week, clocking multi-year lows of 1.1026. Long-standing demand at 1.1119-1.1295, which capped downside since November 2018, is now in a vulnerable position after having its lower edge firmly submerged. With sell stops likely filled, focus shifts to the 2016 yearly opening level at 1.0873 as a next viable support. In addition to this, it is worth noting the long-term trend faces a southerly bearing since topping in early 2018.
Daily perspective:
In conjunction with weekly structure, daily action also whipsawed beneath the lower parapet of demand at 1.1075-1.1171 (glued to the lower edge of the current weekly demand) Thursday in the shape of an acceptable hammer candlestick formation. Although the said demand remains in motion, clean resistance resides at 1.1109 and could hamper any upside attempts this week. Areas beyond the aforementioned demand/resistance fall in around supply at 1.1322-1.1268 which intersects with a 200-day SMA (orange), and demand (not visible on the screen) coming in at 1.0860-1.0954 (encapsulates the 2016 yearly opening level highlighted on the weekly timeframe at 1.0873).
H4 perspective:
Headline non-farm payrolls out of the US Friday printed in line with expectations at 164,000; the unemployment rate was also unchanged at 3.7% though average hourly earnings ticked higher at 0.3% vs. a consensus of 0.2%. The report immediately guided the EUR/USD lower, though swiftly encountered a floor of buying off August’s opening level nearby at 1.1079. The day concluded extending Thursday’s gains and closing a few points north of 1.11. Although a bullish indicator, resistance rests close by in the form of a channel resistance (taken from the high 1.1282) and a merging Fibonacci cluster (61.8%/38.2%) at 1.1127/1.1125.
Areas of consideration:
Longer term, having witnessed both weekly and daily demands suffer stop runs last week and daily resistance enter the fray at 1.1109, suggests further losses could be in store over the coming weeks.
The story on the H4 timeframe, despite reclaiming 1.11+ status, faces resistance from the channel resistance and combined Fibonacci cluster around 1.1127. This – coupled with daily resistance at 1.1109 – certainly positions the unit within a negative climate this week.
A sell from 1.1127ish is valid, according to the technical studies, with protective stop-loss orders placed above the small (kink – black arrow) H4 supply at 1.1139. Ultimately, an engulf of 1.11 and August‘s opening level is eyed thereafter, enabling traders to comfortably reduce risk to breakeven and liquidate partial profit. For conservative traders concerned about possible buying emerging off 1.11/1.1079, waiting for a H4 close to form beneath 1.1079 could be an idea, though by doing so you miss a considerable portion of the move and the risk/reward is not as favourable.
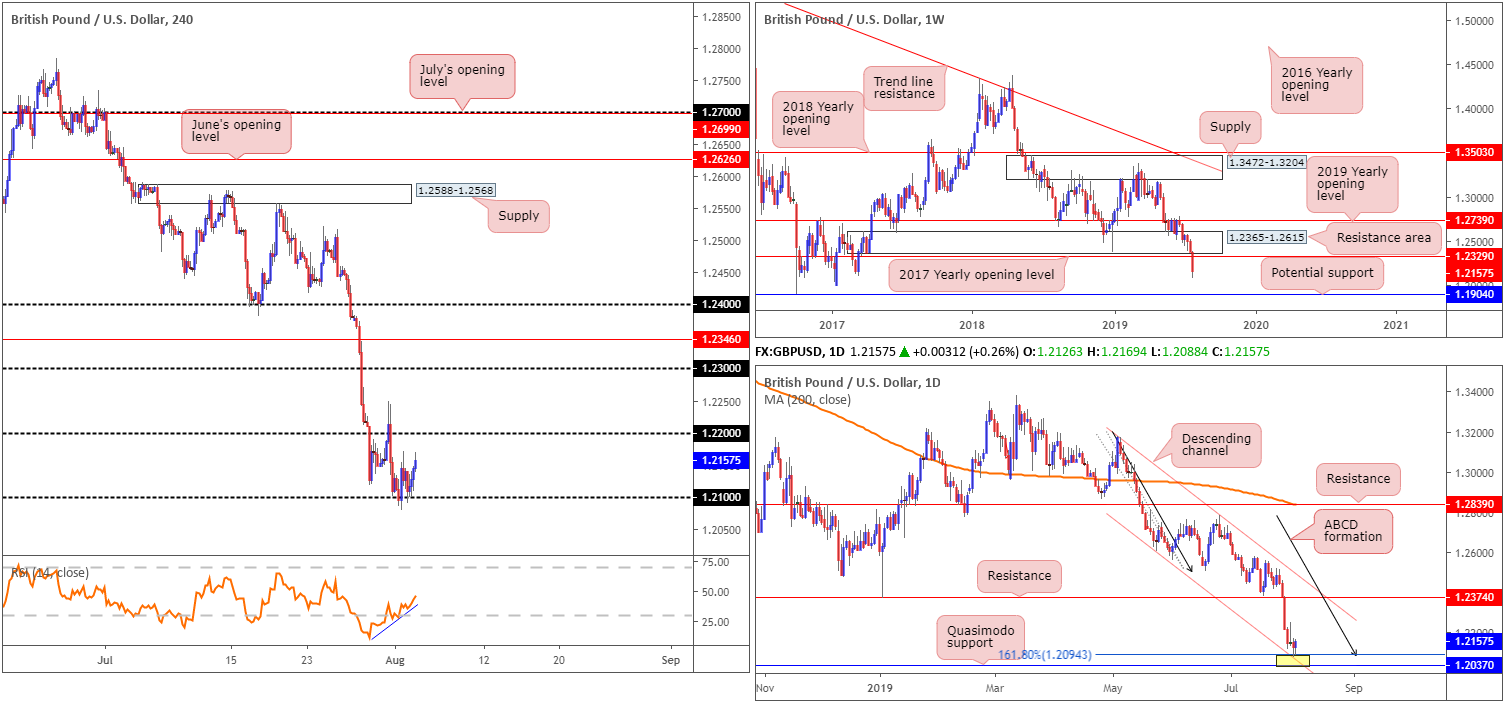
GBP/USD:
Weekly gain/loss: -1.80%
Weekly close: 1.2157
Weekly perspective:
Since retesting the underside of the 2019 yearly opening level at 1.2739 in May, the British pound has been grinding lower against its US counterpart. Tunnelling through bids residing within long-standing demand at 1.2365-1.2615 and eventually overthrowing the 2017 yearly opening level at 1.2329, longer-term flow is exposed to further downside this week, targeting potential support from 1.1904: a standout low clocked in early October 2016.
Daily perspective:
Contrary to the weekly timeframe’s estimation, daily movement is bottoming around the top edge of a rather interesting support zone between 1.2037/1.2094. Comprised of a 161.8% ABCD (black arrows) pattern at 1.2094, a channel support extended from the low 1.2605 and a Quasimodo support at 1.2037, does this area possess enough oomph to send price towards resistance at 1.2374 this week?
H4 perspective:
Having observed the buck explore lower ground for a second consecutive session Friday, the British pound mustered enough strength to defend 1.21. For those who read Friday’s morning brief you may recall the piece highlighted the following:
Interestingly, Thursday’s candle action on the H4 timeframe chalked up a notable bullish engulfing pattern off 1.21. This – coupled with the daily support area at 1.2037/1.2094 – could be enough to lift sterling towards at least 1.22. Entry can be taken at current price with a protective stop-loss order position beneath the H4 bullish engulfing tail (1.2079). Reducing risk to breakeven as soon as possible is certainly something to consider, given the weekly timeframe’s position at the moment.
Areas of consideration:
Well done to any of our readers who managed to hold their long positions, consequently ending the week marginally in the green. As underlined above, the next upside target is 1.22, with a break of this number likely freeing upside towards 1.23.
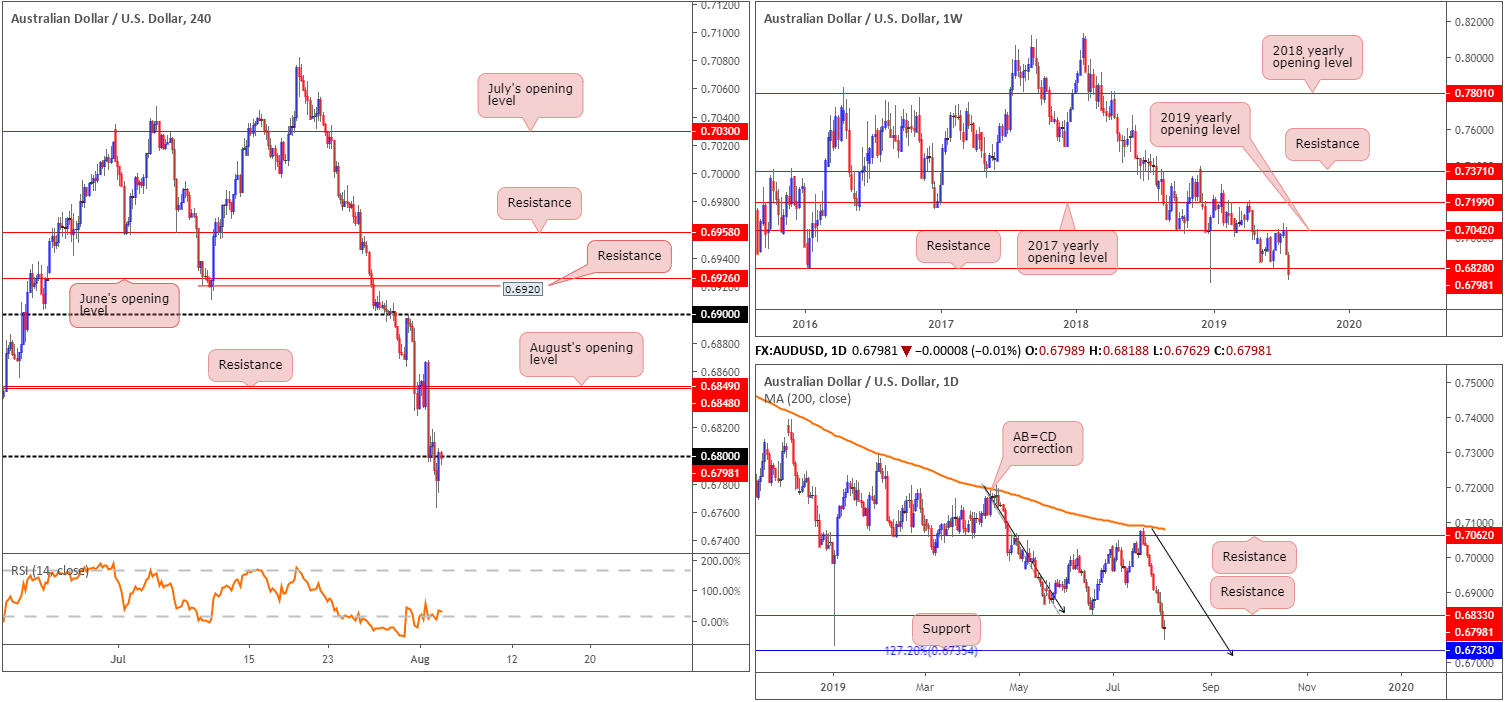
AUD/USD:
Weekly gain/loss: -1.60%
Weekly close: 0.6798
Weekly perspective:
Over the course of last week’s movement, the commodity linked currency slipped beneath notable support at 0.6828 (now potentially serving as resistance), extending the pullback from the 2019 yearly opening level (resistance) at 0.7042.
Erasing more than 100 points and stretching its losing streak for the eleventh consecutive daily session – the longest since 2015 – positions the unit in a rather negative climate, as the next support is not visible until 0.6395 on this timeframe (not seen on the screen).
Daily perspective:
In tandem with weekly price, daily flow engulfed the 0.6833 June 18 low Thursday (now acting resistance), though failed to generate much follow-through momentum Friday, closing in the shape of a clear-cut indecision candle. The next downside target from this point can be seen at 0.6733, which happens to merge with a 127.2% AB=CD (black arrows) formation at 0.6735.
H4 perspective:
Following the release of slightly better-than-expected US wage growth data, which momentarily helped the buck stall its corrective slide from two-year tops – set in the aftermath of a hawkish rate cut by the Fed – the Aussie dollar struck fresh yearly lows of 0.6762.
From a technical standpoint, the H4 candles wrapped up the week retesting 0.68 as resistance.
For those who read Friday’s briefing you may recall the following:
Today’s spotlight is firmly focused on a potential break of 0.68. Dipping beneath here and following up with a strong retest play, preferably in the shape of a H4 bearish candlestick formation (provides entry/risk levels to work with) is, according to the overall technical picture this morning, a high-probability shorting opportunity, targeting daily support mentioned above at 0.6733.
Areas of consideration:
Having seen H4 price retest 0.68 at the close, focus shifts to a possible H4 bearish candlestick configuration forming. In the event this occurs, aside from possible support developing from Friday’s low 0.6762, daily support is the next downside target at 0.6733, closely followed by the 0.67 handle on the H4 timeframe (not visible on the screen).
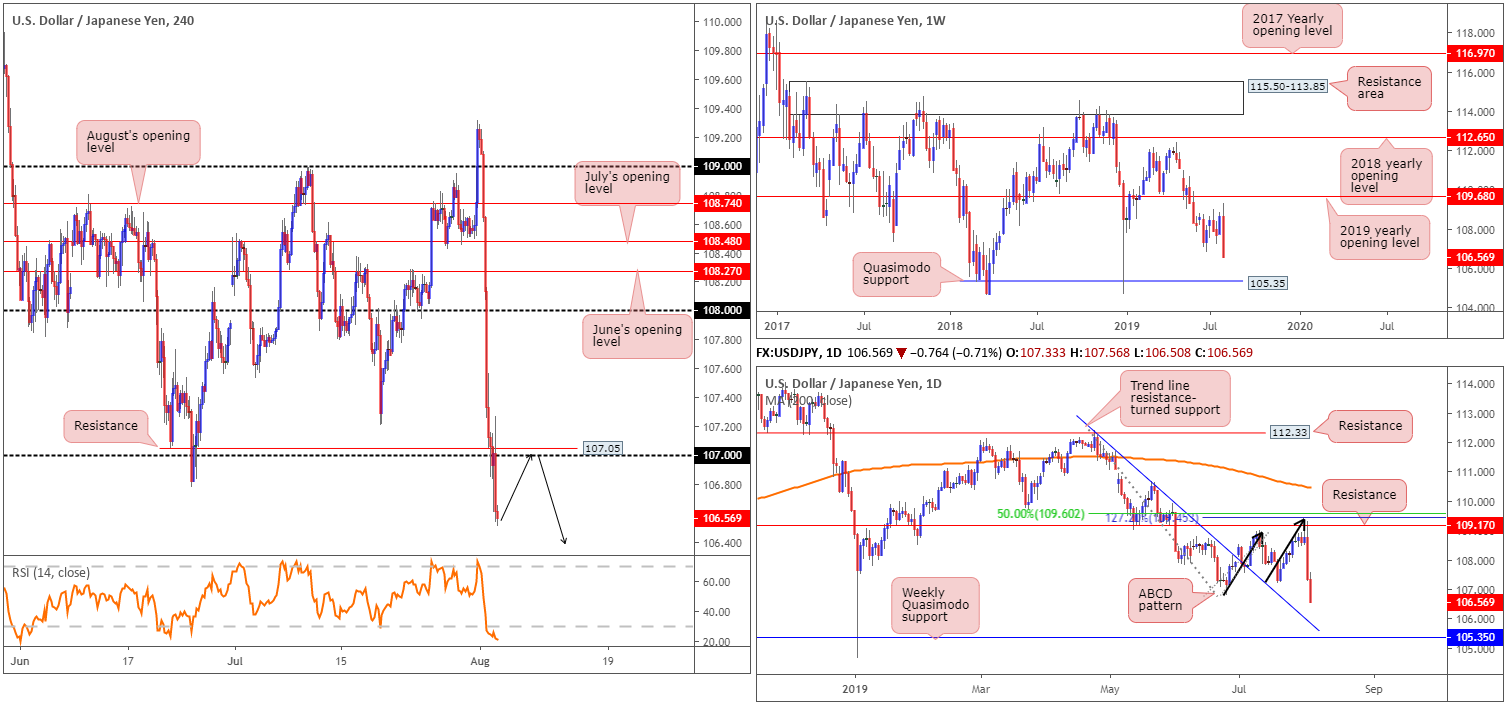
USD/JPY:
Weekly gain/loss: -1.90%
Weekly close: 106.56
Weekly perspective:
By way of a mammoth bearish engulfing pattern, the US dollar ceded considerable ground against the Japanese yen last week, erasing more than 200 points. As is evident from the weekly timeframe, this positions the unit within close proximity to Quasimodo support at 105.35 this week.
Daily perspective:
Over the course of last week, the research team repeatedly broadcasted a high-probability resistance area situated at 109.68/109.17. Comprised of a 2019 yearly opening level at 109.68 on the weekly timeframe, daily resistance at 109.17 which comes together with a nearby 127.2% ABCD (black arrows) bearish formation at 109.45 and a 50.0% retracement value at 109.60, collectively held price action lower last week.
In terms of the next support target on the daily scale, we have trend line resistance-turned support extended from the high 112.40, closely followed by the weekly Quasimodo support cited above at 105.35.
H4 perspective:
Following Thursday’s 140-point decline, further downside emerged Friday as employment data out of the US failed to turn market sentiment. With the US dollar index eyeing a retest of 98.00 and the 10-year US Treasury yield erasing 2%, price action wrapped up the week sub 107, with 106 next in the firing range as viable support on the H4 timeframe.
Areas of consideration:
Having witnessed the H4 candles recently dethrone 107 to the downside, and both weekly and daily timeframes exhibit scope to press lower, focus shifts to a possible retest motion (black arrows) today/early week.
A retest at 107, preferably in the shape of a bearish candlestick configuration, is considered a high-probability shorting opportunity, targeting the 106 handle (not visible on the screen) as an initial port of call. Beyond here, the research team has eyes on the daily trend line resistance-turned support underscored above.
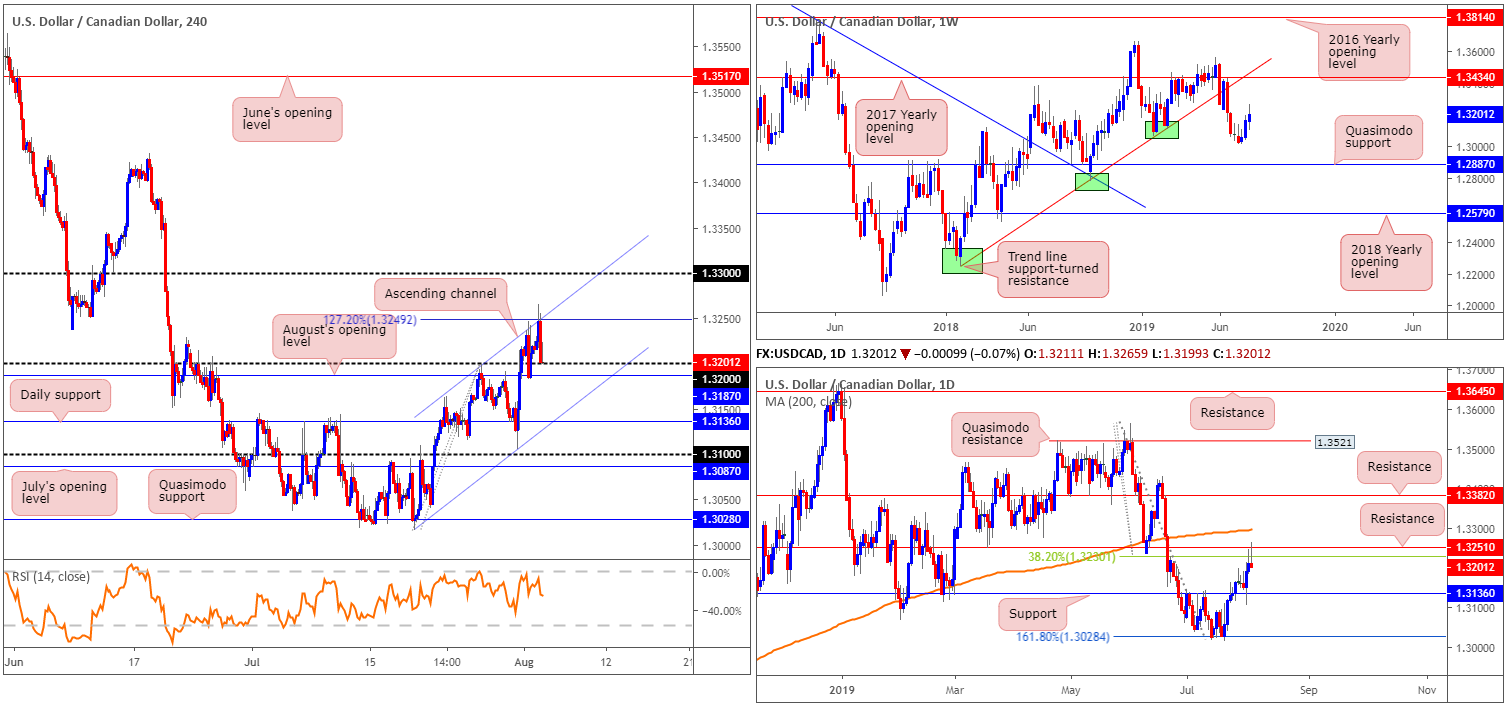
USD/CAD:
Weekly gain/loss: +0.27%
Weekly close: 1.3201
Weekly perspective:
Since bottoming at 1.3018 in the form of an inverted hammer pattern, the USD/CAD has been steadily grinding higher. Continued buying from this point has the 2017 yearly opening level at 1.3434 to target, closely shadowed by trend line support-turned resistance etched from the low 1.2247. In the event we turn lower, however, traders’ crosshairs will likely be fixed on Quasimodo support at 1.2887.
Daily perspective:
Closer examination of price action on the daily timeframe, nonetheless, reveals the pair shook hands with resistance at 1.3251 Friday and formed a striking shooting star pattern. This, alongside a 38.2% Fibonacci resistance at 1.3230, may be sufficient to entice sellers into the market this week, permitting a retest of support at 1.3136.
We could potentially push much further beyond 1.3136, though, as the weekly timeframe broke beneath trend line support (extended from the low 1.2247), possibly signalling the beginning of a downtrend.
H4 perspective:
Friday witnessed the USD/CAD connect with channel resistance (taken from the high 1.3199) and merging 127.2% Fibonacci ext. point at 1.3249 as US employment data aired.
WTI printing a mild recovery, along with the US dollar index crunching towards 98.00 following NFP data, saw the H4 candles revisit 1.32 and close in the shape of an inverted hammer candlestick formation (considered a bullish signal). Note also a few points south of 1.32 there resides August’s opening level at 1.3187. In the event 1.3187/1.32 fails to hold price, the next layer of support can be found on the daily timeframe highlighted above at 1.3136, which aligns closely with H4 channel support etched from the low 1.3015.
Areas of consideration:
A response from 1.3187/1.32, having seen the H4 inverted hammer formation close out the week, could materialise today, though to take advantage of this move traders must ensure risk/reward is factored in as not only are we coming off daily resistance at 1.3251, H4 resistance resides close by at 1.3249. Entering long based off the inverted hammer pattern is an option, setting a buy stop around the high of the configuration and positioning a stop-loss order beneath its low point.
As underlined above, daily support at 1.3136 is another layer of support to keep an eye on this week, owing to it fusing with H4 channel support.
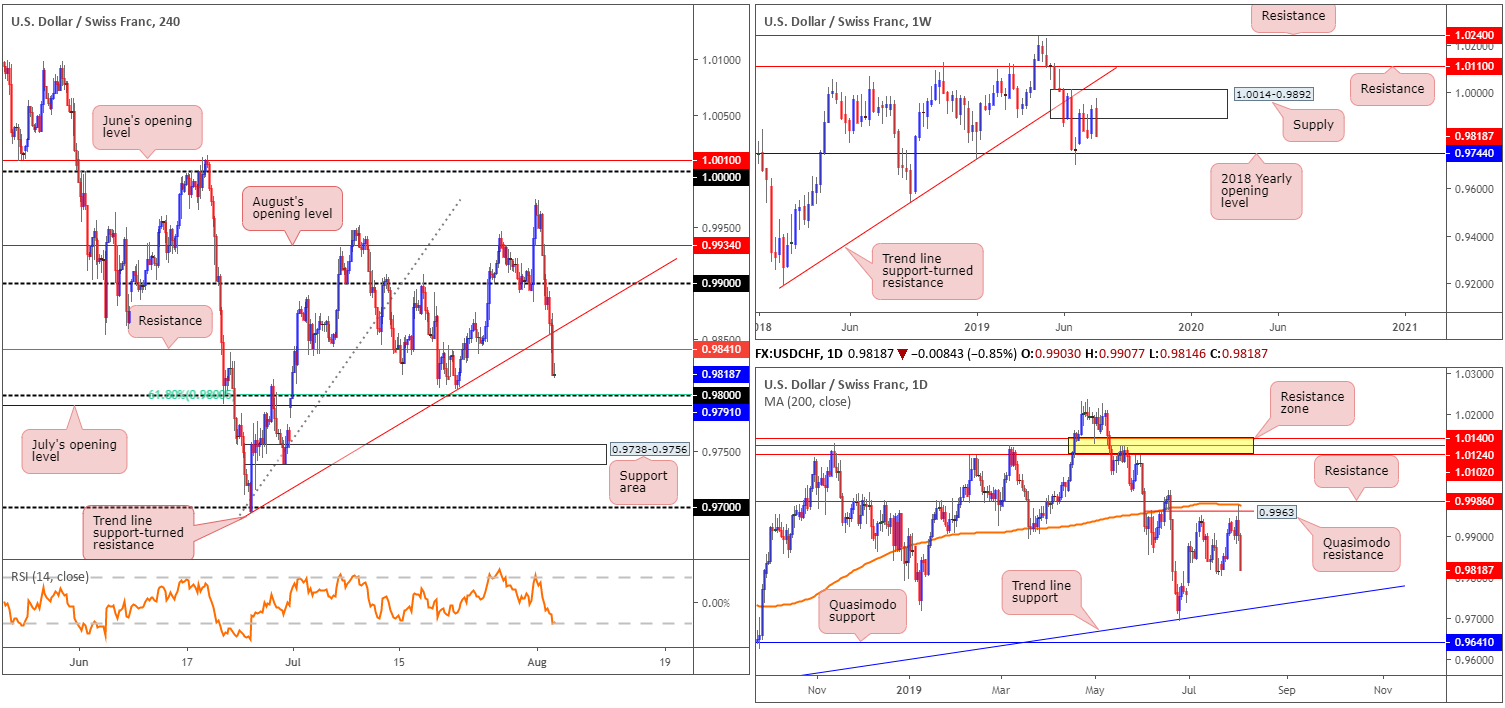
USD/CHF:
Weekly gain/loss: -1.14%
Weekly close: 0.9818
Weekly perspective:
For five weeks, price action has fluctuated between gains/losses within the walls of supply at 1.0014-0.9892. Last week’s movement, as you can see, formed a nice-looking bearish candle that engulfed the prior week’s gains and potentially set the stage for a run towards the 2018 yearly opening level at 0.9744 this week.
Daily perspective:
Aided by a robust collection of daily resistances between 0.9986/0.9963: a Quasimodo resistance at 0.9963, the 200-day SMA (currently trading around 0.9979) and resistance coming in at 0.9986, the unit aggressively sold off from the area Thursday/Friday. Closing within striking distance of the 0.9803 July 22nd low, this is the first port of call in terms of support on this timeframe this week, followed by a trend line support pencilled in from the low 0.9542.
H4 perspective:
The aftermath of Friday’s job’s report witnessed a knee-jerk reaction to highs of 0.9872, using support at 0.9841. The move, however, was short lived, as price collapsed lower and reclaimed 0.9841, leaving the H4 candles eyeing 0.98 into the close. Note 0.98 is likely an appealing base of support to many traders, having seen it merge with a 61.8% Fibonacci ratio and nearby July’s opening level at 0.9791. Beyond 0.9791, the research team notes a support area lurking at 0.9738-0.9756, followed by the 0.97 handle.
Areas of consideration:
The 0.98 handle and its surrounding levels offer potential support today/early week. Despite boasting limited confluence out of the higher timeframes, a reaction from here to H4 resistance at 0.9841 is certainly a possibility. To help avoid an unnecessary loss, traders may opt to wait for additional candlestick confirmation, be it on the H1 or H4 (entry and risk can be determined according to this structure).
Beneath 0.98. as aired above, we also have the H4 support area at 0.9738-0.9756 which is of interest for potential long opportunities this week, largely due to it converging with the 2018 yearly opening level at 0.9744 on the weekly timeframe.
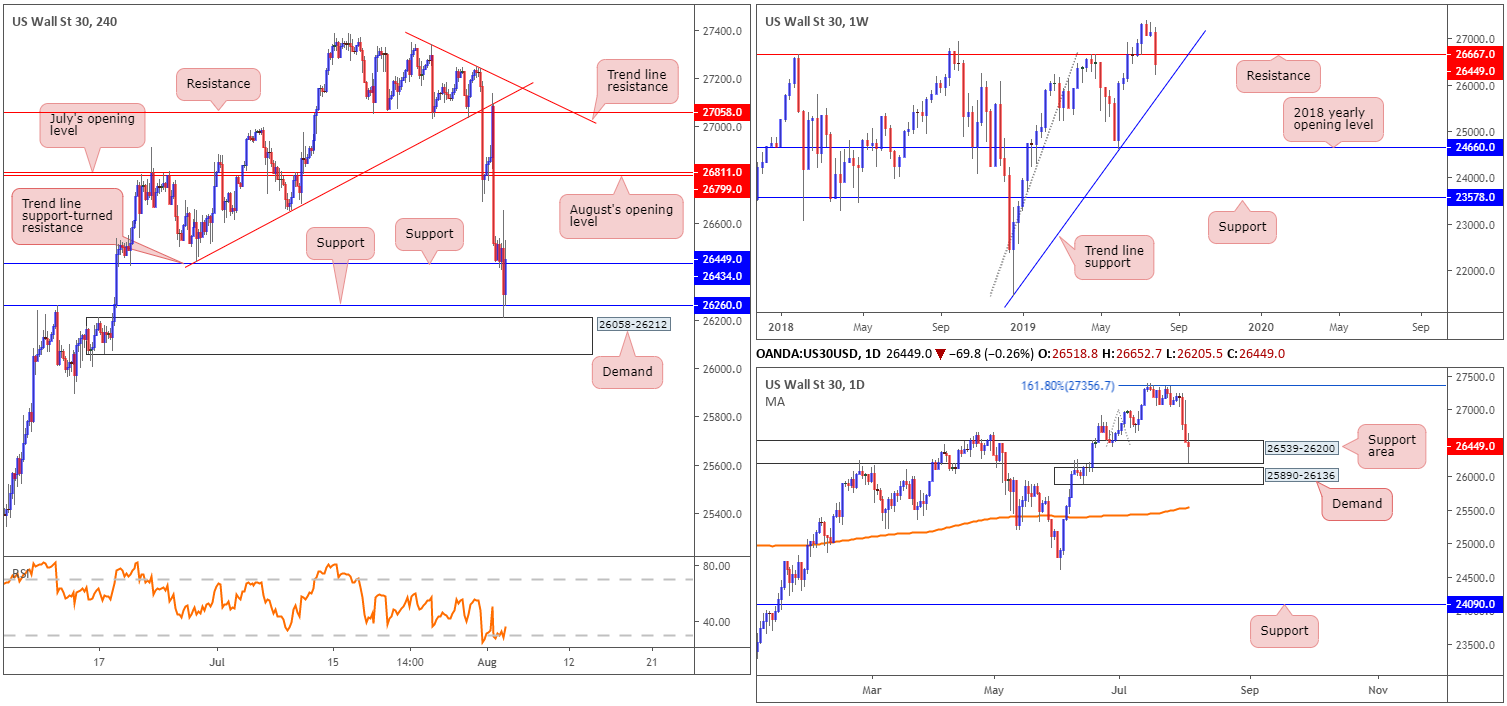
Dow Jones Industrial Average:
Weekly gain/loss: -2.53%
Weekly close: 26449
Weekly perspective:
The Dow Jones Industrial Average sunk last week, extending the pullback seen from all-time highs at 27388. Shedding more than 680 points and reclaiming support at 26667 (now acting resistance), continued selling from this point has a trend line support extended from the low 21452 to target this week.
Daily perspective:
With respect to daily activity, the unit recently entered the jaws of a support area coming in at 26539-26200. Concluding the week printing a reasonably attractive buying tail, we could see a recovery attempt play out from here today/early week. Assuming sellers remain in the driving seat, nevertheless, as the weekly timeframe suggests, demand at 25890-26136 will enter the mix, which happens to intersect with the weekly trend line support underscored above.
H4 perspective:
US stock markets ended lower Friday amid concerns regarding US President Donald Trump’s plans to tariff a further $300bn of Chinese goods, despite news the US labour market remains healthy. The Dow Jones Industrial Average erased 98.41 points, or 0.37%; the S&P 500 lost 21.51 points, or 0.73% and the Nasdaq declined 108.34 points, or 1.39%.
Viewing the Dow from the charts, the H4 candles surpassed two layers of support at 26449/26260 Friday and tested the top edge of demand coming in at 26058-26212. The day wrapped up with price marginally closing back above 26449. This could lead to further buying today/early week, targeting July and August’s opening levels at 26811 and 26799, respectively. It might also be worth noting the H4 RSI indicator rests around oversold terrain, and the current H4 demand zone is glued to the underside of the aforementioned daily support area as well as the top edge of the current daily demand zone.
Areas of consideration:
While many traders may look to buy this market above H4 support at 26449, weekly resistance at 26667 may hamper upside from here, despite H4 and daily price showing room to potentially move beyond this number. Therefore, irrespective of the direction one selects, opposing structure resides nearby and makes for a difficult market to trade today and possibly into the early stages of the week.
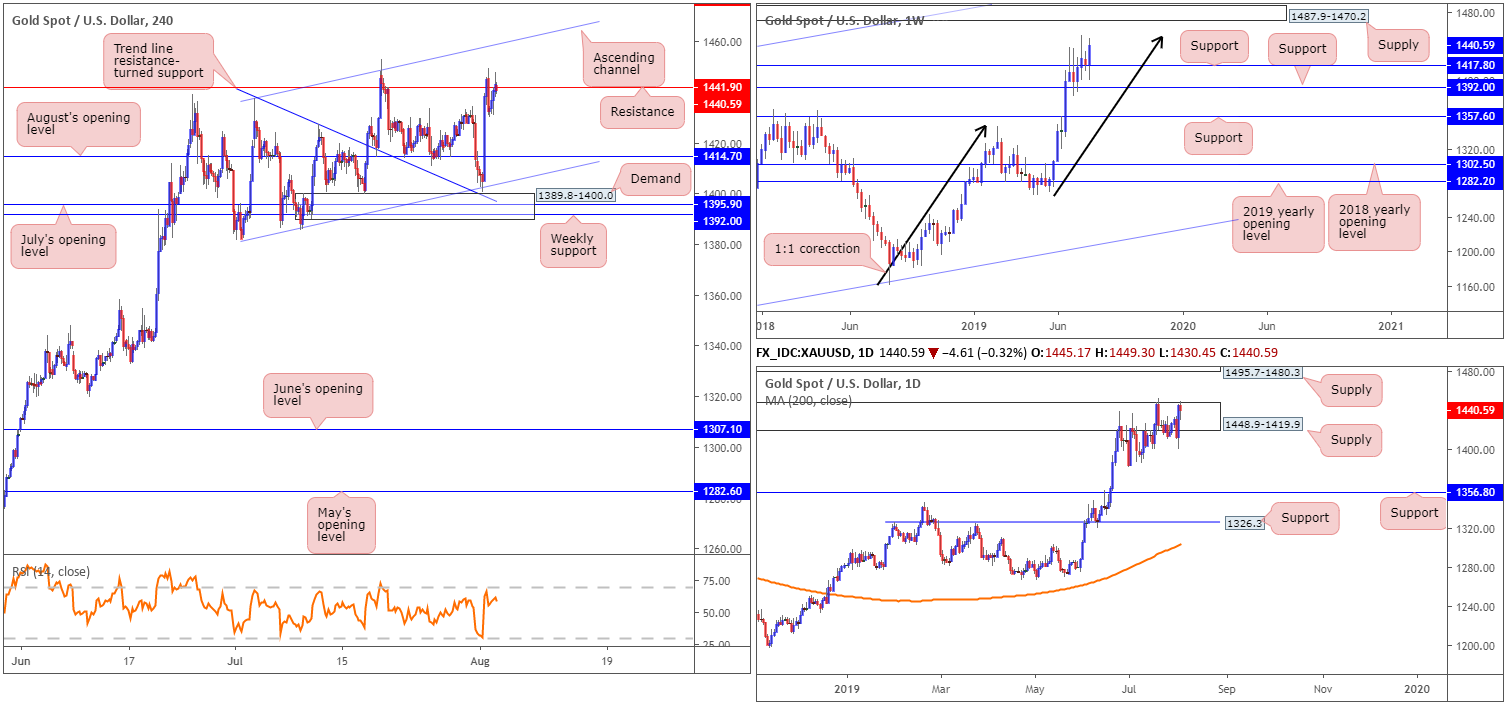
XAU/USD (GOLD):
Weekly gain/loss: +1.58%
Weekly close: 1440.5
Weekly perspective:
In terms of where we stand on the weekly timeframe, the research team notes weekly support at 1417.8 to be holding firm, though is still potentially hindered by resistance at a 1:1 correction (black arrows) around 1453.2 shaped from the 1160.3 August 13 low. Should further buying occur this week, traders may also want to acknowledge supply resting at 1487.9-1470.2, an area taken from April 2013.
Daily perspective:
Supply at 1448.9-1419.9 remains in motion, but emphasises a stressed tone having seen limited movement to the downside and the top edge engulfed on two separate occasions. With sellers likely fading within the current supply, a move to supply at 1495.7-1480.3 may be on the cards this week, an area that merges closely with the aforementioned weekly supply.
H4 perspective:
Bullion staged a notable recovery off channel support (extended from the low 1381.9) Thursday, as demand for safe-haven assets increased following US President Trump announcing intentions to raise tariffs on Chinese imports in September, triggering a market-wide risk off move. Friday, despite a USD selloff, saw the yellow metal struggle to make headway above resistance at 1441.9. However, the next upside target beyond here is channel resistance etched from the high 1437.7.
Areas of consideration:
Longer term, price action is likely to continue rallying until crossing swords with weekly supply at 1487.9-1470.2. Medium-term flow (H4), on the other hand, could stall at the current resistance drawn from 1441.9 and the noted channel resistance. Still, the reactions from these levels are likely to be feeble, with August’s opening level at 1414.7 set as a downside limit.
On account of the above, traders are urged to consider long positions above the current H4 resistance. A retest of the level as support is favoured, particularly if shaped in the form of a H4 bullish candlestick configuration (entry and risk levels can then be set according to its structure). The overall target is weekly supply at 1487.9-1470.2, though do expect some resistance off the H4 channel formation.
The accuracy, completeness and timeliness of the information contained on this site cannot be guaranteed. IC Markets does not warranty, guarantee or make any representations, or assume any liability regarding financial results based on the use of the information in the site.
News, views, opinions, recommendations and other information obtained from sources outside of www.icmarkets.com.au, used in this site are believed to be reliable, but we cannot guarantee their accuracy or completeness. All such information is subject to change at any time without notice. IC Markets assumes no responsibility for the content of any linked site.
The fact that such links may exist does not indicate approval or endorsement of any material contained on any linked site. IC Markets is not liable for any harm caused by the transmission, through accessing the services or information on this site, of a computer virus, or other computer code or programming device that might be used to access, delete, damage, disable, disrupt or otherwise impede in any manner, the operation of the site or of any user’s software, hardware, data or property.


