
Key risk events today:
China Manufacturing PMI; ECB President Lagarde Speaks; OPEC Meetings; Chicago PMI; US Pending Home Sales m/m
(Previous analysis as well as outside sources – italics).
EUR/USD:
Weekly gain/loss: +0.90%
Weekly close: 1.1962
Weekly perspective:
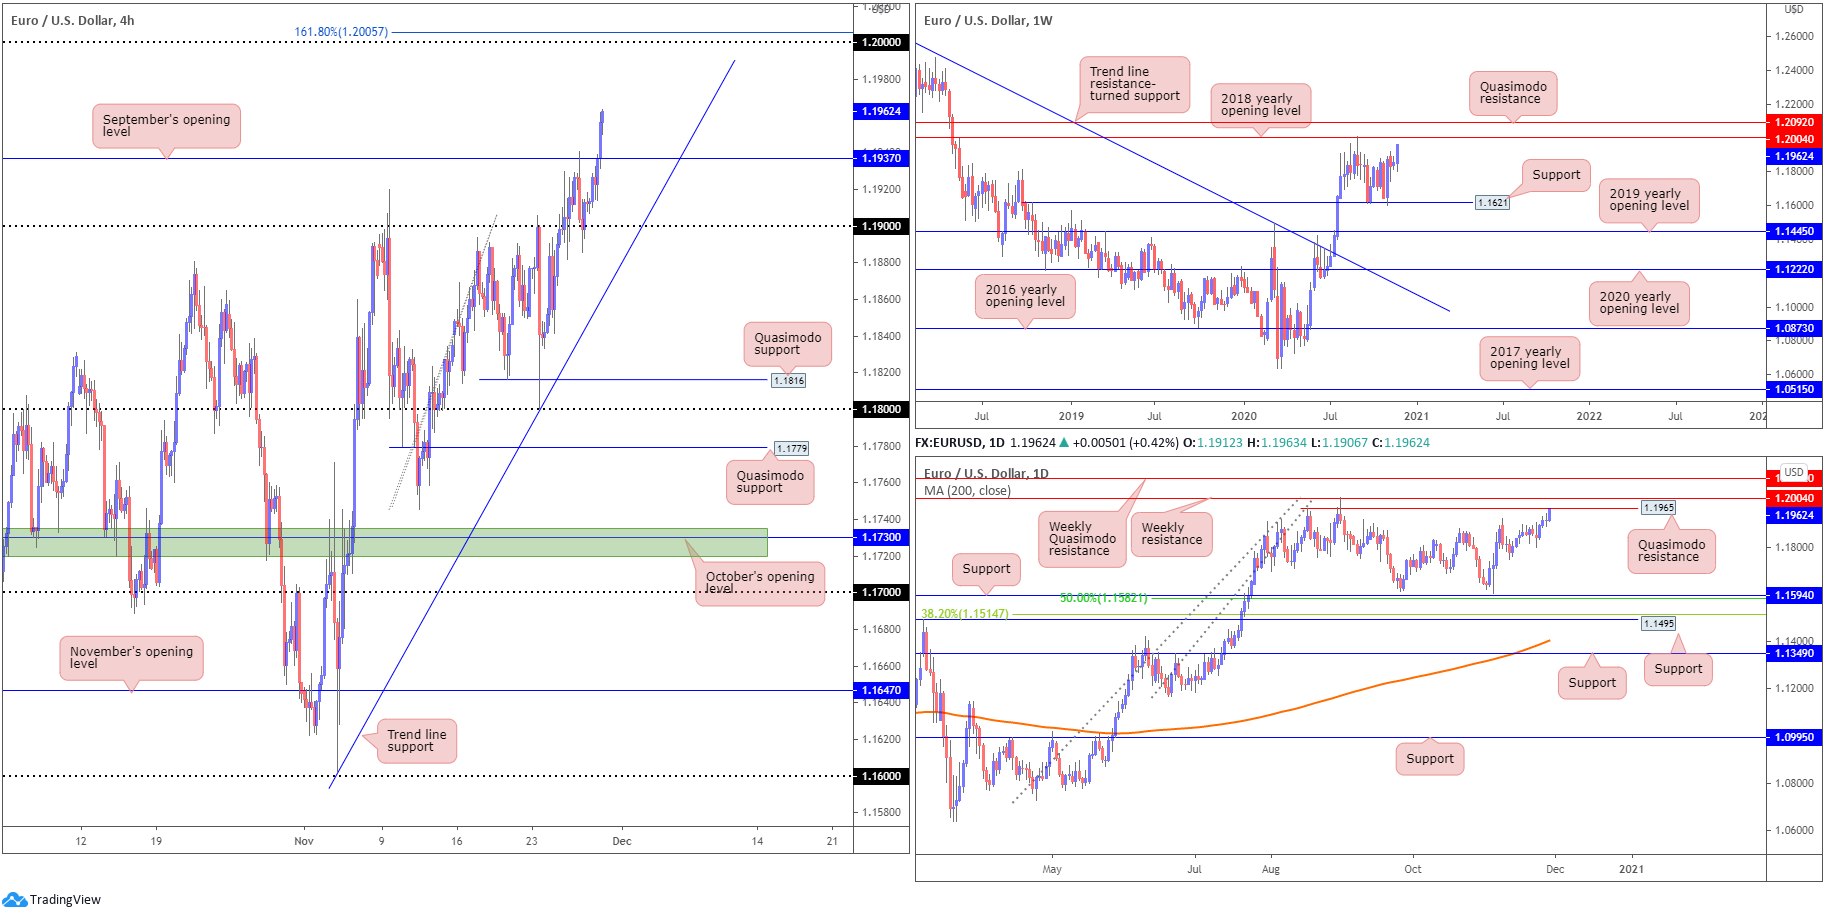
Buyers, as you can see, extended recovery gains north of support at 1.1621 over the course of last week, focused on shaking hands with the 2018 yearly opening value at 1.2004, closely shadowed by Quasimodo resistance priced at 1.2092.
Traders may also want to acknowledge July’s trend line resistance break, taken from the high 1.2555, in addition to violating the 1.1495 March 9 swing high, signalling long-term buyers could be making a stand.
Daily perspective:
Although potential for further upside is visible on the weekly scale, daily price concluded Friday at session highs within touching distance of Quasimodo resistance from 1.1965.
What’s also notable above the daily Quasimodo is weekly resistance at 1.2004 (2018 yearly opening value).
H4 perspective:
Deriving impetus from broad USD softness Friday – DXY absorbed 92.00 – EUR/USD progressed to a fresh monthly high at 1.1963.
Thursday’s late 1.19 retest also rocked the technical pendulum in favour of buying Friday, with enough force to ultimately overthrow September’s opening value priced in at 1.1937. Aside from daily Quasimodo resistance at 1.1965, the key figure 1.20 and a 161.8% Fibonacci projection point at 1.2005 is viewed as workable resistance targets this week.
Areas of consideration:
- September’s opening value on the H4 at 1.1937 signifies possible support. However, buyers from this region may want to acknowledge that although H4 and weekly charts are relatively free of resistance until 1.20, daily Quasimodo resistance at 1.1965 must be taken into account.
- Weekly resistance, in the shape of the 2018 yearly opening value, at 1.2004 joins closely with the key figure 1.20 on the H4, consequently representing sturdy resistance.
GBP/USD:
Weekly gain/loss: +0.17%
Weekly close: 1.3305
Weekly perspective:
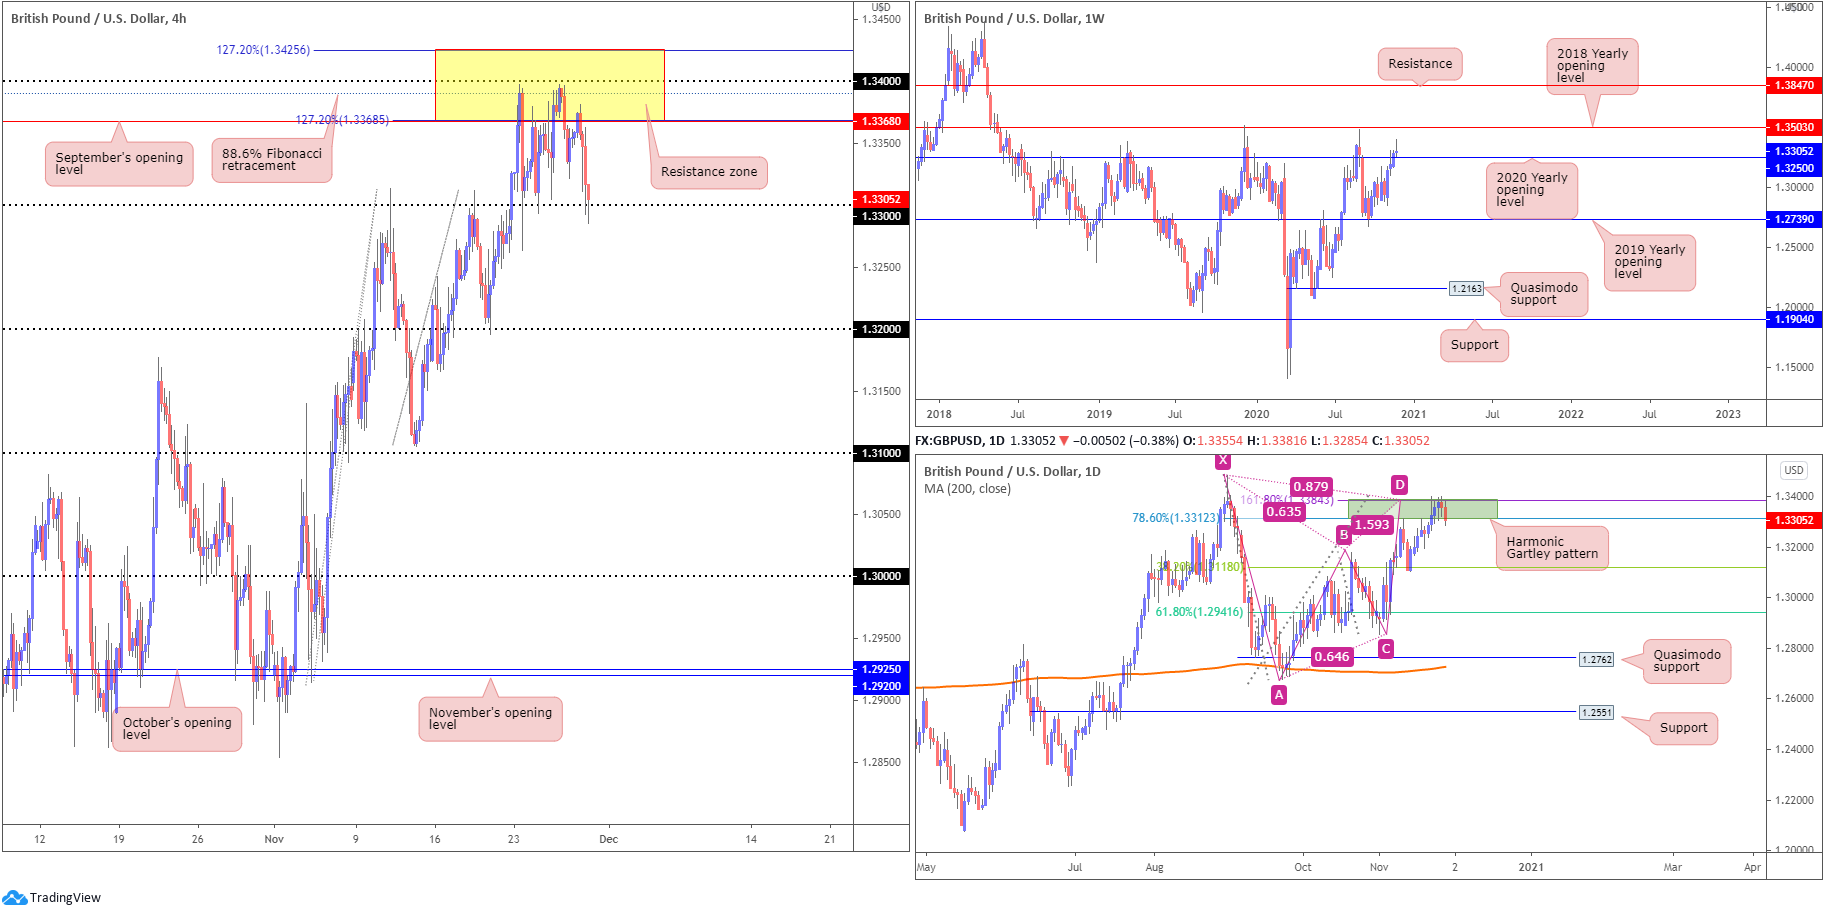
After rejecting the 2019 yearly opening value from 1.2739 in September, buyers eventually mustered enough strength to take on the 2020 yearly opening value at 1.3250 and shine some light on the 2018 yearly opening value at 1.3503 in recent weeks. However, buying ran its course last week, finishing the session considerably off best levels and generating a shooting star candlestick pattern.
Candlestick enthusiasts are likely to be cautious selling the shooting star, knowing 1.3250 could serve as support this week. Nevertheless, the immediate trend has remained lower since topping in 2014.
Daily perspective:
Traders, once again, welcomed the bearish harmonic Gartley pattern’s PRZ at 1.3384/1.3312 last week and until Friday was on the verge of giving way.
The 38.2% Fibonacci retracement ratio at 1.3118 is lying in wait (arranged from legs A-D of the Gartley).
Overthrowing the aforementioned PRZ could be viewed as an early cue we’re headed for the 2018 yearly opening value at 1.3503 on the weekly scale.
H4 perspective:
Familiar resistance (yellow) at 1.3425/1.3368 (made up of two 127.2% Fibonacci projection points at 1.3425/1.3368, the round number 1.34, an 88.6% Fibonacci retracement ratio at 1.3390 and September’s opening value at 1.3368) proved stubborn last week, in particular the 88.6% Fibonacci retracement ratio. Yet, equally tenacious of late has been the 1.33 handle, serving well as resistance in early November and as support last week.
Should sellers work through 1.33 bids this week, 1.3250 support on the weekly chart is in sight followed by the 1.32 handle.
Areas of consideration:
- H4 sellers making an appearance from resistance at 3425/1.3368, and daily sellers not giving up the bearish harmonic Gartley pattern’s PRZ at 1.3384/1.3312 without a fight, signals a breakout below 1.33 on the H4. Conservative sellers, however, may seek a retest at 1.33 (as resistance) before committing, targeting weekly support at 1.3250 as an initial take-profit zone.
AUD/USD:
Weekly gain/loss: +1.02%
Weekly close: 0.7376
Weekly perspective:
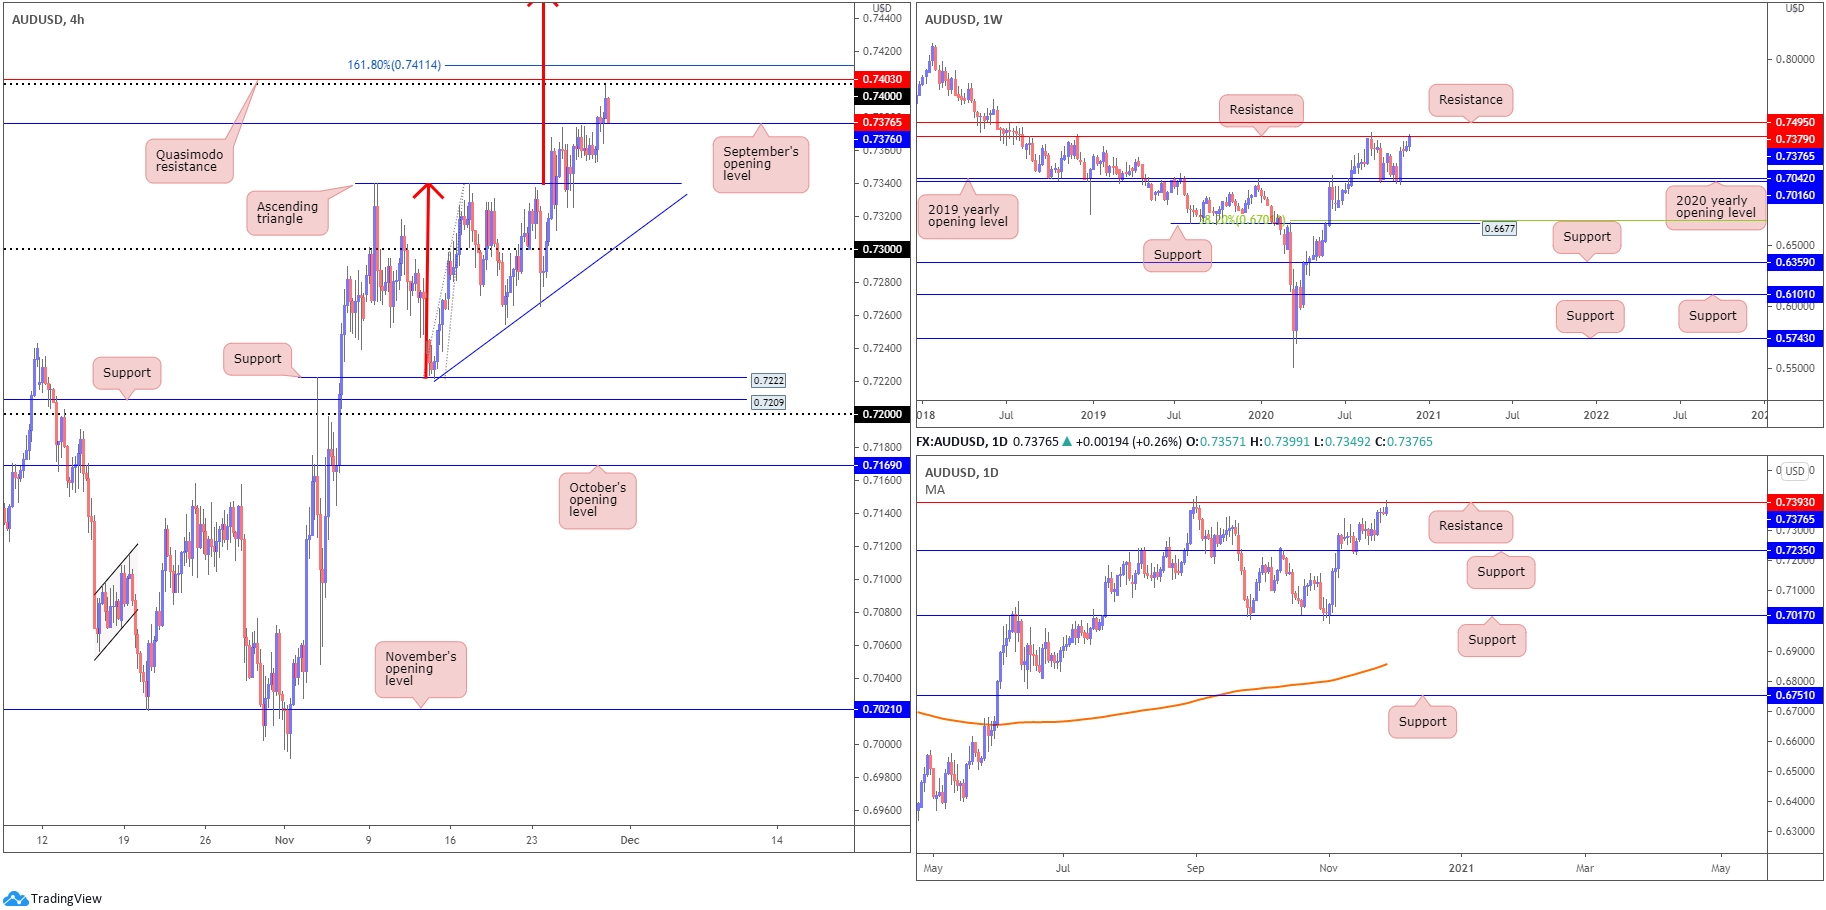
Buyers, based on the weekly timeframe, are seen extending the 3% showing formed early November off the 2020 (0.7016) and 2019 (0.7042) yearly opening values (supports) to connect with resistance at 0.7379.
In view of this market trending higher since early 2020, buyers may also be eyeballing resistance parked at 0.7495 this week.
Daily perspective:
Following a November 13 retest of support at 0.7235, buyers eventually found some grip and crossed swords with resistance at 0.7393 on Friday (positioned above weekly resistance). This represents a level that has capped upside since December 2018. Clearance of this base fuels the prospect of a rally to weekly resistance mentioned above at 0.7495.
H4 perspective:
Recent action breached the top side of a H4 ascending triangle pattern (0.7340).
This forecasts a target of around 0.7544 (red arrows), implying a continuation move north of September’s opening value at 0.7376 and removal of the 0.74 handle, as well as Quasimodo resistance at 0.7403 and the 161.8% Fibonacci projection point at 0.7411.
Areas of consideration:
- Breakout buyers above the H4 ascending triangle have an ultimate target of 0.7544, though could have problems with resistances nearby (see below).
- Retesting September’s opening value at 0.7376 (H4) may be a setup buyers welcome.
- Weekly resistance at 0.7379 and daily resistance at 0.7393 form an area to be mindful of. Directly above, 74 on the H4, along with Quasimodo resistance at 0.7403 and a 161.8% Fibonacci projection point at 0.7411, is also an area to be aware of.
USD/JPY:
Weekly gain/loss: +0.21%
Weekly close: 104.04
Weekly perspective:
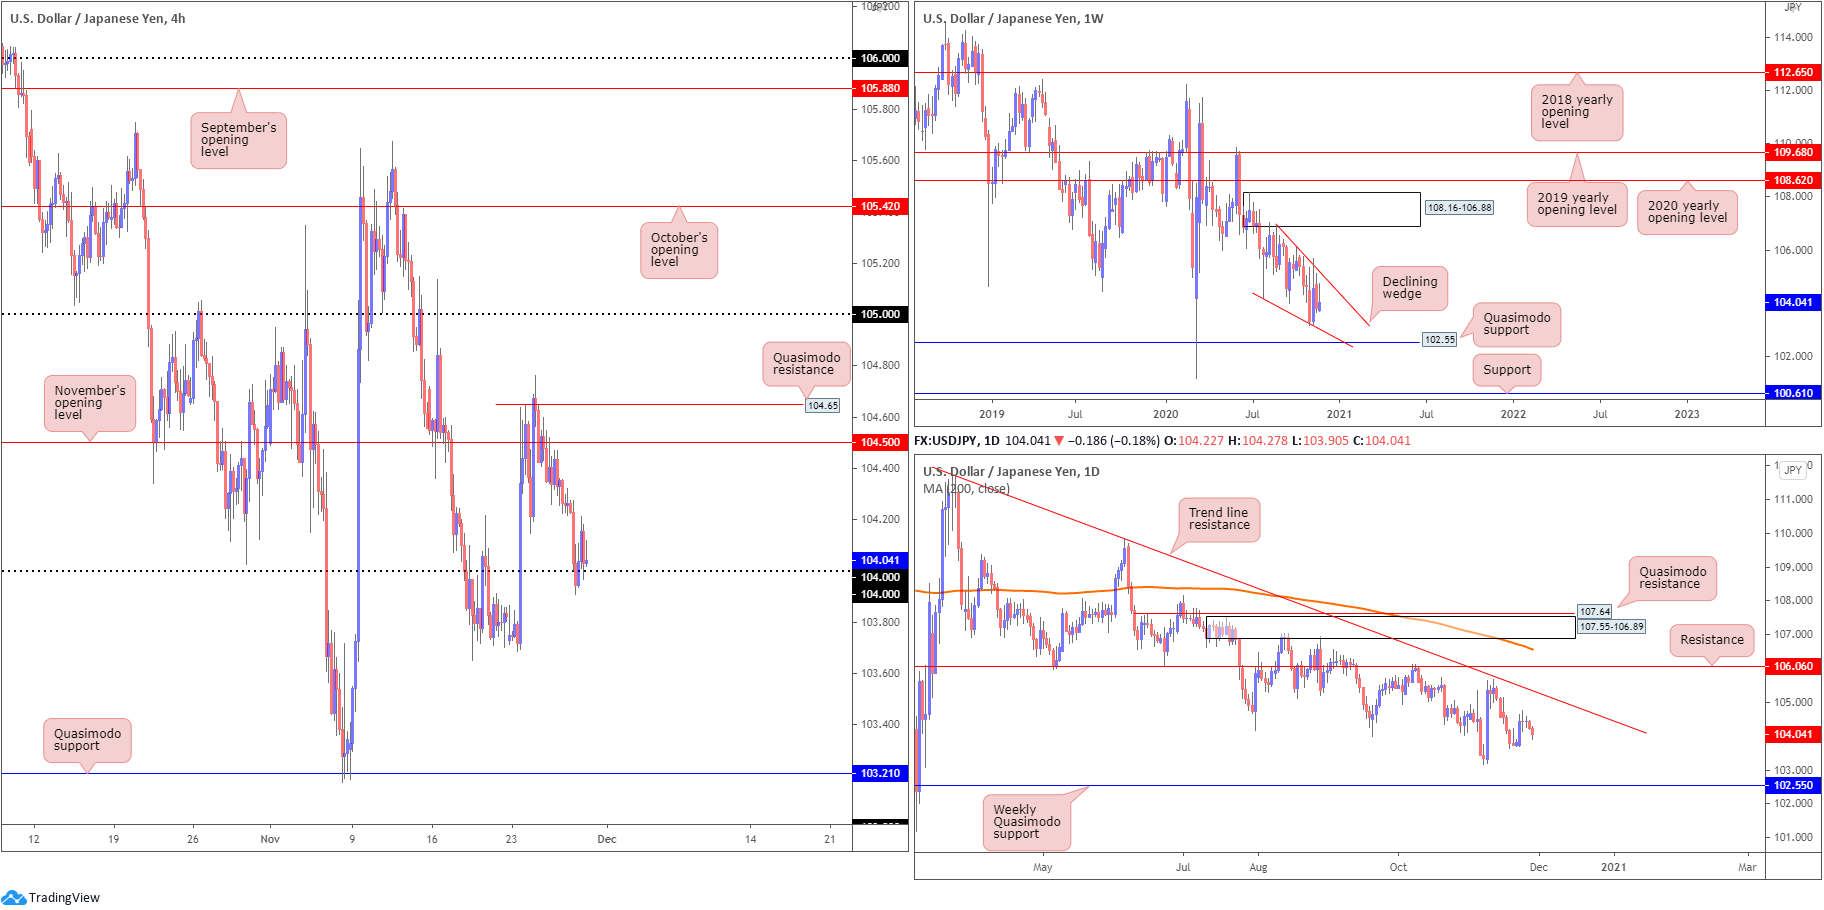
Since connecting with the underside of supply at 108.16-106.88 in August, price has gradually shifted lower and developed a declining wedge (106.94/104.18).
Quasimodo support at 102.55 is in the picture this week, with a break revealing support plotted at 100.61. A strong bounce from 102.55 may provide enough impetus for buyers to attempt a breakout above the current declining wedge.
Daily perspective:
The technical landscape from the daily timeframe reveals scope to close in on trend line resistance, extended from the high 111.71.
Sellers taking over this week, though, could lead price to the 103.17 November 6 low, followed by the noted weekly Quasimodo support at 102.55.
H4 perspective:
Despite a recovery attempt off 104 Friday, USD/JPY remained depressed amidst broad USD softness and waning US Treasury yields.
Clearing 104 exposes 103.70 lows and Quasimodo support at 103.21, whereas more of a decisive 104 rejection could draw November’s opening value at 104.50 back into the fight (fixed just under Quasimodo resistance at 104.65).
Areas of consideration:
- Price is currently working with limited higher timeframe support, suggesting focus will be on the 104 handle early week (H4). Moving beneath the round number could spark an intraday bearish theme at least until 103.70ish.
- H4 Quasimodo resistance at 104.65 and November’s opening value at 104.50 offers an area of possible resistance to work with this week.
USD/CAD:
Weekly gain/loss: -0.78%
Weekly close: 1.2989
Weekly perspective:
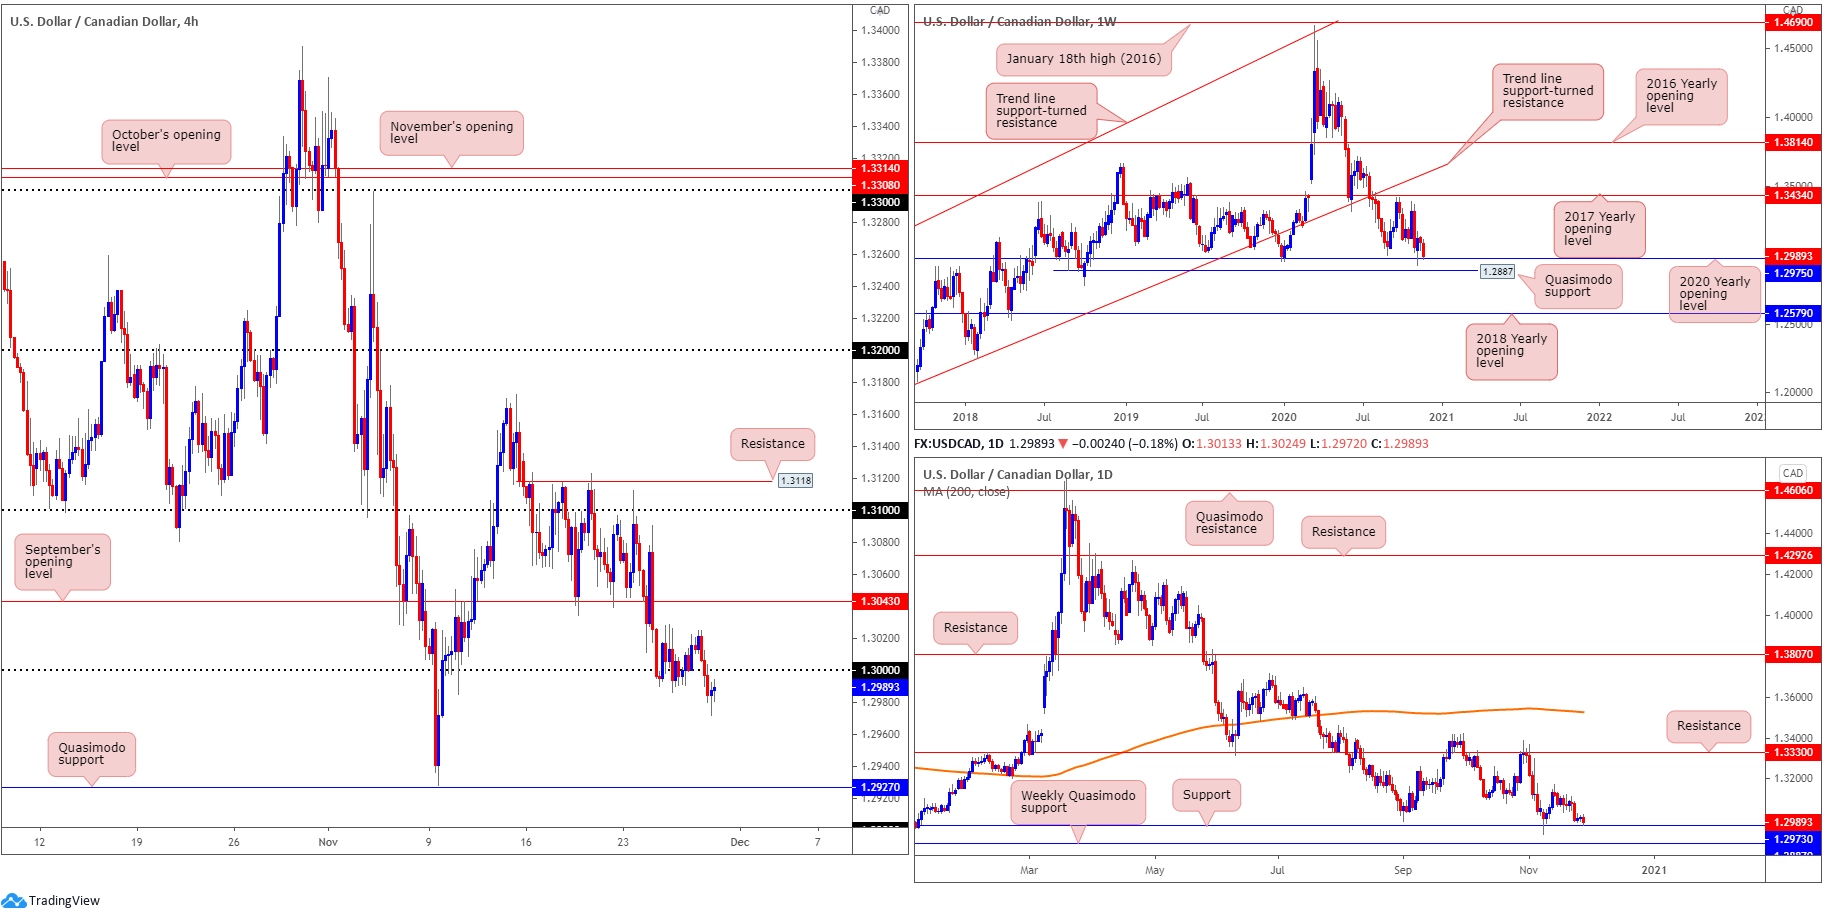
The 2020 yearly opening value at 1.2975, arranged north of Quasimodo support priced in at 1.2887, captured attention last week after USD/CAD erased more than 100 pips and closed around session lows.
Breaking 1.2975 remains an option this week. Not only did the 1.2975 bullish rejection in early November fail to attract follow-through interest, this market has traded lower since topping at 1.4667 in early 2020. So, while buyers could still make an appearance, technical evidence favours a dip to Quasimodo support at 1.2887, according to chart structure.
Daily perspective:
With weekly price channelling into support at 1.2975, as well as daily price also recently joining support at 1.2973 (essentially marking the same area), an approach to the 1.3172 November 13 peak is possible.
Lack of bids off 1.2973, on the other hand, shines the spotlight on weekly Quasimodo support mentioned above at 1.2887.
H4 perspective:
Squeezed lower amidst USD softness and WTI holding above $45.00 a barrel (tends to benefit the Canadian dollar), Friday overpowered 1.30 bids and perhaps cleared the stream south until Quasimodo support coming in at 1.2927.
Making it as far south as 1.2927, nonetheless, could prove challenging due to weekly and daily support around 1.2975.
Areas of consideration:
- With 1.30 taken, and buyers modestly making a show off weekly/daily supports at 1.2975ish (see H4 reaction), this indicates a possible fakeout scenario. The reaction off higher timeframe supports, fuelled on sell-stop liquidity (from under 1.30), may see buyers close back above 1.30, a move possibly attracting additional buyers back to September’s opening value at 1.3043 (H4).
- If 1.2975 fails to drive activity to the upside, bearish scenarios could form towards H4 Quasimodo support at 1.2927.
USD/CHF:
Weekly gain/loss: -0.72%
Weekly close: 0.9043
Weekly perspective:
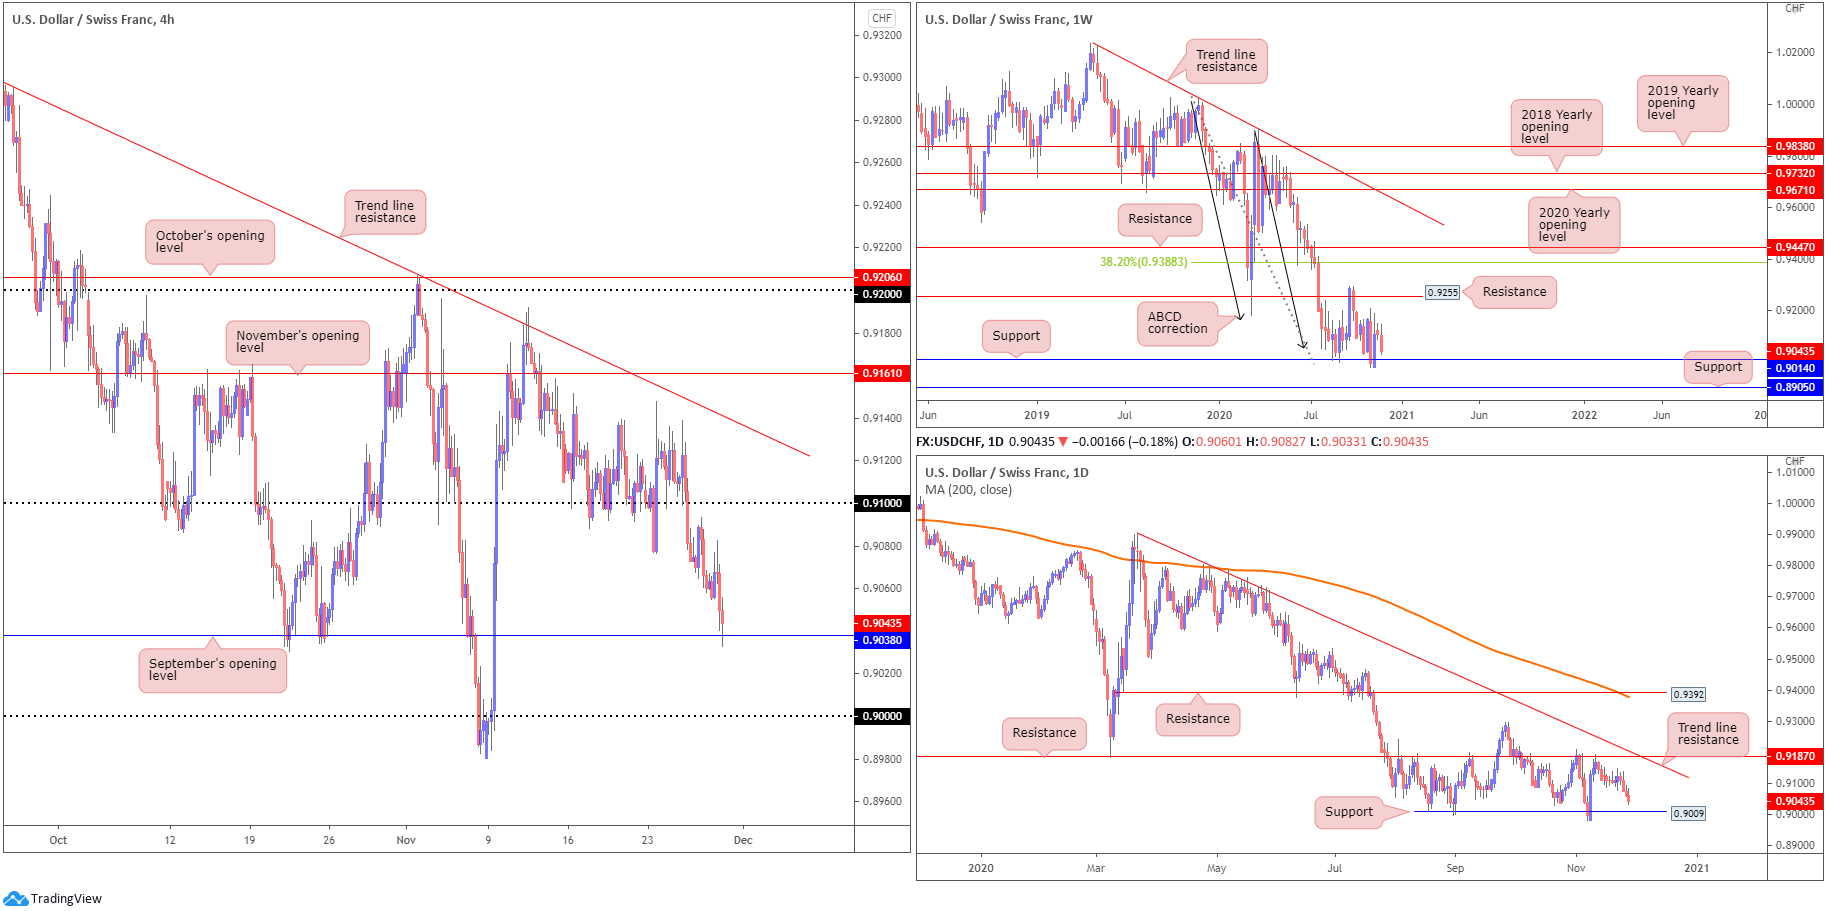
Leaving 0.9255 resistance (a prior Quasimodo support) unchallenged, weekly price is seen making its way back towards support at 0.9014 (dovetailing closely with ABCD support at 0.9051 [black arrows]). Clearance of 0.9014 exposes support at 0.8905.
It should also be noted this market has been trending lower since April 2019.
Daily perspective:
From the daily timeframe, price action also exhibits scope to navigate lower. Following a test of resistance at 0.9187 earlier in November, Quasimodo support at 0.9009 represents a possible downside objective (located a few pips south of weekly support at 0.9014).
It’s also worth acknowledging trend line resistance resides reasonably close by, taken from the high 0.9901.
H4 perspective:
After strong-arming through 0.91 on Wednesday, Thursday and Friday extended losses following a failed attempt to retest the underside of 0.91.
As can be seen from the chart, recent selling has the candles testing September’s opening value at 0.9038, with a break possibly bringing the key figure 0.90 to light this week.
Areas of consideration:
- September’s opening value at 0.9038 is support worthy of attention, though do note it boasts limited higher timeframe confluence. Bearish themes may emerge if the level breaks down, targeting the 0.90 region.
- 90 is likely watched support, a level merging closely with weekly support at 0.9014 and daily Quasimodo support coming in at 0.9009.
Dow Jones Industrial Average:
Weekly gain/loss: +2.42%
Weekly close: 29,940
Weekly perspective:
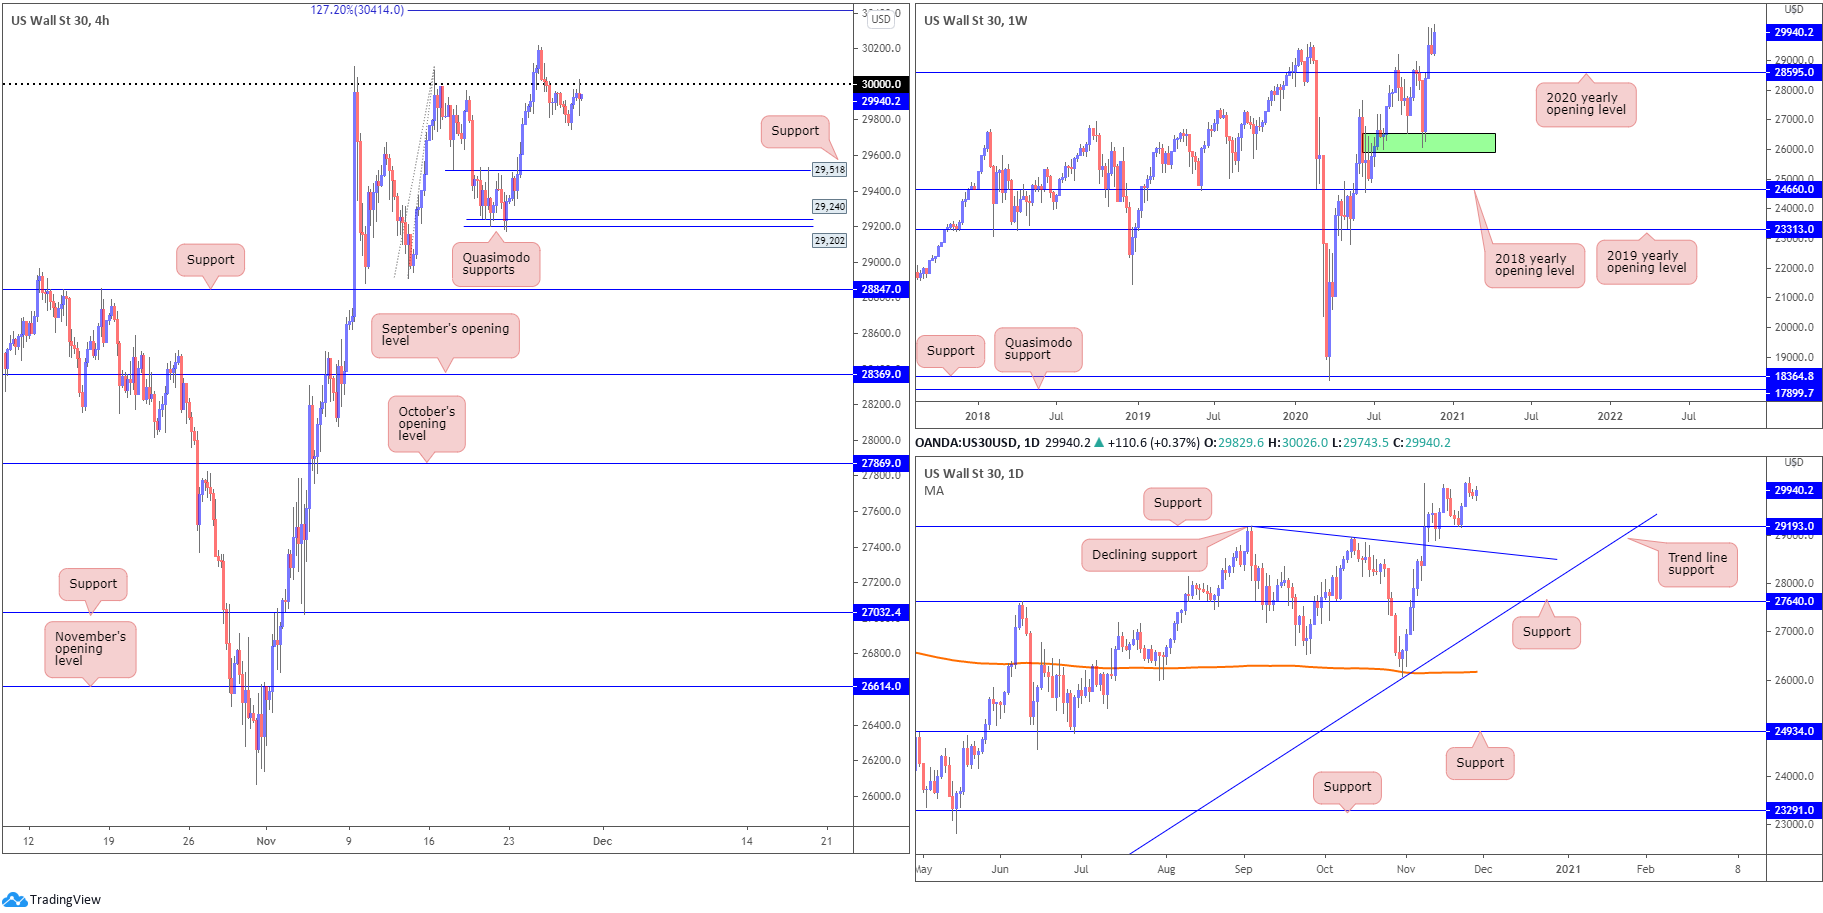
Overlooking the prior week’s shooting star candlestick pattern, buyers stepped forward last week and moved to fresh all-time peaks at 30,217, finishing marginally off session highs.
Should a correction materialise, retesting the 2020 yearly opening value from 28595 could be an area dip-buyers find interest in this week.
Daily perspective:
According to the daily timeframe, support is seen at 29,193, positioned above a declining support, taken from the high 29,193.
H4 perspective:
US equities modestly recovered Friday, snapping a two-day bearish phase on the Dow.
The Dow Jones Industrial Average advanced 37.90 points, or 0.13%; the S&P 500 traded higher by 8.70 points, or 0.24% and the Nasdaq finished higher by 111.44 points, or 0.92%.
The widely watched 30,000 figure was, as you can see, retested as resistance heading into the close Friday, though sellers offered a somewhat non-committal tone. Above the figure, all-time highs rest at 30,217, followed by the 127.2% Fibonacci projection point at 30,414. To the downside, support is seen at 29,518, with a break revealing Quasimodo supports at 29,202 and 29,240.
Areas of consideration:
- For many, this will be a difficult unit to sell from 30,000, having recently witnessed fresh all-time highs.
- Dip-buyers are likely watching H4 support at 29,518 and the two H4 Quasimodo supports at 29,202 and 29,240.
- Crossing back above 30,000, on the other hand, could ignite breakout strategies.
XAU/USD (GOLD):
Weekly gain/loss: -4.49%
Weekly close: $1,786
Weekly perspective:
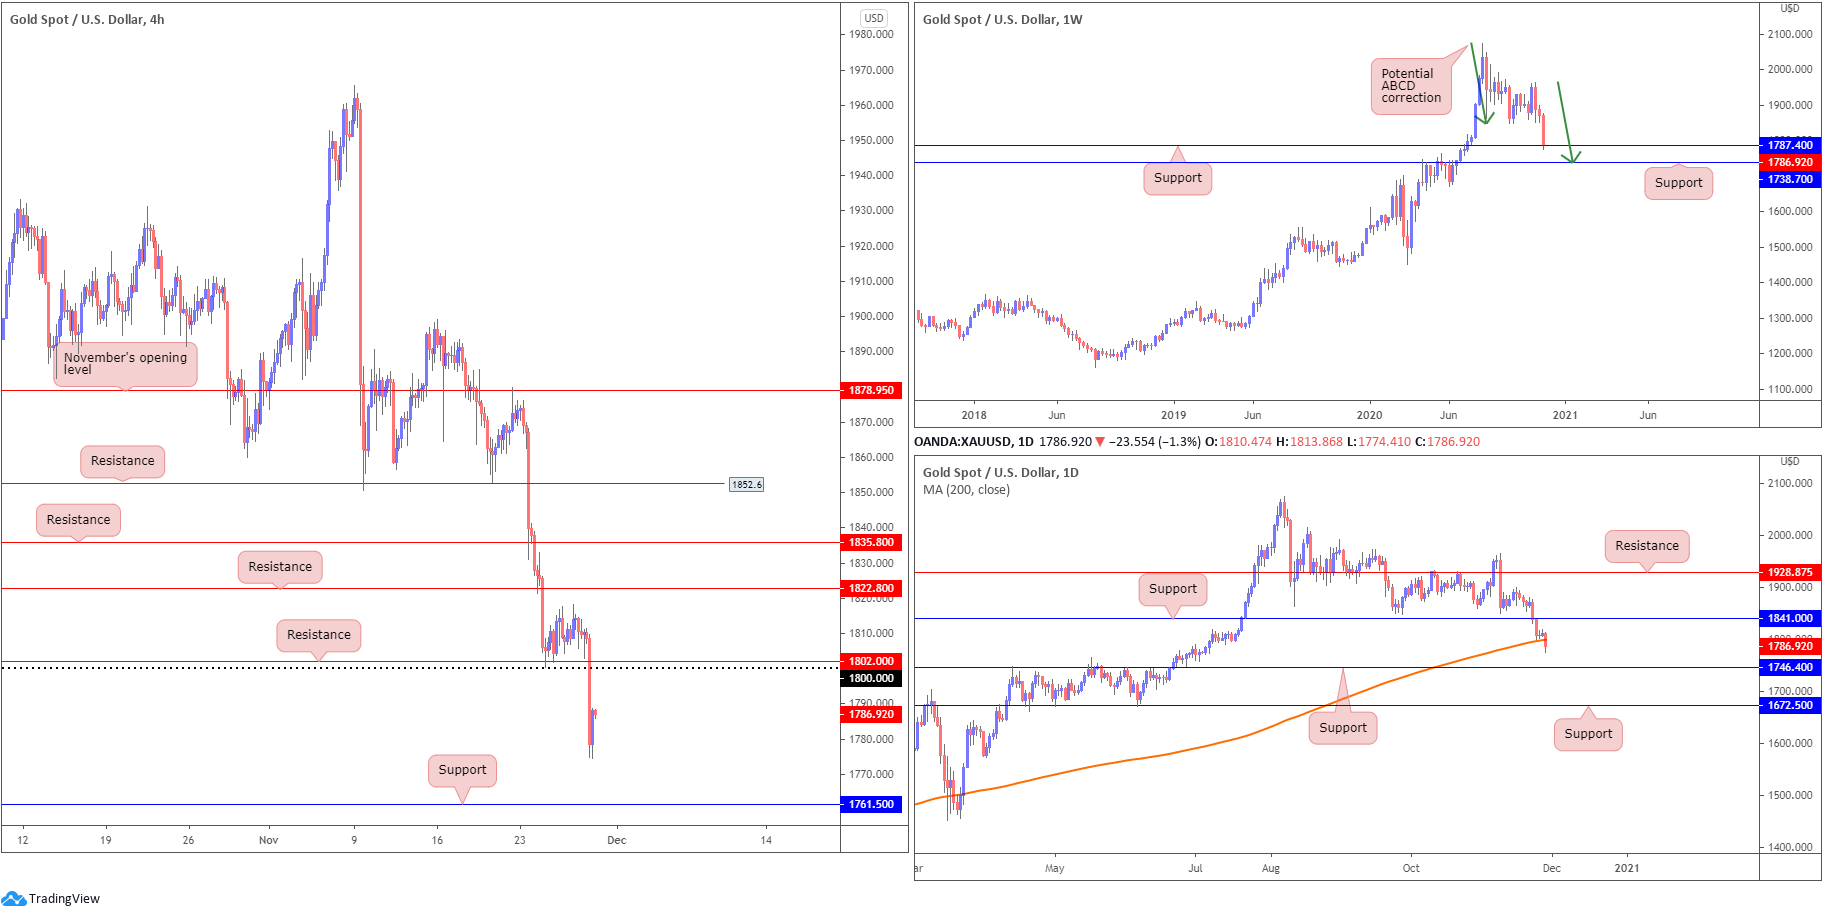
Erasing more than $80 last week, gold staged a decisive decline into support drawn from $1,787.
Another interesting feature to be aware of on the weekly chart this week is a potential ABCD correction (green arrows) that terminates around another layer of support at $1,738.
Daily perspective:
Despite the possibility of buying arising off weekly support at $1,787 this week, daily flow crossed under the widely watched 200-day SMA (orange – $1,799) Friday. Among technical analysts, price breaking below a 200-day SMA represents a bearish cue, which in this case could send the yellow metal towards support priced in at $1,746.
H4 perspective:
Friday sunk to lows at $1,774, with no clear drivers behind the move.
$1,800 and Quasimodo support at $1,802 (now possible resistance) ceded ground, throwing $1,761 into the mix as possible support to be conscious of this week.
The modest recovery into the close, however, likely bolstered amid profit taking and weekly bids off support mentioned above at $1,787, could force a retest of $1,800 early week.
Areas of consideration:
- $1,800 and H4 resistance at $1,802, together with the 200-day SMA at $1,799, shapes relatively healthy resistance.
- Weekly support at $1,787, given it’s a higher timeframe level, warrants attention.
- Weekly support at $1,738 is another noteworthy horizontal base, perhaps gathering additional interest on the back of the ABCD correction.
The accuracy, completeness and timeliness of the information contained on this site cannot be guaranteed. IC Markets does not warranty, guarantee or make any representations, or assume any liability regarding financial results based on the use of the information in the site.
News, views, opinions, recommendations and other information obtained from sources outside of www.icmarkets.com.au, used in this site are believed to be reliable, but we cannot guarantee their accuracy or completeness. All such information is subject to change at any time without notice. IC Markets assumes no responsibility for the content of any linked site.
The fact that such links may exist does not indicate approval or endorsement of any material contained on any linked site. IC Markets is not liable for any harm caused by the transmission, through accessing the services or information on this site, of a computer virus, or other computer code or programming device that might be used to access, delete, damage, disable, disrupt or otherwise impede in any manner, the operation of the site or of any user’s software, hardware, data or property


