
Key risk events today:
Limited.
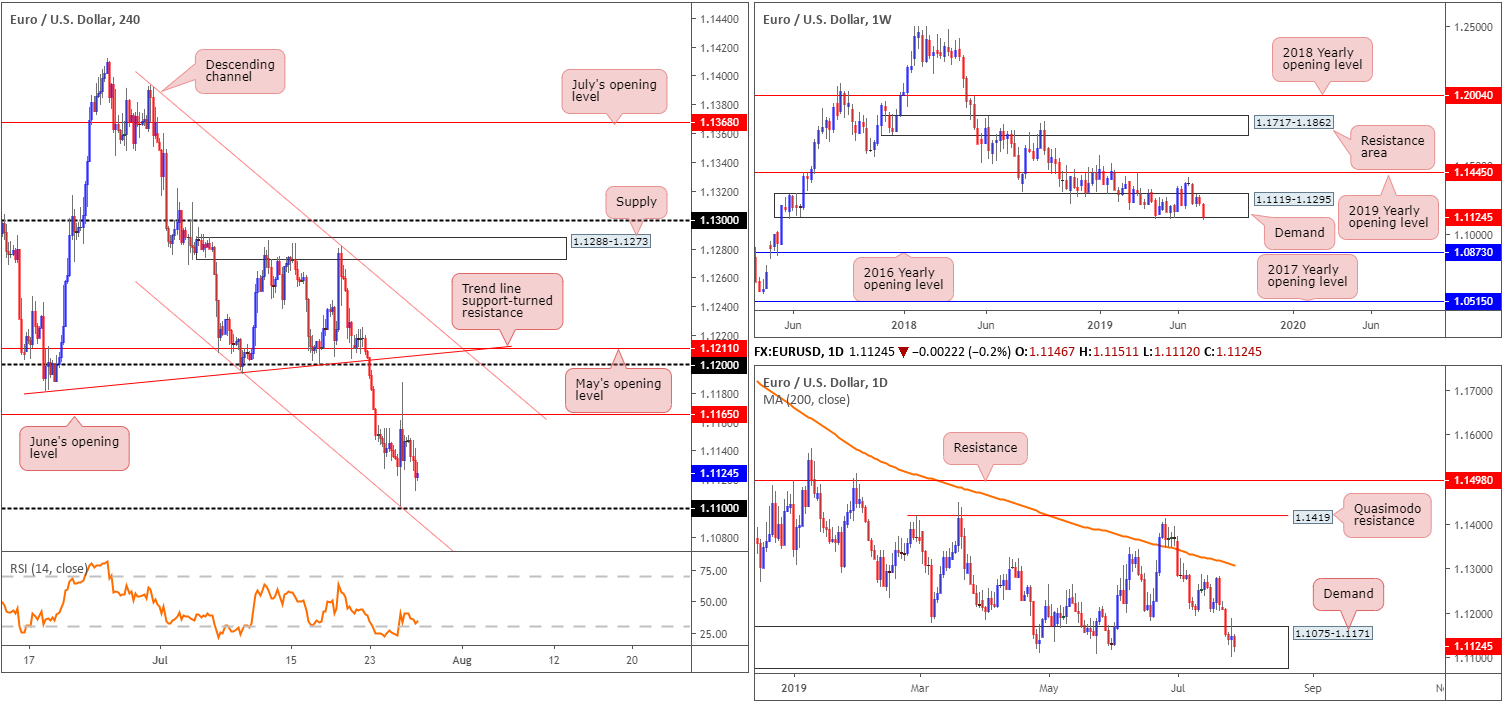
EUR/USD:
Weekly gain/loss: -0.85%
Weekly close: 1.1124
Weekly perspective:
Over the course of the week, Europe’s single currency ceded further ground to the dollar, down more than 90 points. Clocking fresh 2019 lows of 1.1101 and marginally surpassing the lower edge of long-standing demand at 1.1119-1.1295 by way of a near-full-bodied bearish candle certainly places a somewhat bearish cloud over this market now.
It’d be unwise to rule out the possibility of fresh upside attempts, however, as the break of demand was unlikely enough to trigger major sell stops. In the event further selling is observed, though, the 2016 yearly opening level at 1.0873 (support) is next in the firing range.
Daily perspective:
A closer reading of price action on the daily timeframe reveals the unit is treading water within the walls of demand at 1.1075-1.1171, an area seen hugging the underside of the current weekly demand zone. Thursday fashioned a clear-cut indecision candle in response to European Central Bank (ECB) policymakers opting to stand pat on rates Thursday and tweaking its forward guidance. Friday continued to explore lower ground, though remained within the parapets of Thursday’s range.
Further downside this week may entail engulfing the current daily demand zone and making a run for demand at 1.0860-1.0954 (not seen on the screen).
H4 perspective:
Friday witnessed the H4 candles extend losses on the back of better-than-expected US GDP data with advance figures seeing the economy expanding at an annualised 2.1% vs. 1.8% forecasted. Technically speaking, this positions the unit within striking distance of the 1.11 handle this week. A break below this psychological mark and the H4 channel support (taken from the low 1.1207) could spell another hit for the single currency as limited support is visible until shaking hands with key figure 1.10, closely followed by daily demand at 1.0860-1.0954 (see above).
Areas of consideration:
Early trade this week may witness a fakeout through 1.11 (tripping stop-loss orders) to H4 channel support (1.1207). Assuming this plays out and we close back above 1.11, short-term buying opportunities could be on offer.
Another possibility is a break of the 1.11 handle and the H4 channel support, given weekly buyers are likely fearful around the lower edge of demand at 1.1119-1.1295 and daily price demonstrating little in terms of upside presence within demand at 1.1075-1.1171. For that reason, shorting opportunities beyond the said H4 structures are also an option this week, preferably as a retest play, targeting 1.10 as the initial target.
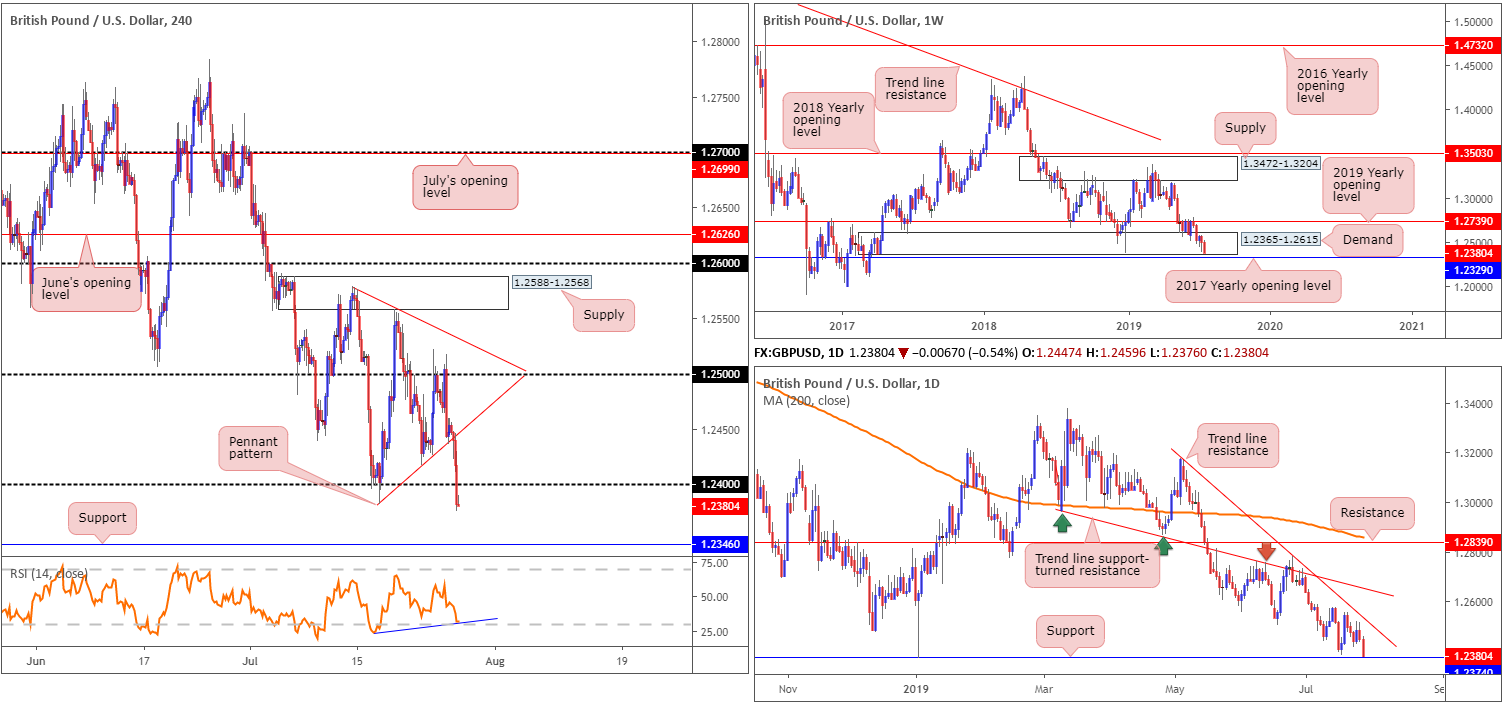
GBP/USD:
Weekly gain/loss: -0.94%
Weekly close: 1.2380
Weekly perspective:
Since retesting the underside of the 2019 yearly opening level at 1.2739 in May, the British pound has been grinding lower against its US counterpart, gradually tunnelling through bids residing within long-standing demand at 1.2365-1.2615.
Down more than 115 points on the week and with the lower edge of the said demand in sight, is this market looking to bring in buyers from nearby support at 1.2329: the 2017 yearly opening level?
Daily perspective:
According to daily structure, we concluded the week closing a handful of points just north of notable support coming in at 1.2374. This is certainly not a barrier one should overlook, having seen it serve well as support and resistance in the past and hold price higher at the beginning of the year in the form of a strong hammer pattern. Could this be the last line of defence for buyers within the current weekly demand?
H4 perspective:
Sterling decisively plunged through orders at 1.24 Friday, unlocking the possibility of further selling towards support seen at 1.2346. Despite the break lower, indicator-based traders may want to acknowledge the RSI displaying positive divergence nearby its oversold value.
Breakout sellers likely loaded up upon engulfing 1.24, though daily support at 1.2374 could throw a spanner in the works here. In fact, a H4 bullish close back above 1.24 from the said daily support may be a strong buy signal as we’re effectively still within weekly demand at the moment. The sell stops below 1.24 would serve well as liquidity to buy into.
Areas of consideration:
As daily support drawn from 1.2374 is inches from entering the fight, selling below 1.24, despite Friday’s selloff, is chancy according to the technical studies presented here. Ultimately, the research team are looking for buyers to emerge off the noted daily support and for the H4 candles to close back above 1.24. Entry on the close of the candle with protective stop-loss orders located beyond its tail could be an option here, targeting the underside of the recently broken H4 pennant pattern (taken from the low 1.2382) as an initial take-profit zone.
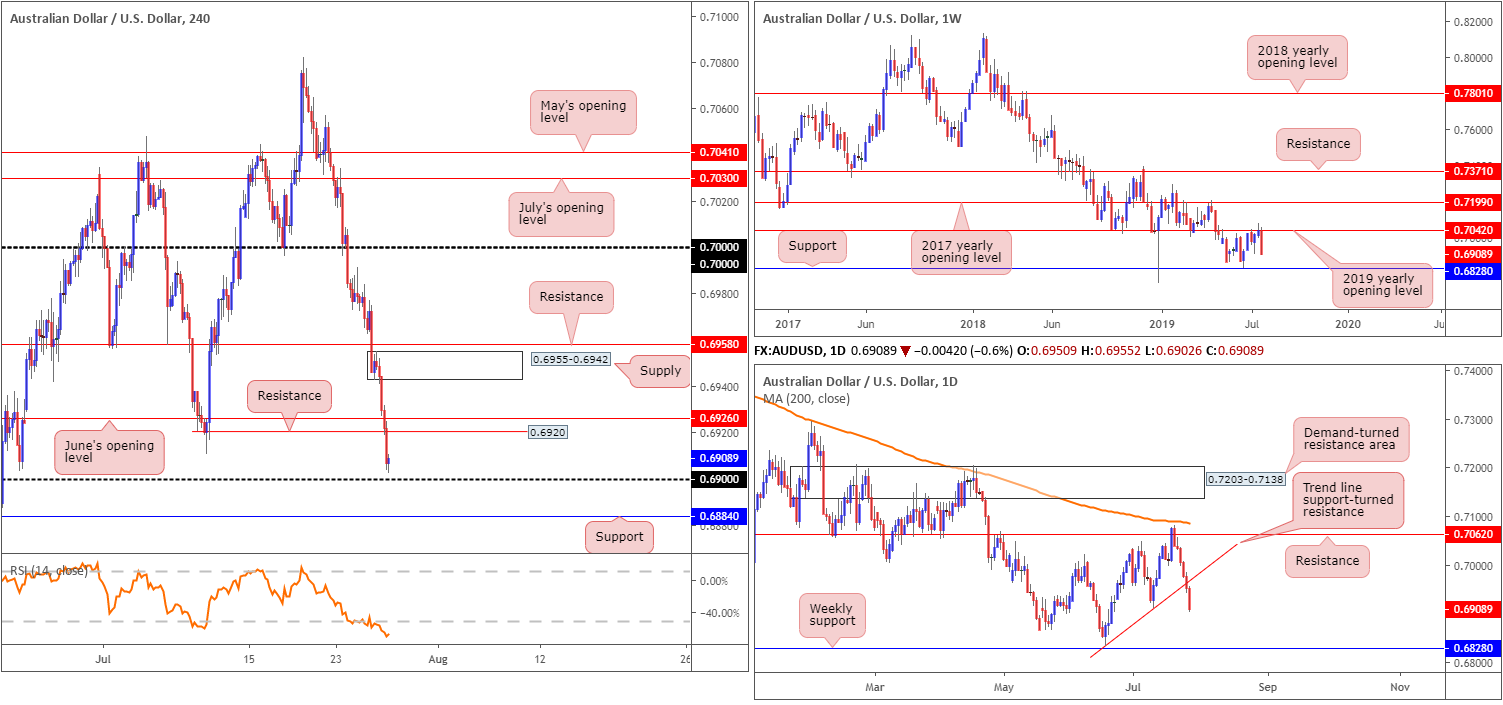
AUD/USD:
Weekly gain/loss: -1.84%
Weekly close: 0.6908
Weekly perspective:
Starved of support, the commodity-linked currency decisively rotated lower against the US dollar last week from the 2019 yearly opening level (resistance) at 0.7042. Serving well as support on several occasions in the past and holding price action lower early July, recent selling from 0.7042 should not be a surprise. The next support target can be seen at 0.6828, which is likely to enter the mix sometime this week.
Daily perspective:
In conjunction with weekly structure, daily movement crossed beneath trend line support (extended from the low 0.6831) Thursday and generated further selling Friday, both days communicating strength in the shape of near-full-bodied bearish candles.
With the 0.6910 July 10 low engulfed, limited support is visible until crossing paths with weekly support underscored above at 0.6828.
H4 perspective:
A brief recap of Friday’s movement on the H4 timeframe shows the pair remained heavily offered and refreshed two-week lows amid upbeat US GDP data. Overthrowing both June’s opening level at 0.6926 and Quasimodo support at 0.6920 (now serving as resistance), the unit settled just north of the 0.69 handle into the close. Beyond 0.69, the research team notes nearby support lurking around the 0.6884 neighbourhood, while below here support is not visible until reaching the weekly level underscored above at 0.6828.
Areas of consideration:
Entering long from either the 0.69 handle or the H4 support at 0.6884 is a chancy move, owing to both weekly and daily structure stressing a strong bearish tone at the moment. In this case, it might be more favourable to wait and see if the H4 candles close below 0.6884 for a possible short towards weekly support at 0.6828. Here, traders have the choice of selling the breakout candle or conservatively waiting and seeing if the unit retests 0.6884 as resistance before pulling the trigger (entry and risk can then be determined according to the rejecting candle’s structure).
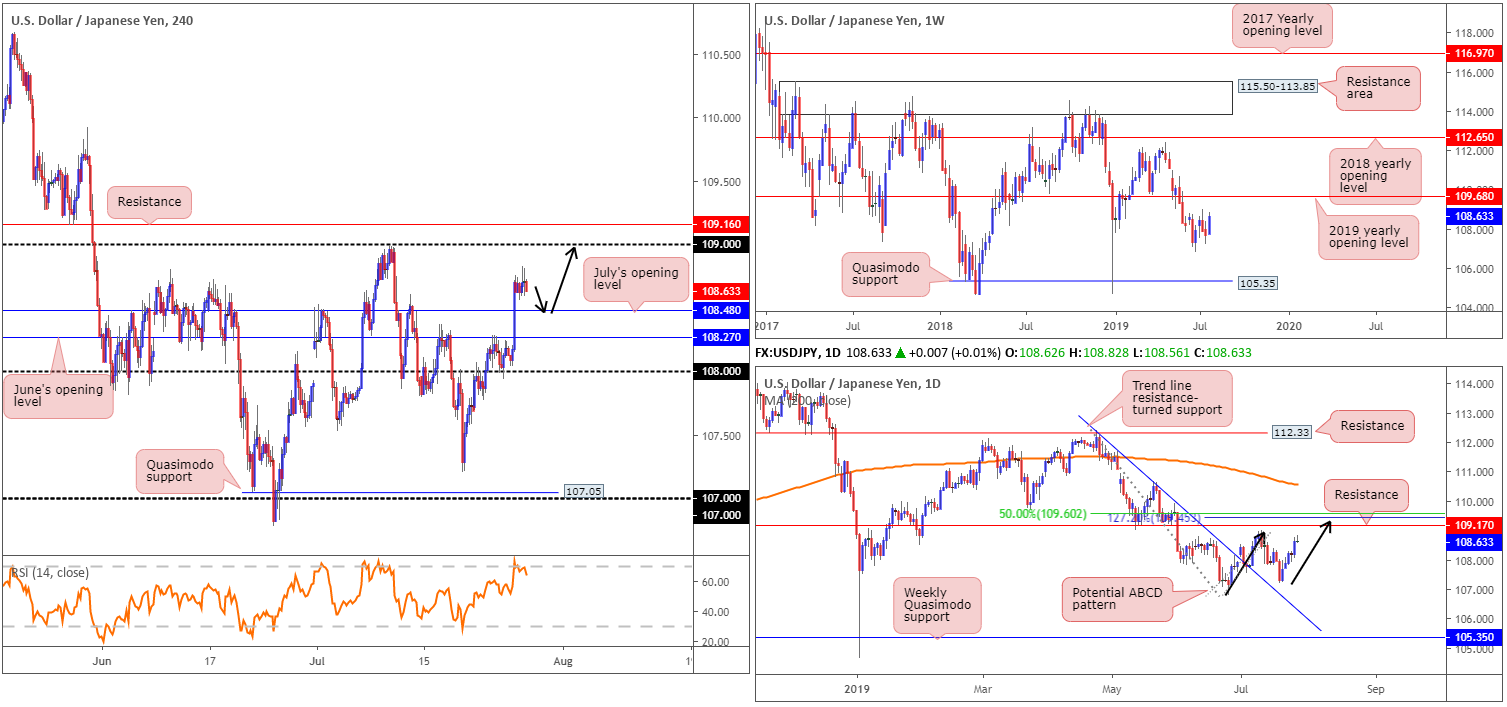
USD/JPY:
Weekly gain/loss: +0.88%
Weekly close: 108.63
Weekly perspective:
Breaking a two-week bearish phase, USD/JPY bulls entered an offensive setting last week, adding nearly 100 points. In terms of technical structure, the 2019 yearly opening level at 109.68 is a viable resistance this week – that is assuming we break through the 108.99 July 8 high. To the downside, the 106.78 June 24 low offers possible support, though beyond here the unit exhibits space to run as far south as Quasimodo support at 105.35.
Daily perspective:
Daily price houses resistance at 109.17, which comes together with a nearby 127.2% ABCD (black arrows) bearish formation at 109.45 and a 50.0% retracement value at 109.60. This, alongside the 2019 yearly opening level at 109.68 on the weekly timeframe, forms a reasonably tight area of resistance to focus on between 109.17/109.68.
H4 perspective:
Despite upbeat GDP data out of the US, Friday’s action soured and ranged no more than 30 points. In light of this lacklustre performance much of the following will echo similar thoughts aired in Friday’s report:
Recent movement witnessed the pair dethrone June’s opening level at 108.27 as well as July’s opening level at 108.48, perhaps unbolting the door for a move towards the 109 handle, closely shadowed by resistance at 109.16.
Areas of consideration:
Higher-timeframe structure on the USD/JPY displays room to rally to at least daily resistance at 109.17, which, as we already know, forms the lower edge of a resistance zone at 109.68/109.17.
On account of this, long opportunities exist above 108.48 on the H4, targeting 109/109.16. A retest of 108.48 as support is likely welcomed confirmation as per the black arrows (entry and risk can be determined according to the rejecting candlestick’s structure).
Upon connecting with 109.16, the H4 resistance level, traders are urged to close any long positions and consider selling. The H4 resistance, coupled with the daily resistance zone at 109.68/109.17, provides a strong ceiling in which to short.
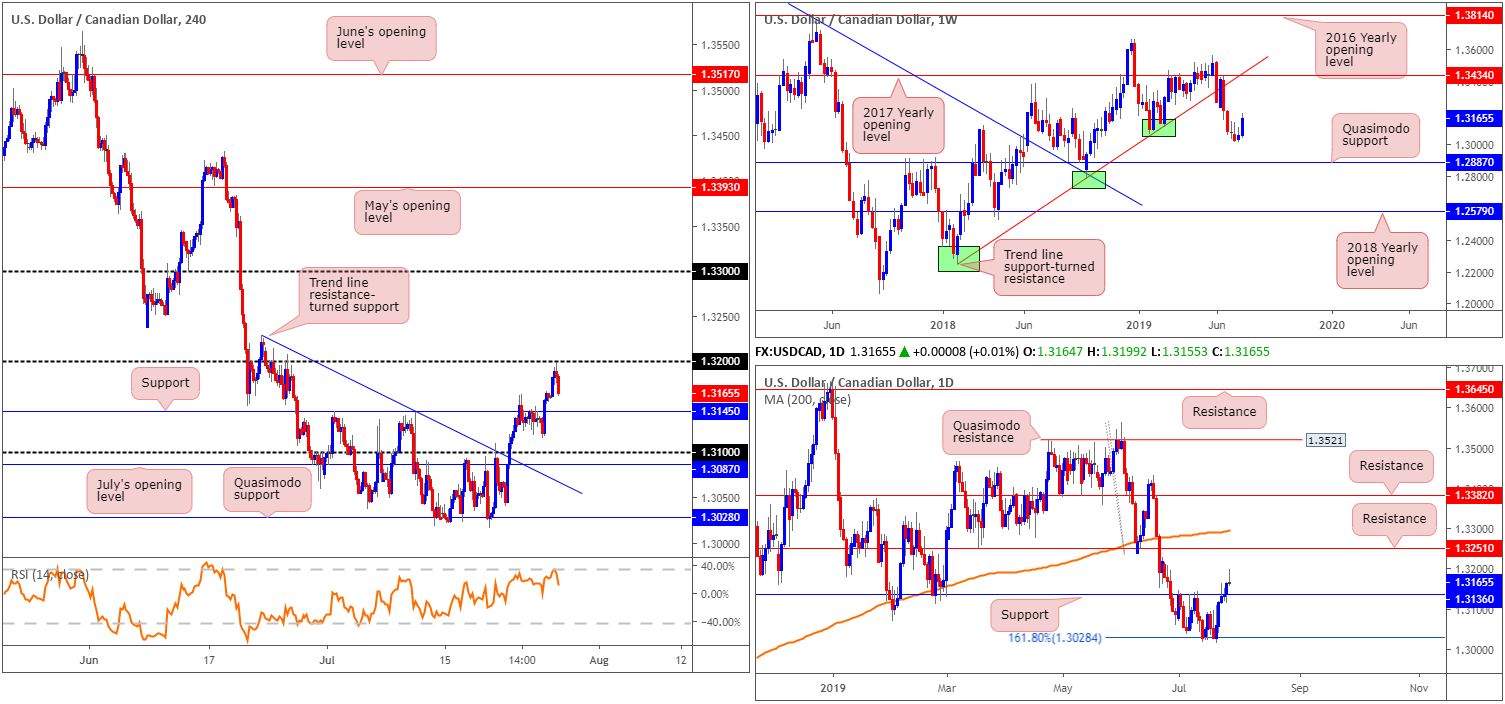
USD/CAD:
Weekly gain/loss: +0.82%
Weekly close: 1.3165
Weekly perspective:
Since coming into close contact with the 2017 yearly opening level at 1.3434 mid-June, selling has been at the forefront of this market. Despite the prior week’s minor bullish candle and limited support in sight until a Quasimodo formation at 1.2887, however, strong buying emerged last week. Continued buying from this point has the 2017 yearly opening level to target, closely shadowed by trend line support-turned resistance etched from the low 1.2247.
Daily perspective:
The 161.8% Fibonacci ext. point at 1.3028, as you can see, held firm in recent weeks, leading to a move above resistance at 1.3136 forming (now acting support). As a result of this, focus has shifted to resistance coming in at 1.3251, closely trailed by the 200-day SMA (orange – currently circulating around the 1.3293 level).
H4 perspective:
Although Friday’s movement concluded unchanged, the market attempted to extend weekly gains above support at 1.3145, though failed to sustain an upside presence just south of 1.32, consequently forming a shooting star formation on the daily timeframe.
Viable support this week, therefore, falls in around the 1.3145 region, which happens to be positioned just north of daily support at 1.3136. Beneath here we have the 1.31 handle, closely followed by July’s opening level at 1.3087.
Areas of consideration:
While Friday’s daily candle formed a shooting star formation, considered a bearish signal, the odds of a response being seen out of 1.3136/1.3145 (H4 and daily supports) is high given both weekly and daily timeframes show room to advance north this week.
On account of the above, should the market produce a H1 or H4 bullish candlestick formation from 1.3136/1.3145, this could be considered a buy signal (entry and risk set according to the candle’s structure), targeting 1.32 as the initial port of resistance.
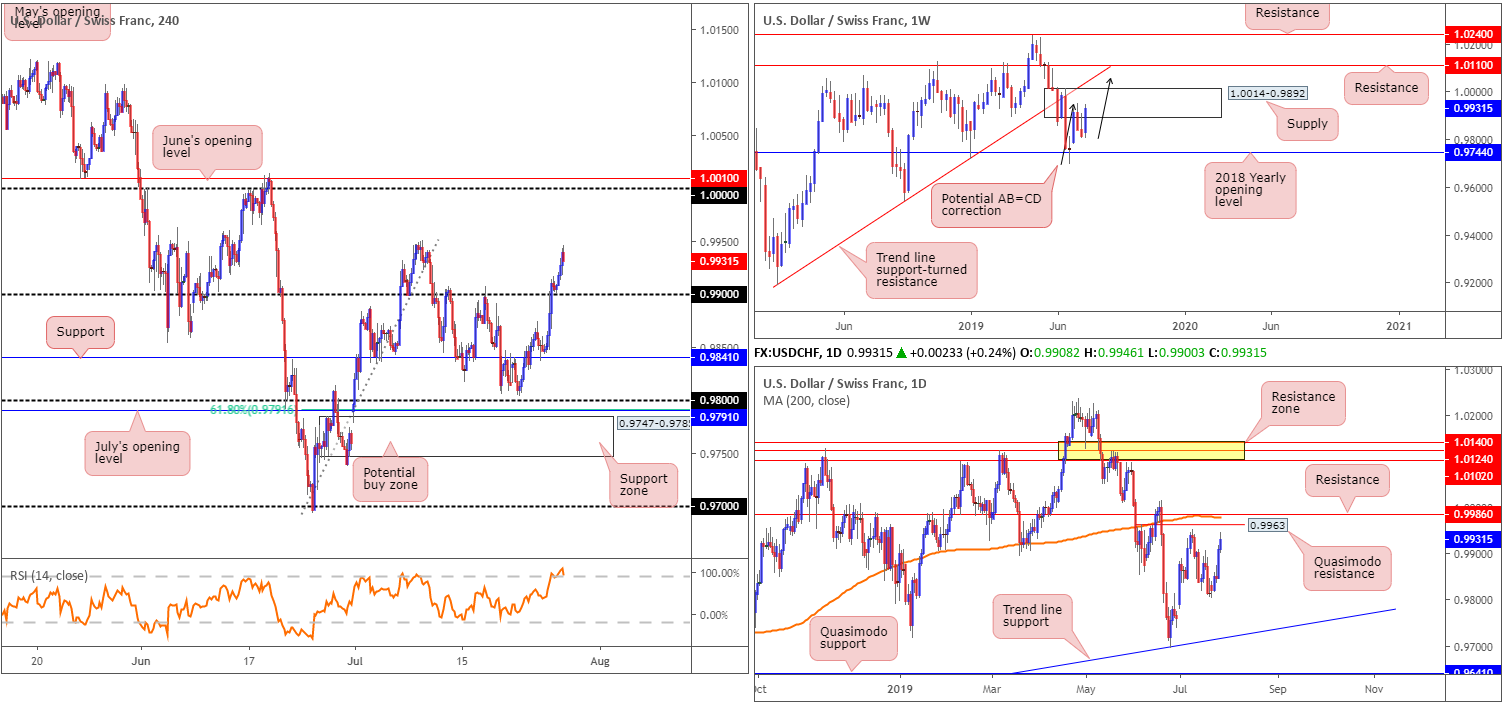
USD/CHF:
Weekly gain/loss: +1.19%
Weekly close: 0.9931
Weekly perspective:
Despite price action engaging with the lower limits of supply at 1.0014-0.9892, the unit so far meets the characteristics of a potential AB=CD correction (black arrows) above the area, which happens to align with trend line support-turned resistance taken from the low 0.9187. This is certainly a pattern worth watching this week as a break above the aforementioned supply will trigger buy stops and thus provide liquidity to sell into from the AB=CD completion at trend line resistance.
Daily perspective:
Before weekly price completes its AB=CD pattern, we cannot rule out the possibility of resistance entering the mix on the daily timeframe beforehand. Just north of current price, the research team notes a Quasimodo resistance at 0.9963, closely followed by resistance at 0.9986 and the 200-day SMA (orange). An engulf of these barriers will likely be enough to prompt buying towards the weekly trend line resistance and associated AB=CD completion, as highlighted above.
H4 perspective:
For those who read Friday’s briefing you may recall the piece underlined a possible buying opportunity:
A retest, preferably formed by way of a H4 or H1 bullish candlestick configuration, at 0.99 on the H4 timeframe is in focus this morning. Entry and risk can be determined according to the candlestick’s rules of engagement.
As is evident from the chart, price came within a few pipettes of retesting 0.99 before advancing north Friday. Although a bullish candlestick signal was not seen, the bullish rotation was clearly enough to encourage buying. Well done to any of our readers who managed to jump aboard this move. Although the July 9 high at 0.9951 may hold price action lower, the more logical upside resistance falls in around the daily resistance zone between 0.9986/0.9963.
Areas of consideration:
Traders still long this market should have already reduced risk to at least breakeven and taken a portion of the position off the table. As stated above, the next upside target can be found between 0.9986/0.9963, though there is a strong possibility we may also follow through to complete the weekly AB=CD formation this week. Therefore, it is worth trailing some of the position according to the technical studies.
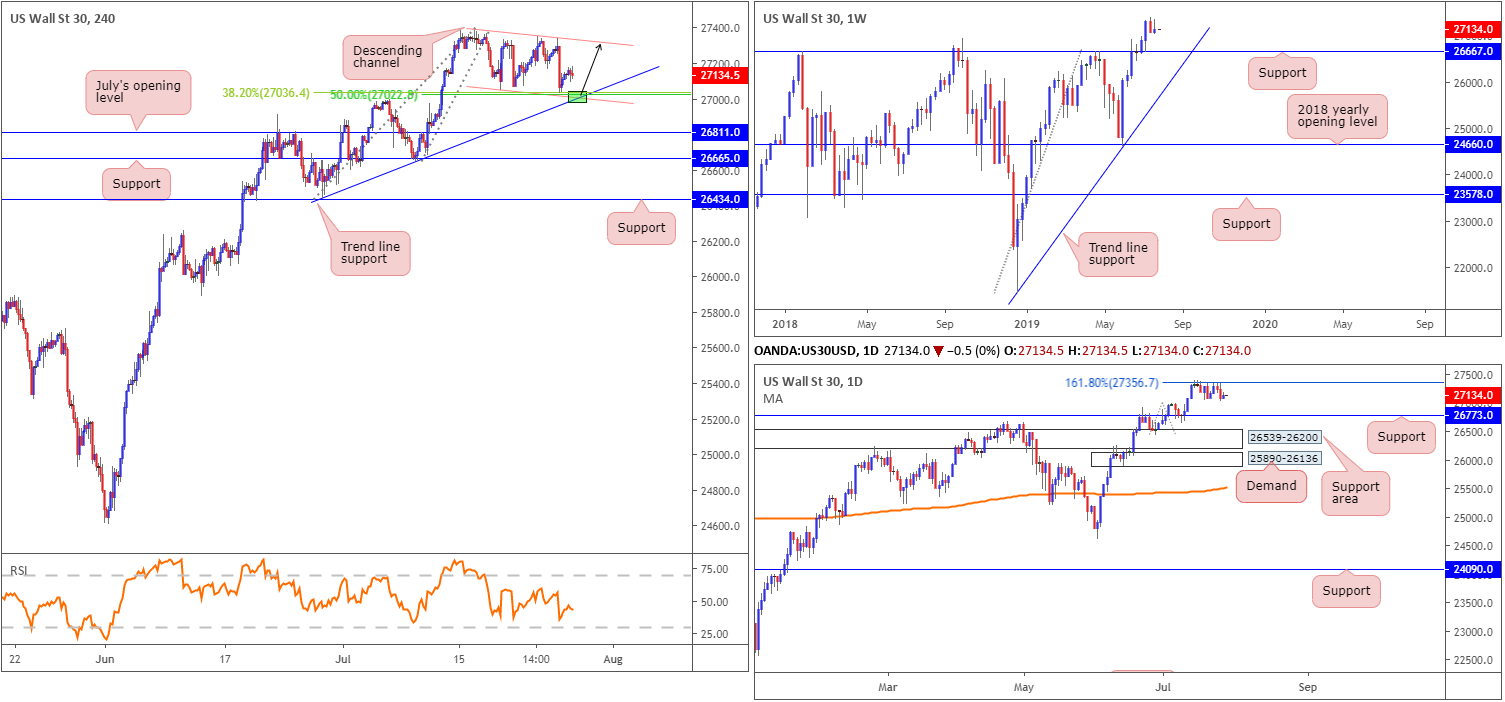
Dow Jones Industrial Average:
Weekly gain/loss: +0.23%
Weekly close: 27134
Weekly perspective:
Since retesting 26667 as support three weeks ago, the index has consolidated gains around all-time highs of 27388. Having seen last week’s candle wrap up the week in the shape of a bearish selling wick, a retest at 26667 is certainly a possibility this week. Failure to hold may also lead to a move being seen towards trend line support extended from the low 21452.
However, with limited resistance in sight until connecting with 28070 (not visible on the screen), a 127.2% Fibonacci ext. point taken from the low 21425, additional buying could still come about prior to revisiting 26667.
Daily perspective:
Contrary to weekly price, daily action remains defending the underside of 27356: the 161.8% Fibonacci ext. point. Continued selling from here has a downside target set at 26773, located just north of weekly support at 26667.
H4 perspective:
The S&P 500 and the tech-heavy Nasdaq 100 set record closes Friday amid strong earnings reports and better-than-expected US growth data. The Dow Jones Industrial Average added 51.47 points, or 0.19%; the S&P 500 rose 22.19 points, or 0.74% and the Nasdaq gained 87.09 points, or 1.10%.
Viewing the Dow’s technicals, nevertheless, show the candles highlight a potential buy zone around the 27022 neighbourhood (green). Composed of a trend line support taken from the low 26436, a channel support taken from the low 27049, a 38.2% Fibonacci retracement ratio at 27036 and a 50.0% support value at 27022, this area appears to house enough confluence to hold price action higher this week.
Areas of consideration:
Focus is on the green area marked on the H4 timeframe for longs around 27022. Protective stop-loss orders can be positioned around 26962, with an initial upside target residing at H4 channel resistance extended from the high 27388. Alternatively, conservative traders may opt to wait and see if the H4 candles produce a bullish candlestick signal before pulling the trigger. This way, traders have identified buyer intent and have structure in which to base entry and risk levels from. The latter is the favoured approach, owing to the fact daily resistance at 27356 remains in the fold.
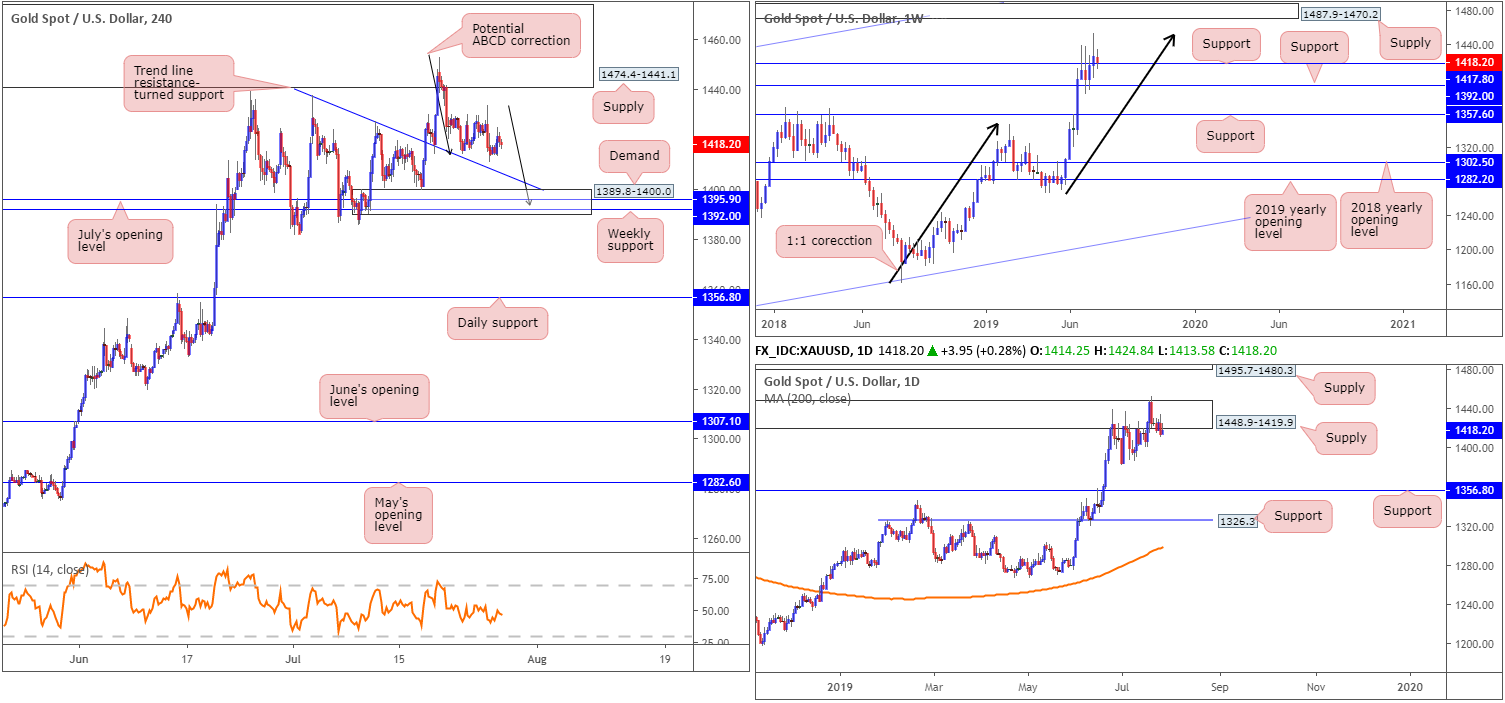
XAU/USD (GOLD):
Weekly gain/loss: -0.50%
Weekly close: 1418.2
Weekly perspective:
Resistance at 1417.8 finally gave way two weeks ago, allowing bullion to cross paths with a 1:1 correction (black arrows) around 1453.2 shaped from the 1160.3 August 13 low. As is evident from the chart, selling has been reasonably strong from 1453.2, though has so far been unable to reclaim 1417.8. In the event we do eventually explore ground beneath here, support at 1392.0 is next on the hit list.
Daily perspective:
The technical landscape on the daily timeframe observed a break of the top edge of a supply zone at 1448.9-1419.9 in recent trading. While this move was likely enough to trip a portion of the stop-loss orders, it’s unlikely to have cleared the path north to supply at 1495.7-1480.3, given the follow-through selling that emerged. As for downside targets on this scale, the research team notes to be aware of the 1381.9 July 1 low, followed by support at 1356.8.
H4 perspective:
Since crossing swords with a rather large supply zone at 1474.4-1441.1, the price of gold has been gradually declining against the US dollar. In terms of neighbouring support, we have trend line resistance-turned support (extended from the high 1437.7), closely followed by a striking area of demand coming in at 1389.8-1400.0. Within this zone, July’s opening level at 1395.5 resides as support, as well as weekly support underlined above at 1392.0. What’s also notable is the potential ABCD (black arrows) correction that terminates within the demand’s walls around 1393.6.
Areas of consideration:
Even though the market may observe weekly price advance from support at 1417.8, the research team feels the strength displayed from the weekly 1:1 correction (black arrows) around 1453.2 so far is worthy of attention. For that reason, a break of the current weekly support may be seen, which will likely lead to a test of weekly support at 1392.0. Note this level is housed within the confines of H4 demand at 1389.8-1400.0, which given its surrounding confluence on the H4 timeframe, is an ideal location to be scouting for long opportunities this week.
The accuracy, completeness and timeliness of the information contained on this site cannot be guaranteed. IC Markets does not warranty, guarantee or make any representations, or assume any liability regarding financial results based on the use of the information in the site.
News, views, opinions, recommendations and other information obtained from sources outside of www.icmarkets.com.au, used in this site are believed to be reliable, but we cannot guarantee their accuracy or completeness. All such information is subject to change at any time without notice. IC Markets assumes no responsibility for the content of any linked site.
The fact that such links may exist does not indicate approval or endorsement of any material contained on any linked site. IC Markets is not liable for any harm caused by the transmission, through accessing the services or information on this site, of a computer virus, or other computer code or programming device that might be used to access, delete, damage, disable, disrupt or otherwise impede in any manner, the operation of the site or of any user’s software, hardware, data or property.


