
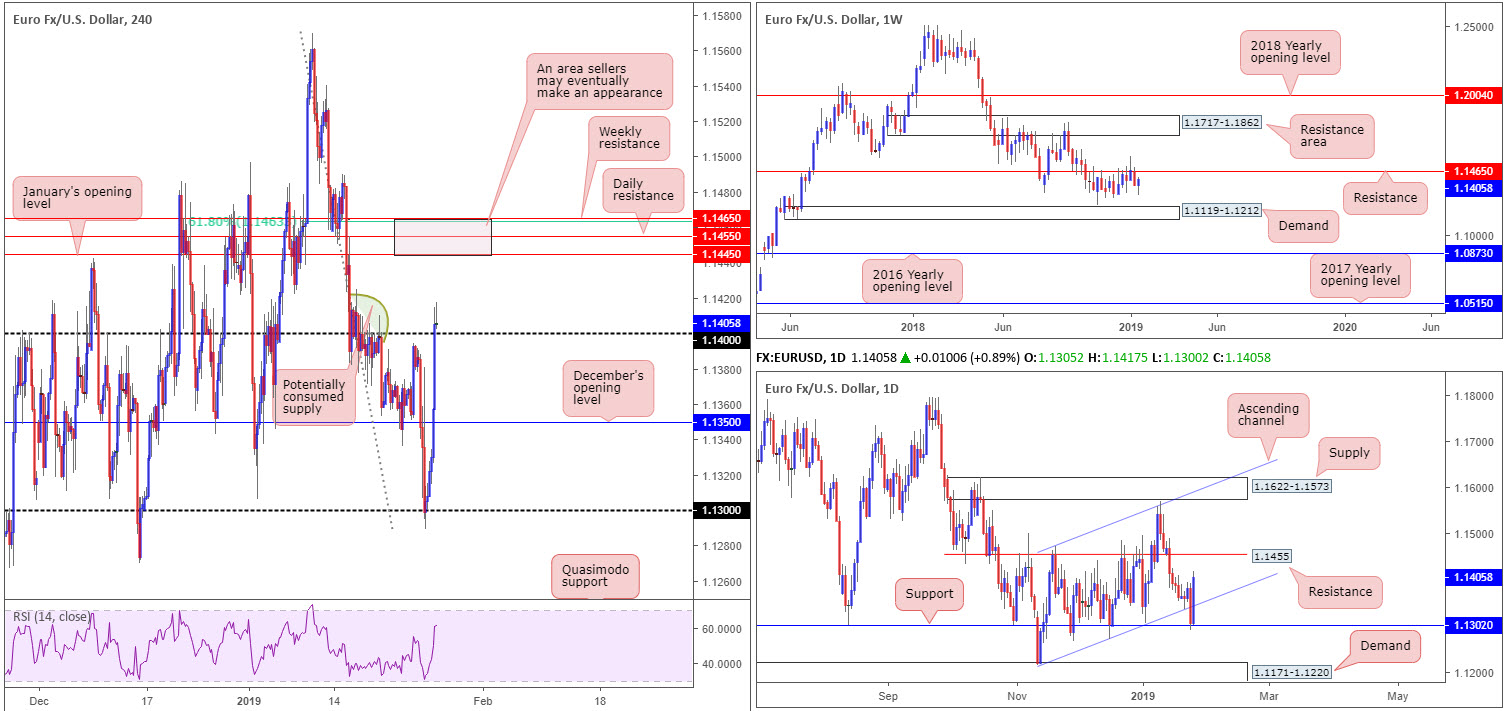
EURUSD:
Weekly gain/loss: +0.39%
Weekly close: 1.1405
Weekly perspective:
Despite clocking lows of 1.1289 last week, the euro rotated firmly and kept the currency on the winning side of the table against its US counterpart into the close. The next hurdle to the upside falls in at resistance drawn from 1.1465. Traders are urged not to overlook the current resistance level on this scale, as it boasts strong historical significance dating as far back as early February 2015.
Daily perspective:
Support at 1.1302 on the daily timeframe, as you can see, elbowed its way into the mix Thursday after the unit engulfed the daily ascending channel support (extended from the low 1.1215). Strong buying in the shape of a near-full-bodied bullish candle entered the fray Friday from this level, eroding weekly losses and placing the pair within striking distance of resistance at 1.1455.
H4 perspective:
A quick recap of Friday’s session on the H4 timeframe reveals the 1.13 handle held its ground, chalking up an impressive recovery on the back of a waning greenback. Firmly shredding through orders at December’s opening level at 1.1350, and then eventually clearing 1.14 to the upside, the H4 candles potentially set the stage for further buying this week towards January’s opening level at 1.1445, shadowed closely by daily resistance mentioned above at 1.1455 and then a 61.8% H4 Fibonacci resistance at 1.1463/weekly resistance at 1.1465.
What’s also notable from a technical perspective on the H4 scale is the potentially consumed supply to the left of current price, and the RSI indicator seen fast approaching its overbought value.
Areas of consideration:
In light of Friday’s impressive upsurge, a retest of 1.14 as support is certainly something to keep a watchful eye on today/early week, targeting 1.1465/1.1445 (the area highlighted above in bold). Should the retest form by way of a bullish candlestick formation, not only would this help traders identify bullish intent, it’d also provide entry and stop parameters to work with (according to the pattern’s rules of engagement).
Another scenario worth penciling down this week is the 1.1465/1.1445 area as a sell zone, targeting the 1.14 handle as an initial take-profit zone. The levels included within this base are prominent and incorporate all three timeframes, therefore worthy of a place on the watch list this week.
Today’s data points: ECB President Draghi Speaks.
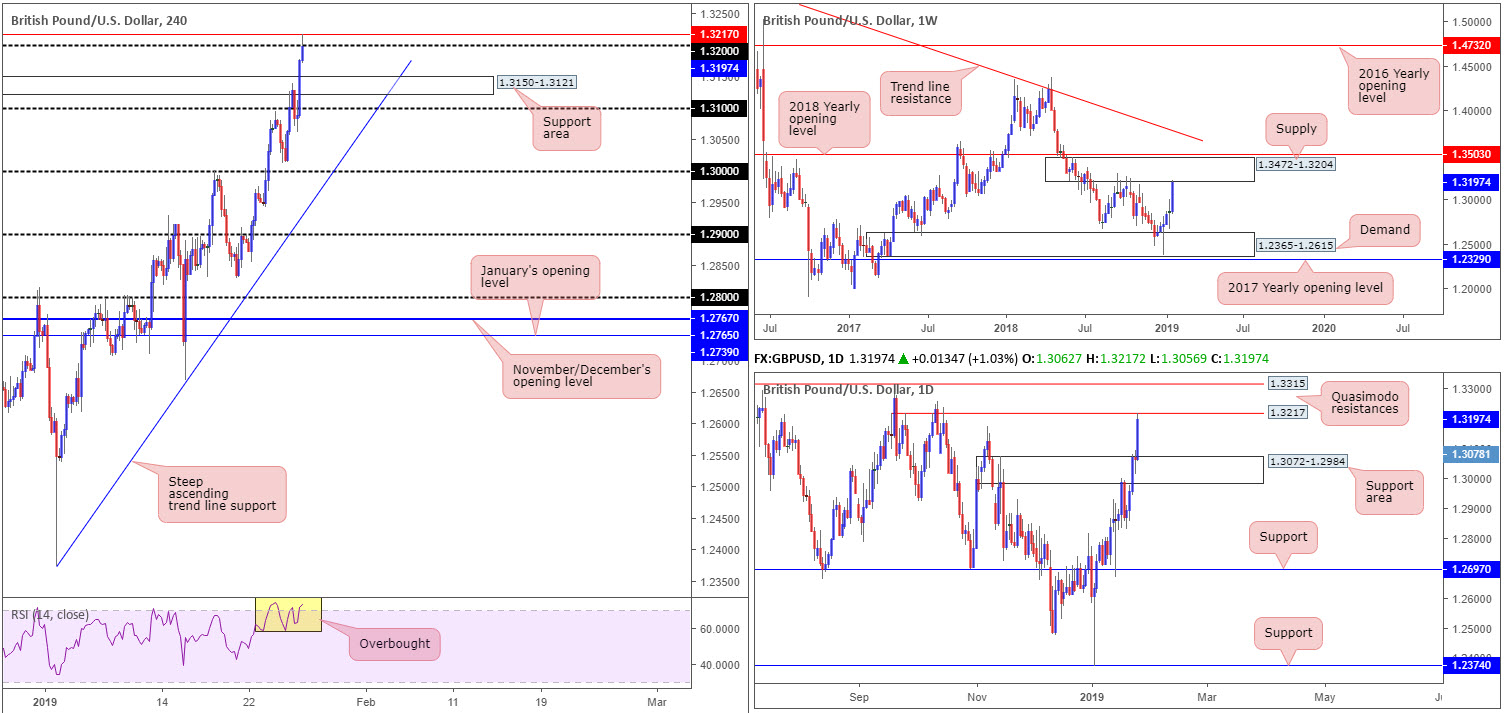
GBP/USD:
Weekly gain/loss: +2.54%
Weekly close: 1.3197
Weekly perspective:
In the mould of a near-full-bodied bullish candle, the British pound catapulted itself north against its US equivalent last week, positioning the market at the lower boundary of supply coming in at 1.3472-1.3204. Tailed closely by a 2018 yearly opening level at 1.3503, the supply, which already capped upside successfully once already in October 2018, houses a healthy chance of repeating history here.
Daily perspective:
A closer reading of the market shows the unit overpowered the 1.3174 November 7 high (2018) Friday and finished the week confronting the underside of a Quasimodo resistance level priced in at 1.3217. In the event sellers defend this line of resistance, our technical studies show a possible retracement towards 1.3072-1.2984: a supply zone-turned support area, could be in store. A continuation north, on the other hand, has another layer of Quasimodo resistance to target at 1.3315.
H4 perspective:
Up 1.03% on the day, Friday’s session witnessed a strong continuation to the upside, bolstered by a weakening buck and on-going hopes of an Article 50 extension. Stop-loss orders were filled beyond the 1.31 handle and fresh sellers joined the movement just north of this number around supply fixed at 1.3150-1.3121. Though the H4 candles reclaimed 1.31 to the downside in early London, sellers failed to maintain their position, leaving the door open for another wave of buying that reached highs of 1.3217 at the close.
As is evident from this timeframe, the daily Quasimodo resistance level at 1.3217 responded reasonably well at the closing stages of the day, consequently forcing the pair to close out the week sub 1.32 by a handful of pips. It might also interest some traders to not the RSI indicator is seen testing overbought territory.
Areas of consideration:
With all three timeframes displaying some form of resistance in the market, the research team notes to expect a pullback today/early week to at least 1.3150-1.3121: a H4 supply-turned support area.
As it stands, limited bearish candlestick confirmation is visible on the H4 timeframe. Aside from drilling down to a lower timeframe and searching for a bearish candlestick signal, an alternative option is to simply sell at market with stops tucked above either the daily Quasimodo head (1.3257) or a few pips above the Quasimodo itself (1.3217) and ‘hope’ sellers respect the aforementioned resistances. Irrespective of the method one employs, the next downside target from 1.32ish is the 1.3150-1.3121 area highlighted above, followed closely by the 1.31 handle. Beyond here, the next port of call is the top edge of the daily support area underlined above at 1.3072.
Today’s data points: BoE Gov. Carney Speaks.
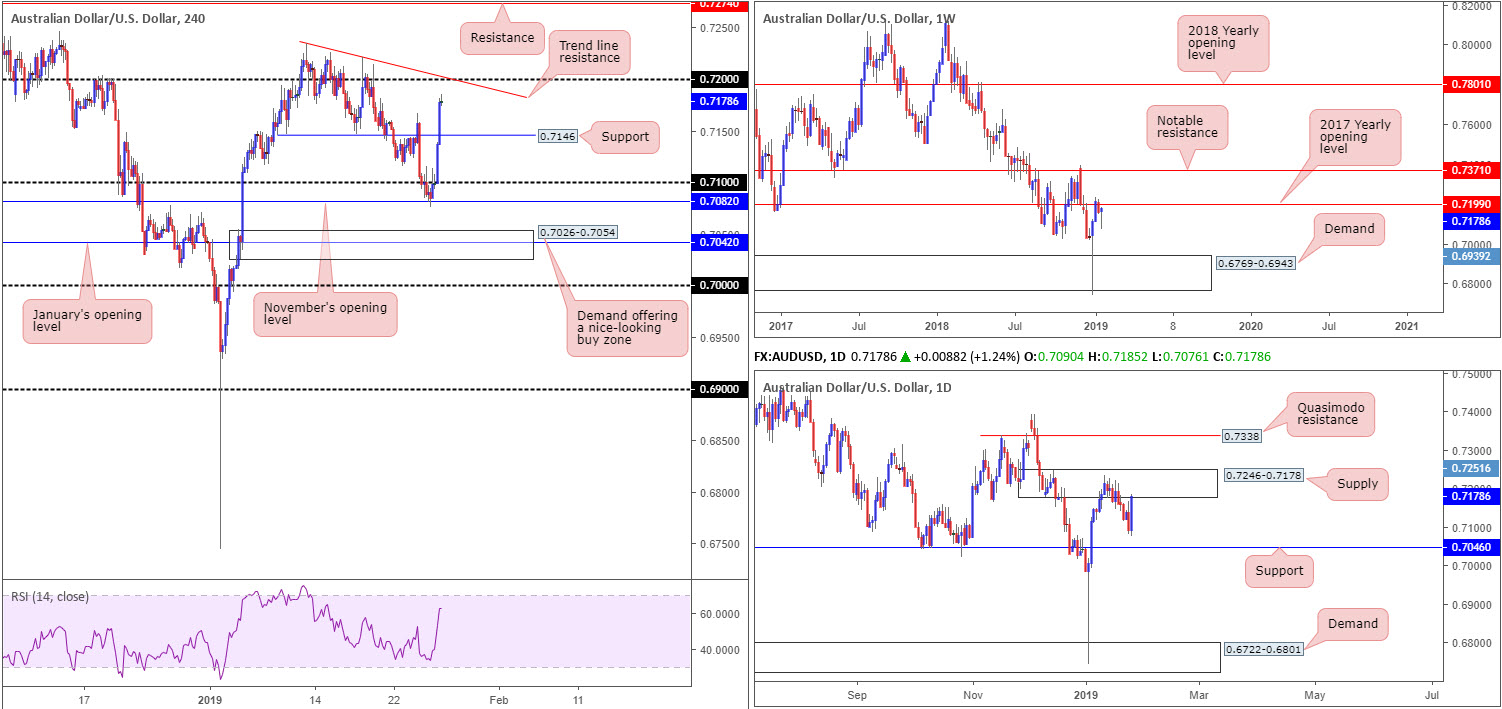
AUD/USD:
Weekly gain/loss: +0.27%
Weekly close: 0.7178
Weekly perspective:
Resistance by way of the 2017 yearly opening level at 0.7199 remains a focal point in this market, in spite of last week’s movement closing in the shape of a bullish pin-bar formation. Levels skyward of 0.7199 are seen around 0.7371: a notable resistance level that houses relatively strong history. To the downside from current price, however, demand at 0.6769-0.6943 is seen in the firing range.
Daily perspective:
Reinforcing the 2017 yearly opening level highlighted above is daily supply at 0.7246-0.7178, though traders are likely exercising a cautious tone here given Friday’s sturdy bullish engulfing candle. Continued buying from this point, assuming we overthrow the current supply, could eventually lead to the unit shaking hands with Quasimodo resistance at 0.7338.
H4 perspective:
The Australian dollar soared to fresh weekly highs of 0.7185 Friday amid US trading hours. Influenced by a sour US dollar, which breached its 96.00 mark to the downside on the US dollar index, the H4 candles reclaimed 0.71 status and eventually propelled through resistance at 0.7146 (now acting support). In terms of H4 structure, the 0.72 handle is next on tap as possible resistance. Although this level suffered a number of ruptures to the upside mid-Jan, do bear in mind this number is contained within the current daily supply and also represents weekly resistance: the 2017 yearly opening level at 0.7199. What’s also interesting here is a local H4 trend line resistance (etched from the high 0.7235) is seen merging with 0.72 almost to the pip, and the H4 RSI indicator is visibly eyeballing overbought terrain.
Areas of consideration:
In view of the week ending a handful of pips south of 0.72, this psychological mark will likely be on the radar for many traders this week – even more so considering its association with higher-timeframe structure (see above).
To confirm seller interest off 0.72 should the level enter the fold today/early week, traders have a number of options, including drilling down to the lower timeframes and trading 0.72 based on lower-timeframe structure. A basic example of this is an engulf of demand that’s followed up with a retest as supply. Another option is to simply wait and see if H4 price chews out a bearish candlestick formation, therefore offering traders defined entry and stop levels to trade alongside identifying seller intent.
Regardless of the direction one takes in regard to confirmation, if any, the first downside target, according to our technical reading, is support at 0.7146 on the H4 scale.
Today’s data points: Australian banks are closed in observance of Australia Day.
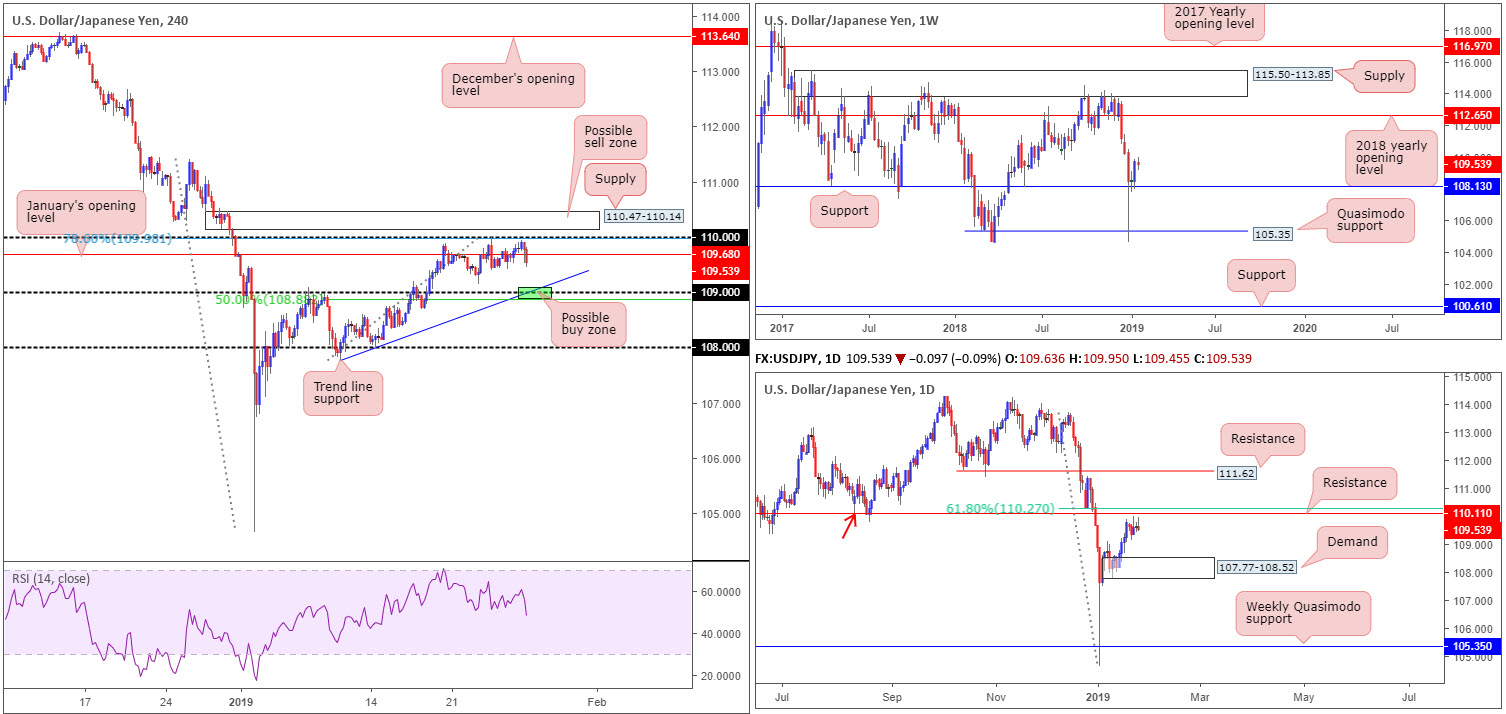
USD/JPY:
Weekly gain/loss: -0.21%
Weekly close: 109.54
Weekly perspective:
According to the weekly timeframe, the pair visibly emphasises a bullish tone. Buyers recently found a floor off support priced in at 108.13. The research team notes a relatively clear path to the upside from 108.13 until connecting with the 2018 yearly opening level at 112.65. Should the market spin south, nonetheless, Quasimodo support at 105.35 is the next level on the hit list to be aware of.
Daily perspective:
Contrary to weekly levels, as highlighted in a number of earlier reports last week, daily price action is seen consolidating gains ahead of resistance coming in at 110.10 that’s trailed closely by a 61.8% Fibonacci resistance value at 110.27. 110.10 is essentially a Quasimodo support-turned resistance (red arrow). On the condition the unit climbs above the noted resistances, as the weekly timeframe suggests, another layer of resistance is realised at 111.62. A downside move, on the other hand, has demand priced in at 107.77-108.52 in sight.
H4 perspective:
Leaving the underside of 110 unchallenged Friday (aligns closely with a 78.6% Fibonacci resistance value at 109.98), the US dollar ceded further ground to its Japanese counterpart, consequently taking back January’s opening level at 109.68 to the downside into the closing bell. Traders may also want to pencil in 109 as viable support, seeing as it fuses closely with a local trend line support and a 50.0% support value at 108.87 (green – extended from the low 107.77). It is also worth keeping in mind the fresh supply zone priced in just north of 110 at 110.47-110.14.
Areas of consideration:
Outlook unchanged due to reasonably lackluster action.
The 109 handle, in light of it aligning with additional support (see above), is worthy of attention for a bounce today, though the research team urges traders to consider waiting for additional candle confirmation (entry/stop levels can be defined according to the selected pattern) to form before pulling the trigger due to the threat of a fakeout (common viewing at round numbers).
Apart from the 109 handle, eyes still also remain on the H4 supply positioned at 110.47-110.14. A push above 110 will not only trip stop-loss orders from traders attempting to fade 110, which, when filled, will become buy orders to sell in to, breakout buyers will also likely attempt to join the movement. This offer of liquidity to sell to, coupled with daily resistance seen plotted at 110.10, is likely enough to draw in attention and bring price action lower.
Traders who feel the need to trade the noted H4 supply based on candle confirmation, waiting for a bearish formation to materialise will certainly add weight to a possible rotation lower. Traders who believe the H4 supply and daily resistance is enough evidence to draw sellers’ attention will likely enter short at 110.14 with stop-loss orders planted just north of 110.47. Once, or indeed if, the H4 candles reclaim 109.68 to the downside out of 110.47-110.14, traders can think about reducing risk to breakeven and taking partial profits off the table.
Today’s data points: Limited.
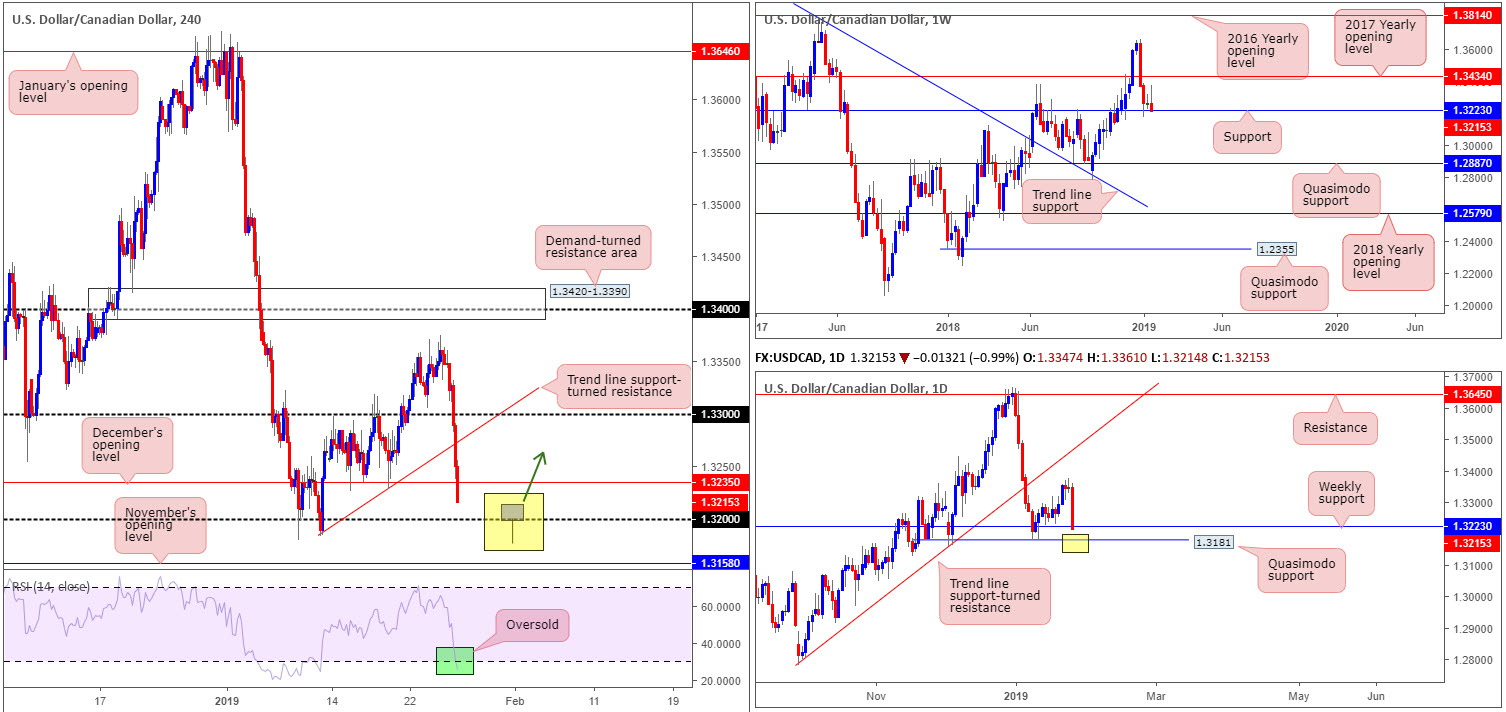
USD/CAD:
Weekly gain/loss: -0.37%
Weekly close: 1.3215
Weekly perspective:
Support priced in at 1.3223 is really having a hard time at the moment. Although last week’s action reached highs of 1.3375 off this level, the pair failed to sustain gains past this point before collapsing back towards the noted support, resulting in a bearish pin-bar formation developing. A combination of a visibly fragile support, coupled with last week’s bearish candlestick pattern, could eventually entice sellers into the market as far south as Quasimodo support priced in at 1.2887.
Daily perspective:
In the form of a near-full-bodied bearish candlestick, Friday’s trade encountered strong selling. This mildly pulled price action beyond the weekly support mentioned above at 1.3223, though do remain cognizant of nearby daily Quasimodo support coming in at 1.3181, which happened to offer a floor to the market a couple of weeks ago. Therefore, do make sure to have this base pencilled in on your watchlists this week, traders.
H4 perspective:
A declining US dollar along with a modestly strengthening oil market weighed on the USD/CAD Friday. As is evident from the H4 timeframe, the 1.33 handle, the trend line support (taken from the low 1.3183) and December’s opening level at 1.3235 were all consumed, exposing the 1.32 handle as a potential support level today. Beyond here we also have November’s opening level coming in at 1.3158 to take into account. Another point worth making is the RSI indicator is showing a clear oversold reading at the moment.
Areas of consideration:
For traders considering a long from 1.32 today, the research team anticipates a possible fakeout play developing here using the daily Quasimodo support at 1.3181. A H4 bullish pin-bar formation that pierces through 1.32 and taps 1.3181 is, therefore, considered a reasonably high-probability setup (see H4 chart for a visual image). Ultimately a H4 close above December’s opening level at 1.3235 would be sufficient enough to reduce risk to breakeven from 1.32, targeting 1.33 for profit taking.
Concerning selling this market, downside conviction will, according to our technical studies, only be present following a H4 close below November’s opening level at 1.3158.
Today’s data points: Limited.
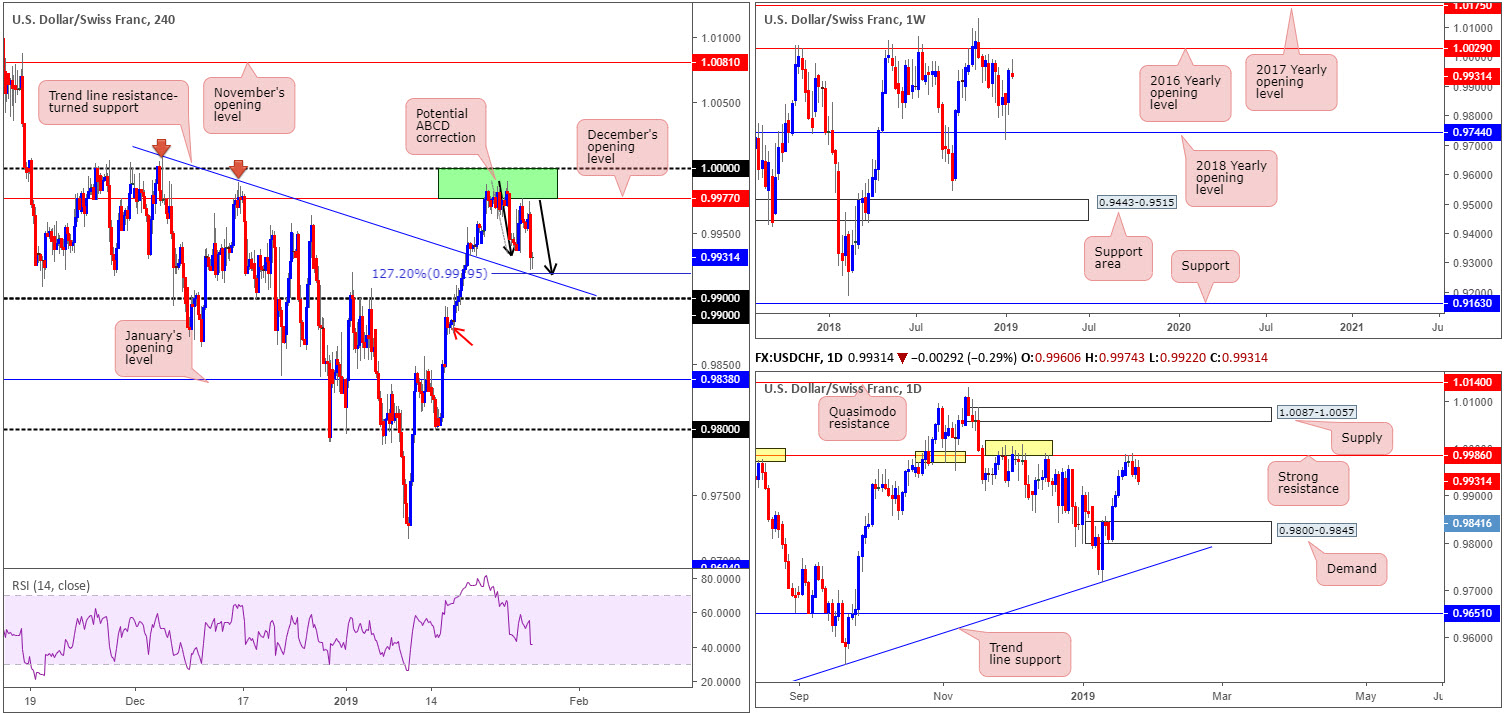
USD/CHF:
Weekly gain/loss: -0.23%
Weekly close: 0.9931
Weekly perspective:
Leaving the 2016 yearly opening level at 1.0029 unchecked last week, the USD/CHF spent the week chalking up a rather attractive bearish pin-bar pattern. In the event this triggers a round of selling, the next downside objective does not enter the frame until we cross swords with the 2018 yearly opening level coming in at 0.9744.
Daily perspective:
In support of the weekly timeframe’s bearish candlestick formation, daily price is fading notable resistance fixed at 0.9986. The history surrounding this level is particularly appealing (yellow), with the next support target on this scale not emerging until demand printed at 0.9800-0.9845.
H4 perspective:
For those who read Friday’s briefing the piece underlined 1.0000/0.9977 (green – comprised of the 1.0000 [parity] level and December’s opening level at 0.9977), which happens to house daily resistance at 0.9986 within.
The research team also went on to write:
Should further selling take shape on the H4 scale, the unit may complete an ABCD 127.2% correction (black arrows) around 0.9919, sited just north of a H4 trend line resistance-turned support. Note this pattern is also strengthened by a nearby round number at 0.99.
Areas of consideration:
Although both weekly and daily structure indicates further selling may be on the menu this week, an intraday bounce from the aforementioned H4 trend line resistance-turned support, nearby 0.99 handle and the H4 ABCD 127.2% completion at 0.9919 is a possibility. To trade long from these levels, though, waiting for additional confirmation is recommended before searching for that buy button.
Should the market ignore the above H4 supports and chalk up a H4 close below 0.99 that’s followed up with a retest as resistance, this is certainly of interest, targeting January’s opening level at 0.9838. There is a minor H4 demand present around 0.9883ish (red arrow), though given the higher-timeframe picture we feel this will likely be consumed. For conservative traders wishing to add a little more confirmation to the mix, consider waiting for a bearish candlestick signal to form (preferably off the underside of 0.99 on the retest – entry/stop parameters can be defined according to this pattern) before pulling the trigger.
Today’s data points: Limited.
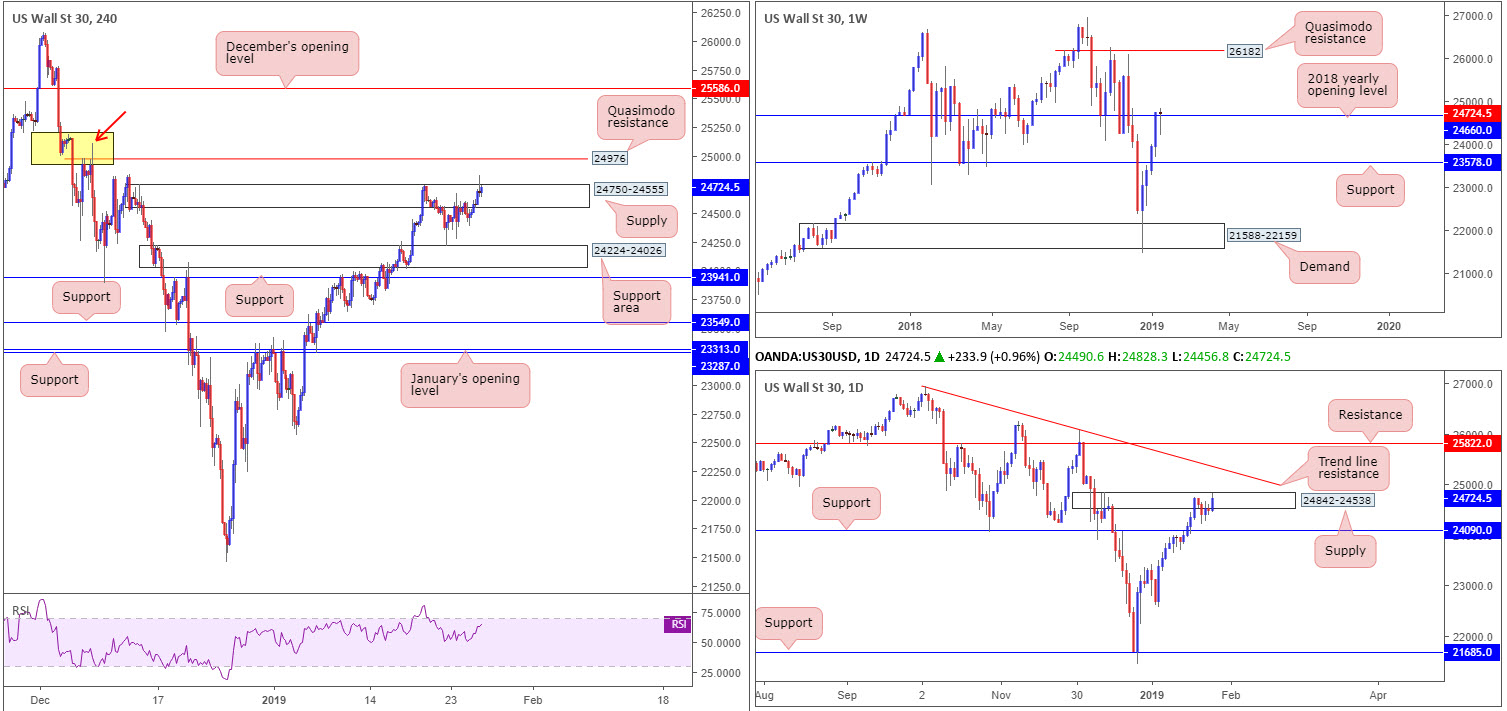
Dow Jones Industrial Average:
Weekly gain/loss: -0.06%
Weekly close: 24724
Weekly perspective:
Upside momentum, with respect to previous weeks, diminished considerably last week. In return, though, weekly price developed a reasonably attractive bullish pin-bar pattern that closed marginally above its 2018 yearly opening level at 24660. A resurgence of buying this week could potentially place the index within trading distance of a Quasimodo resistance level at 26182.
Daily perspective:
Against the backdrop of weekly structure, there exists a daily supply zone currently in play at 24842-24538. Outside of this area there’s also a reasonably strong-looking trend line resistance (etched from the high 26939) worth noting down should we push for higher ground.
H4 perspective:
A quick look at recent dealings on the H4 timeframe reveals the H4 candles punctured the upper edge of supply seen at 24750-24555, likely tripping stop-loss orders and unlocking the path north towards a nearby Quasimodo resistance level priced in at 24976. Another interesting point to consider is beyond the noted Quasimodo resistance there’s a lack of active resistance/supply until reaching December’s opening level at 25586 (the yellow zone shows supply at 25186-24996 likely consumed by the 25111 December 7 high [red arrow]).
Friday’s upsurge, as far as we can see, was enhanced by bullish European equity indexes and later via US President Donald Trump announcing a deal with lawmakers to end the government shutdown until February 15th.
Areas of consideration:
In essence, we have weekly price suggesting it wants higher levels this week, and daily price displaying two possible trouble areas for buyers: the current supply and nearby trend line resistance. Finally, the H4 picture emphasizes a consumed supply, though directly above rests Quasimodo resistance.
What’s also frustrating is even if traders were to wait for a H4 close above the current H4 Quasimodo resistance to form, the daily trend line resistance would immediately enter the play.
As you can see neither a long nor short seems attractive at the moment. For that reason, opting to remain on the sidelines is an option.
Today’s data points: Limited.
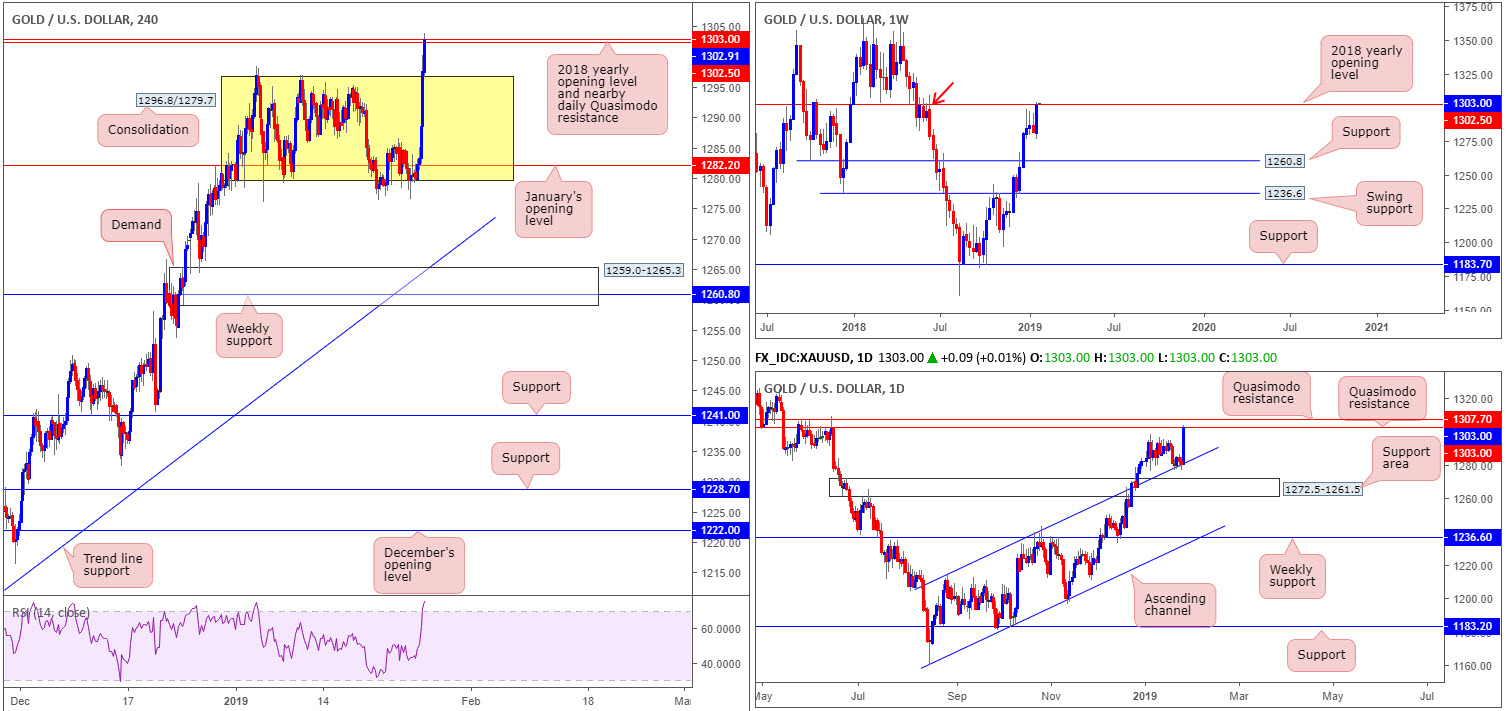
XAU/USD (GOLD):
Weekly gain/loss: +1.68%
Weekly close: 1302.9
Weekly perspective:
In spite of the three consecutive bearish pin-bar patterns, a sharp change in mood was observed last week, chalking up a firm bullish engulfing candle. This likely excited candlestick enthusiasts, given the medium-term uptrend bullion is entrenched within at present. While further buying is a possibility, traders may want to take into account the metal ended the week testing the 2018 yearly opening level at 1302.5, which happens to merge with supply painted at 1309.3-1289.9 (red arrow).
Daily perspective:
In conjunction with weekly structure, daily action is seen challenging a Quasimodo resistance printed at 1303.0, following a strong upsurge north from a channel resistance-turned support (taken from the high 1214.3). In addition to the current Quasimodo, another layer of Quasimodo resistance is seen nearby at 1307.7.
H4 perspective:
Since the beginning of the year, the price of gold on the H4 scale was fixed within defined consolidation between 1296.8/1279.7 (yellow). That was until Friday, when strong buyers entered the mix, likely responding to the deteriorating US dollar. The H4 candles strongly penetrated the top edge of the said range and tested the higher-timeframe resistance highlighted above.
Areas of consideration:
Keeping it Simple Simon this morning, the research team feels the yellow metal will look to put in a pullback today/early week. This is not only because of the weekly resistance at 1302.5 and daily Quasimodo resistance at 1303.0, it’s also due to intraday players likely looking to cash in on Friday’s gains.
In the event the market prints a strong bearish H4 candlestick signal (entry/stop parameters can be defined according to the pattern’s structure) from the noted higher-timeframe resistances, or even at the additional layer of daily Quasimodo resistance at 1307.7, a short in this market to at least to the top edge of the recently broken consolidation at 1296.8 is an option.
Traders are, however, urged to take into account risk/reward parameters to the first take-profit target before executing a trade. Anything less than a 1:1 ratio will make it challenging to exit the trade at breakeven should the market react and push higher from the first target.
The use of the site is agreement that the site is for informational and educational purposes only and does not constitute advice in any form in the furtherance of any trade or trading decisions.
The accuracy, completeness and timeliness of the information contained on this site cannot be guaranteed. IC Markets does not warranty, guarantee or make any representations, or assume any liability with regard to financial results based on the use of the information in the site.
News, views, opinions, recommendations and other information obtained from sources outside of www.icmarkets.com.au, used in this site are believed to be reliable, but we cannot guarantee their accuracy or completeness. All such information is subject to change at any time without notice. IC Markets assumes no responsibility for the content of any linked site. The fact that such links may exist does not indicate approval or endorsement of any material contained on any linked site.
IC Markets is not liable for any harm caused by the transmission, through accessing the services or information on this site, of a computer virus, or other computer code or programming device that might be used to access, delete, damage, disable, disrupt or otherwise impede in any manner, the operation of the site or of any user’s software, hardware, data or property.


