
Key risk events today:
US Core Durable Goods Orders m/m and Durable Goods Orders m/m.
(Previous analysis as well as outside sources – italics).
EUR/USD:
Weekly gain/loss: +2.00%
Weekly close: 1.1654
Weekly perspective:
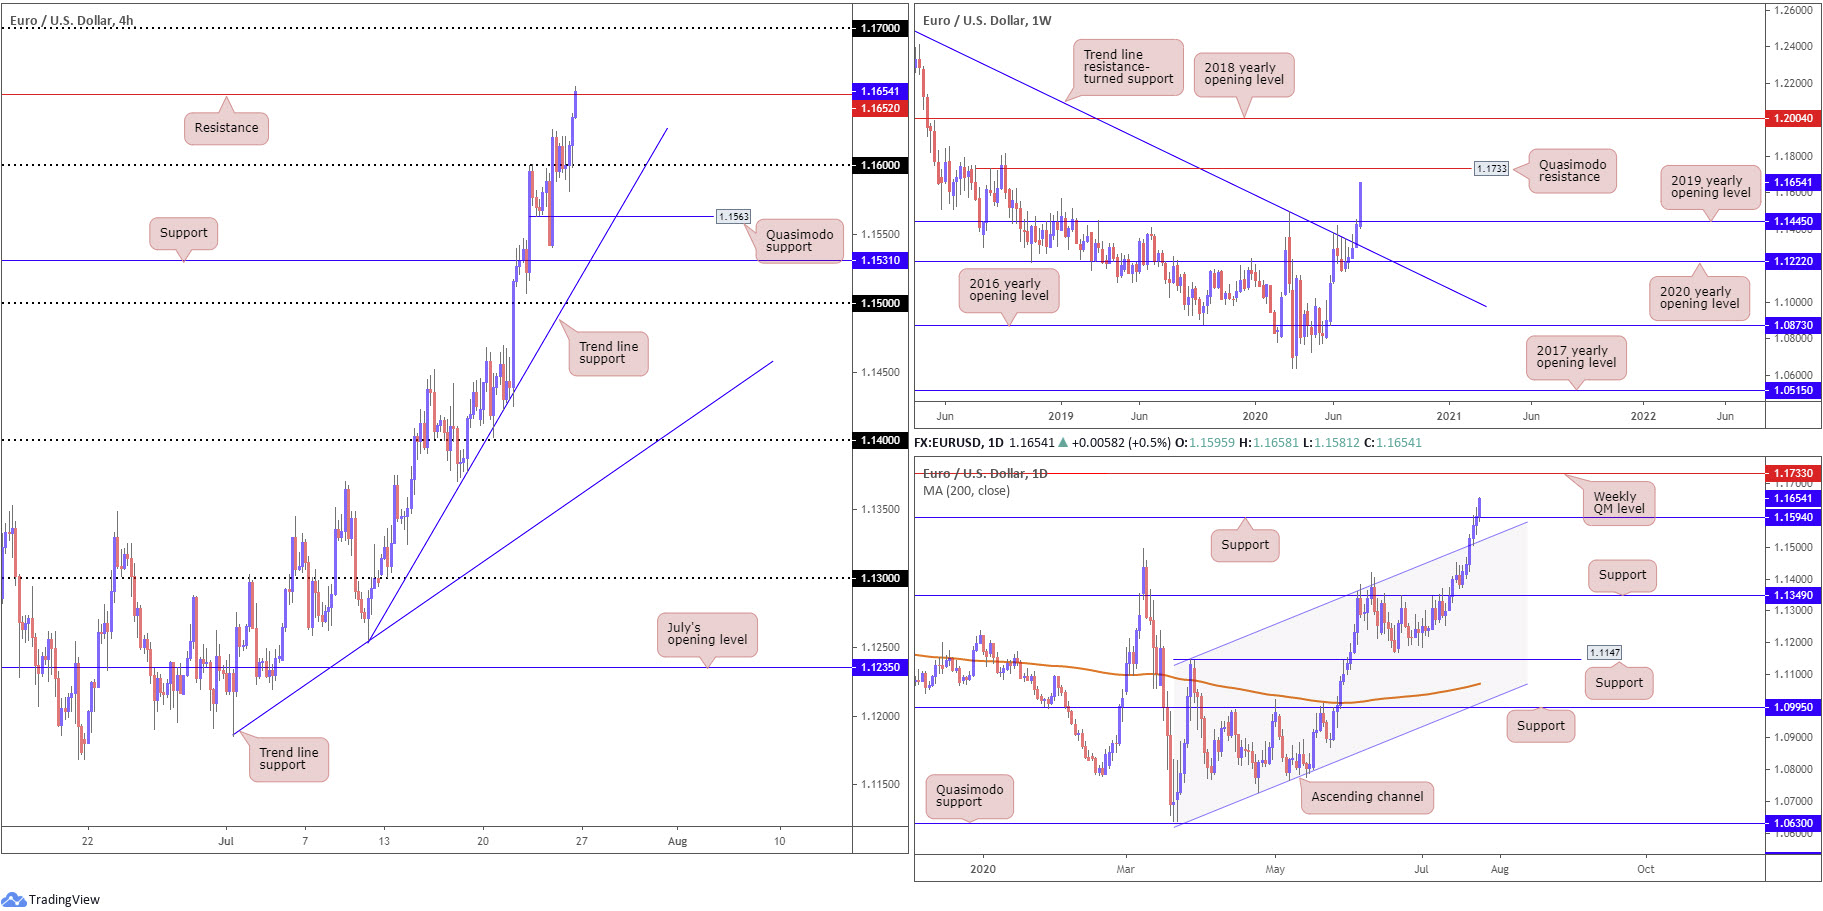
Assembling a fifth consecutive gain and rallying more than 220 pips, EUR/USD made considerable headway north of resistance at 1.1445 last week, the 2019 yearly opening level.
In the event the pair retains a healthy bid, Quasimodo resistance at 1.1733 aligns itself as the next potential upside target on the weekly timeframe this week, while overthrowing the latter shifts focus to the 2018 yearly opening level as far north as 1.2004.
Daily perspective:
In the shape of five consecutive bullish candles, mid-week observed channel resistance, extended from the high 1.1147, give way, followed by a swift push through Quasimodo resistance priced in at 1.1594, heading into the close.
In the same manner as the weekly timeframe, daily price may also take aim at Quasimodo resistance on the weekly timeframe from 1.1733 this week. Be that as it may, traders are still urged to pencil in the possibility of a retest at 1.1594 support prior to discovering higher ground.
H4 perspective:
The main catalyst behind the euro’s climb Friday was the US dollar’s broad decline as the US dollar index (DXY) plunged towards the 94.00 handle.
Through the simple lens of a technical trader, price established an intraday floor after retesting 1.16. US hours, despite an earlier dip to 1.1581, went forward and spun off into a wave of buying and folded a few pips over resistance coming in at 1.1652. Note a decisive breach of this level shines the spotlight on the 1.17 handle.
Areas of consideration:
As determined by weekly and daily timeframes, buyers potentially have the upper hand this week until crossing paths with weekly Quasimodo resistance at 1.1733.
Before reaching this far north, however, traders could observe a retest form at daily support from 1.1594, which conveniently merges with the 1.16 handle, based on the H4 timeframe.
Failure to revive 1.16 support, a H4 close above resistance at 1.1652 may appeal to breakout buyers, targeting the 1.17 neighbourhood, closely trailed by weekly Quasimodo resistance at 1.1733.
GBP/USD:
Weekly gain/loss: +1.81%
Weekly close: 1.2790
Weekly perspective:
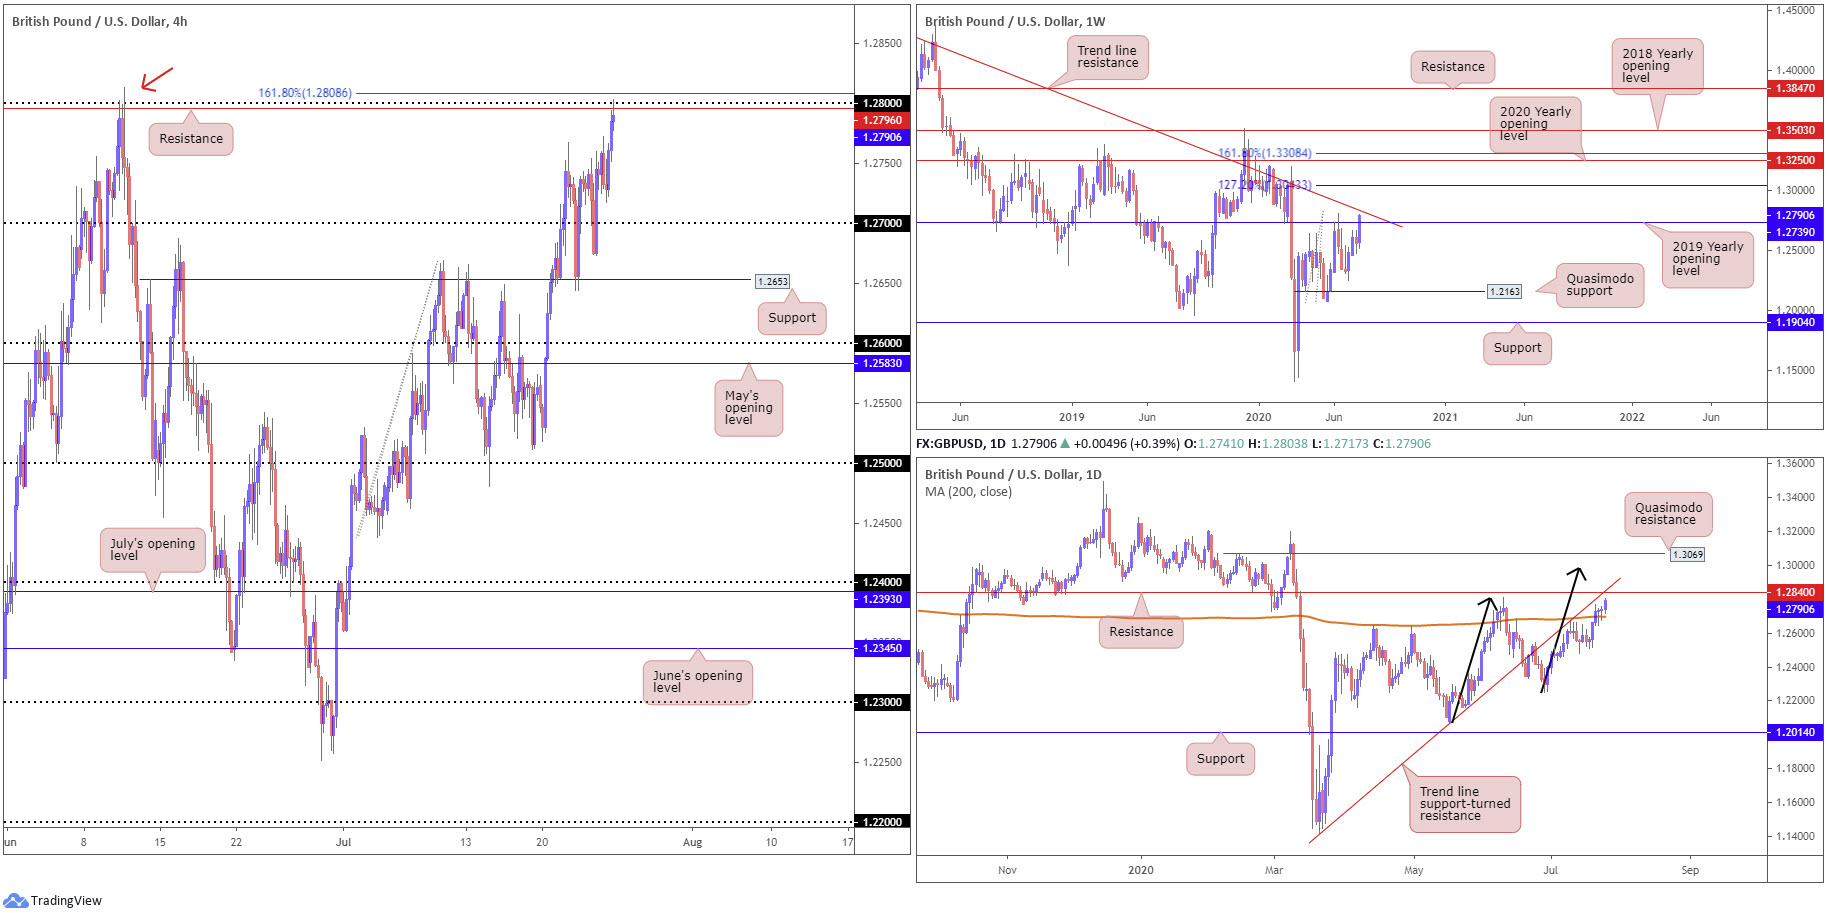
Recent trade chalked up a healthy close north of the 2019 yearly opening level at 1.2739, a move that pitches long-term trend line resistance, taken from the high 1.5930, into the pot this week as a potential ceiling.
Through trend line resistance traders will likely be eyeballing the 127.2% Fibonacci extension point at 1.3043, followed by the 2020 yearly opening level at 1.3250 and a 161.8% Fibonacci extension point nearby at 1.3308.
Daily perspective:
Mid-week observed the 200-day SMA (orange – 1.2697) exhibit support, leading to an end-of-week advance that places resistance at 1.2840 in the firing range this week. Readers will also want to acknowledge the level comes with a trend line support-turned resistance, taken from the low 1.1409.
Failure to cap upside at 1.2840, traders will likely be looking for ABCD (black arrows) completion around 1.2982ish, closely plotted ahead of Quasimodo resistance at 1.3069.
H4 perspective:
Stronger-than-anticipated UK retail sales data and persistent USD weakness elevated GBP/USD to 1.28 Friday, a psychological barrier also drawing in resistance at 1.2796 and a nearby 161.8% Fibonacci extension point at 1.2808.
Areas of consideration:
1.28 proved formidable resistance early June (red arrow), which could see history repeat itself this week.
The problem with this, though, is higher timeframe price recently cleared resistance on the weekly chart (1.2739 – 2017 yearly opening level). What’s interesting, nonetheless, is the next upside target on the weekly timeframe (trend line resistance) is positioned at around the 1.2815ish region. As a result, a fakeout above 1.28 into the aforementioned trend line resistance could be on the cards. A H4 close back under 1.28 off weekly structure early week, therefore, may be interpreted as a signal to consider bearish setups back to at least weekly support at 1.2739.
AUD/USD:
Weekly gain/loss: +1.59%
Weekly close: 0.7104
Weekly perspective:
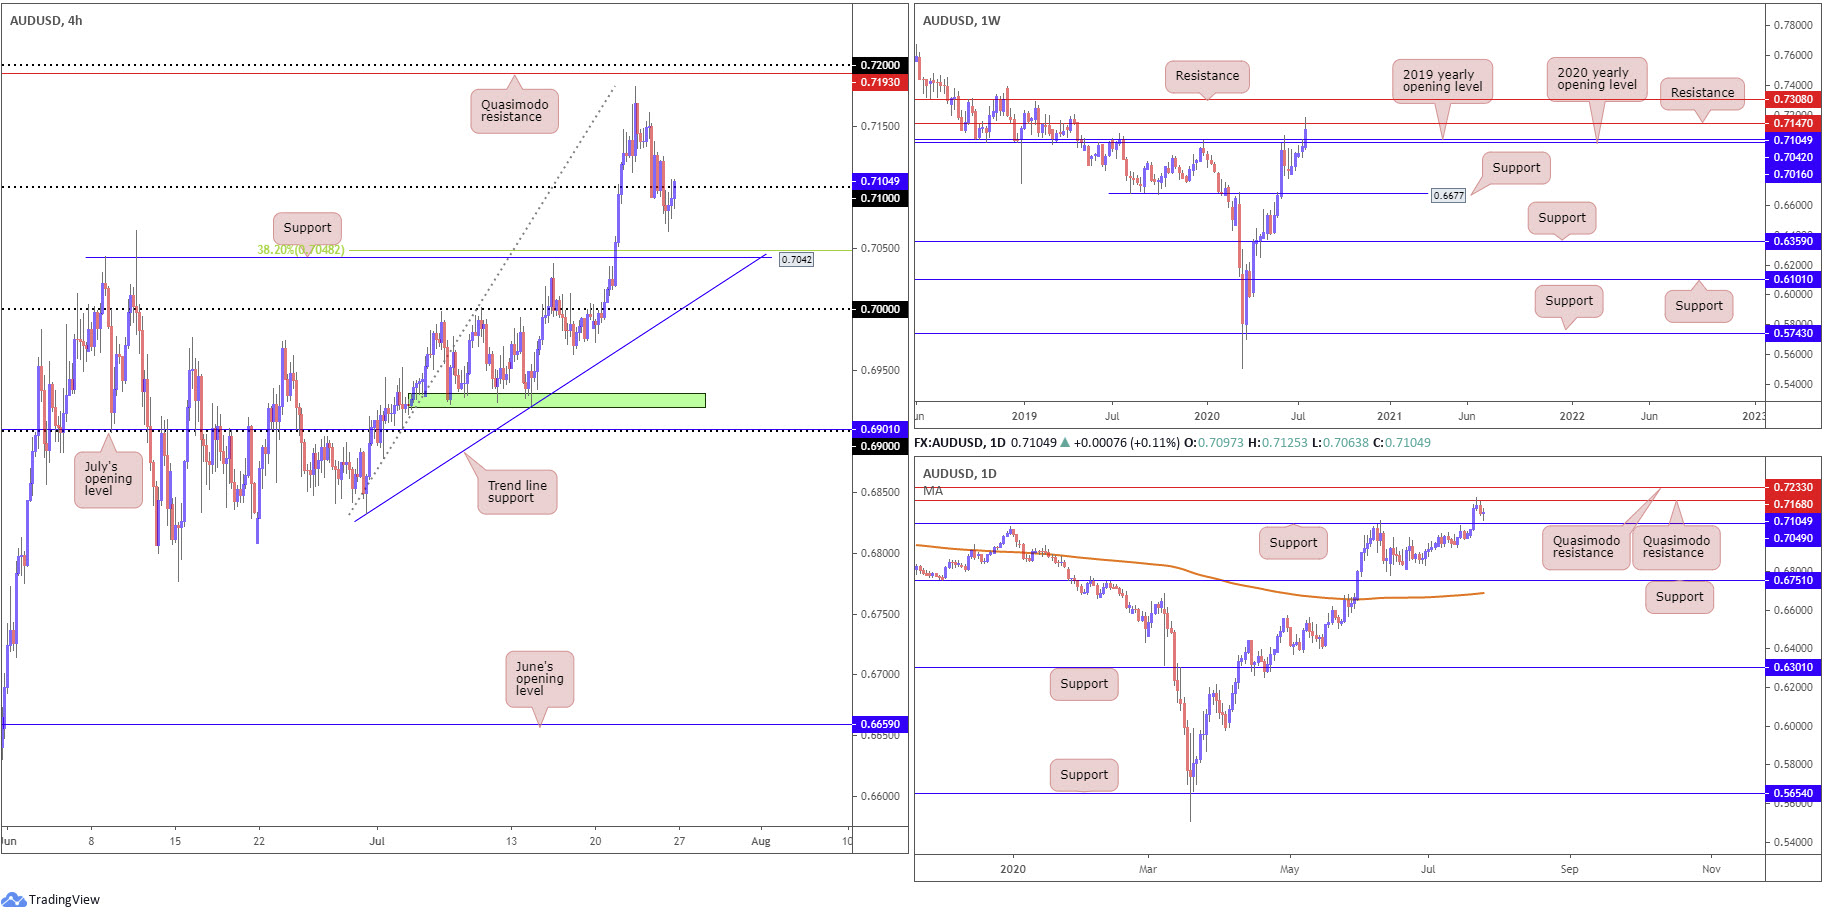
After chiselling through the 2020 and 2019 yearly opening levels at 0.7016 and 0.7042, respectively, last week price pulled in resistance at 0.7147 which has so far placed a cap on upside.
The aforementioned yearly opening levels represent possible support as we head into the new week, while a violation of 0.7147 could see price make a play for resistance parked at 0.7308.
Daily perspective:
Fading Quasimodo resistance at 0.7168 mid-week (sited south of Quasimodo resistance at 0.7233), by way of a shooting star candlestick pattern, had Thursday tunnel into lower levels. Friday, on the other hand, put forward a reasonably neutral doji candlestick formation, with its lower shadow missing prominent support at 0.7049 by 15 pips.
Price action traders, therefore, will acknowledge we have considerable support and resistance to work with this week on the bigger picture. To the downside, daily support at 0.7049 is seen, closely shadowed by the two yearly opening levels mentioned above on the weekly timeframe at 0.7042 and 0.7016. In terms of resistance, weekly price has 0.7147, with daily stationed at 0.7168.
H4 perspective:
Intraday witnessed the pair decline to a session low at 0.7063 Friday, pushing out orders resting at 0.71. Leaving support at 0.7042 (as well as the 38.2% Fibonacci retracement ratio at 0.7048) unchallenged, we concluded the day/week retesting (albeit mildly surpassing) 0.71.
Areas of consideration:
The 0.71 retest, despite the mild breach late Friday, is likely to interest lower timeframe sellers early trade, given where we’re trading from on the weekly and daily timeframes (resistance). Downside targets from the aforementioned round number can be found at daily support drawn from 0.7049 (aligns with a 38.2% Fibonacci retracement ratio at 0.7048 on the H4), and the 2019 yearly opening level at 0.7042 on the weekly timeframe, which converges with H4 support, also posted at 0.7042.
USD/JPY:
Weekly gain/loss: -0.88%
Weekly close: 106.07
Weekly perspective:
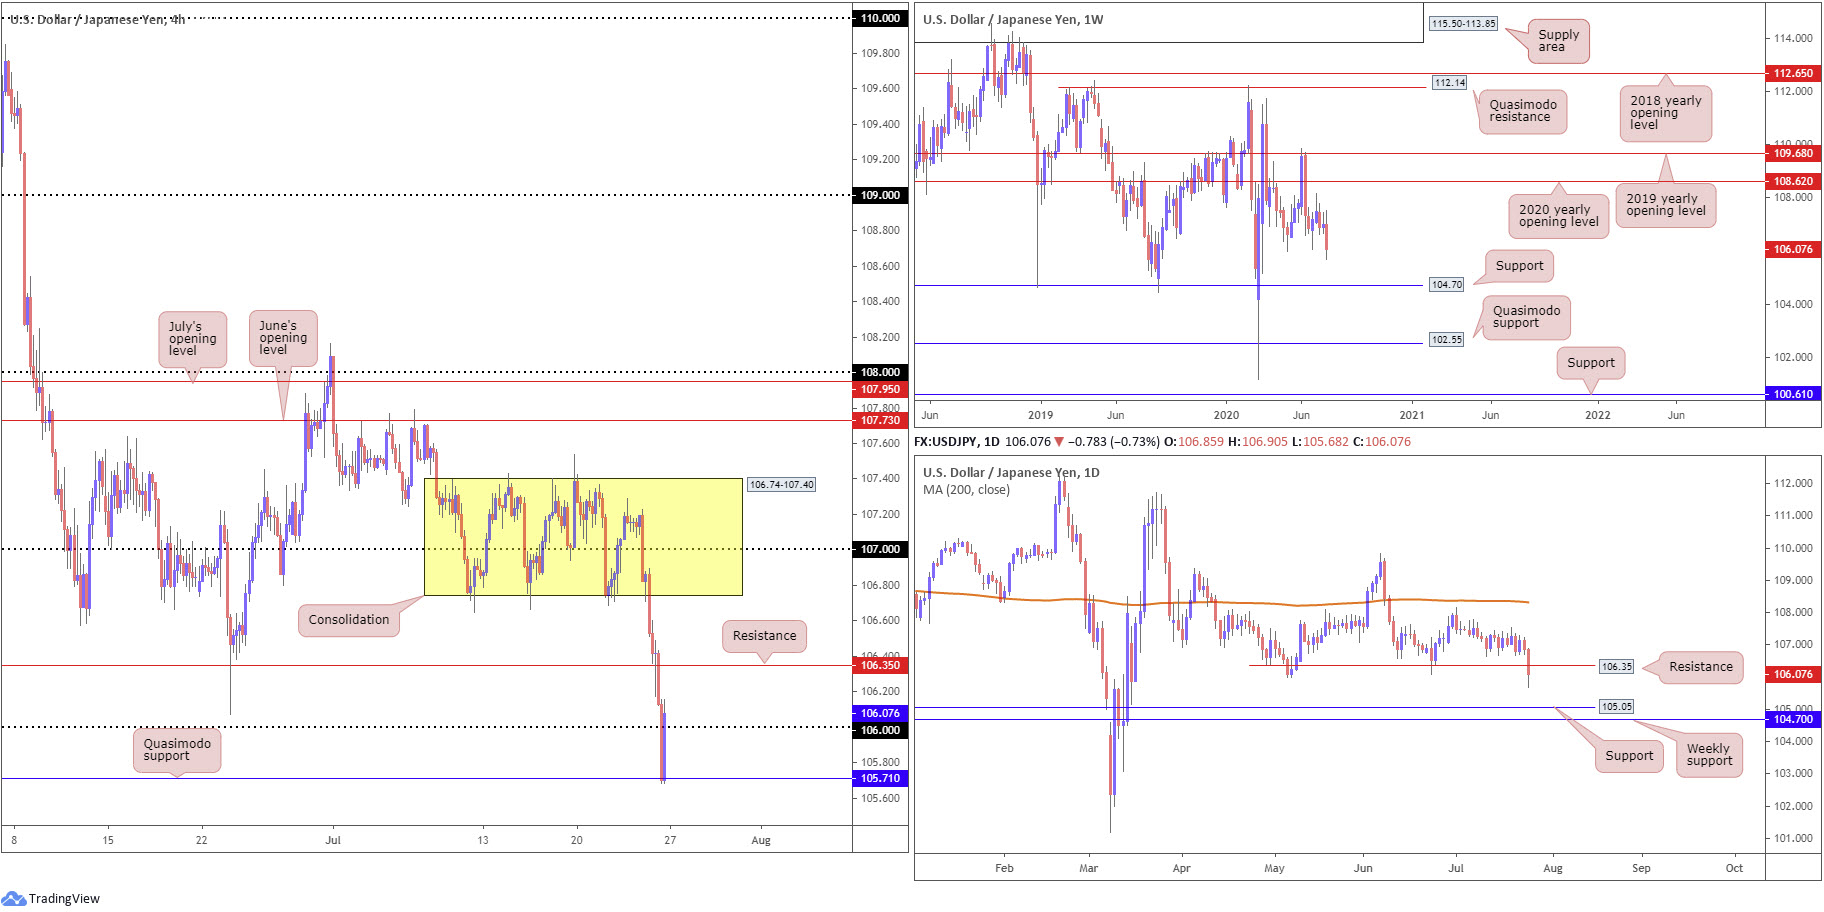
After consolidating beneath the 2020 yearly opening level at 108.62 since mid-June, USD/JPY sunk to lows at 105.68 in recent movement, dragging price action through the 105.98 6th May low and shifting focus towards long-term support plotted at 104.70 this week.
Daily perspective:
Friday, as evident from the daily chart, tunnelled through Quasimodo support at 106.35 (now serving as resistance), likely running sell-stops. This draws attention to support at 105.05, located just ahead of weekly support at 104.70.
Although both weekly and daily timeframes express a bearish bias heading into the new week, it is worth highlighting the possibility of a 106.35 retest forming before stepping into deeper water.
H4 perspective:
Risk-averse market conditions boosting the safe-haven Japanese yen, along with the US dollar index plummeting towards the 94.00 neighbourhood, sent USD/JPY screaming lower Friday.
Since early July, the H4 candles have been entrenched within a consolidation (yellow) between 106.74-107.40, a reasonably wide range that houses the 107 handle. The lower edge of this base caved early trade Friday, despite an attempt at recovery late Thursday. This eventually led to 106 unbolting its doors to Quasimodo support at 105.71, which, as you can see, held into the close and squeezed out a marginal close above 106.
Areas of consideration:
Traders are unlikely to put much weight into the recovery off Quasimodo support (105.71) on the H4, having seen both weekly and daily timeframes recently clearing support. While retaking 106 could excite buyers, the upper limit here is likely to be fixed at daily resistance from 106.35.
With the above in mind, 106.35 is perhaps a watched resistance this week, with sellers from here to potentially try and join moves to daily support plotted at 105.05. Conservative traders, of course, may still seek additional confirmation before engaging.
USD/CAD:
Weekly gain/loss: -1.23%
Weekly close: 1.3410
Weekly perspective:
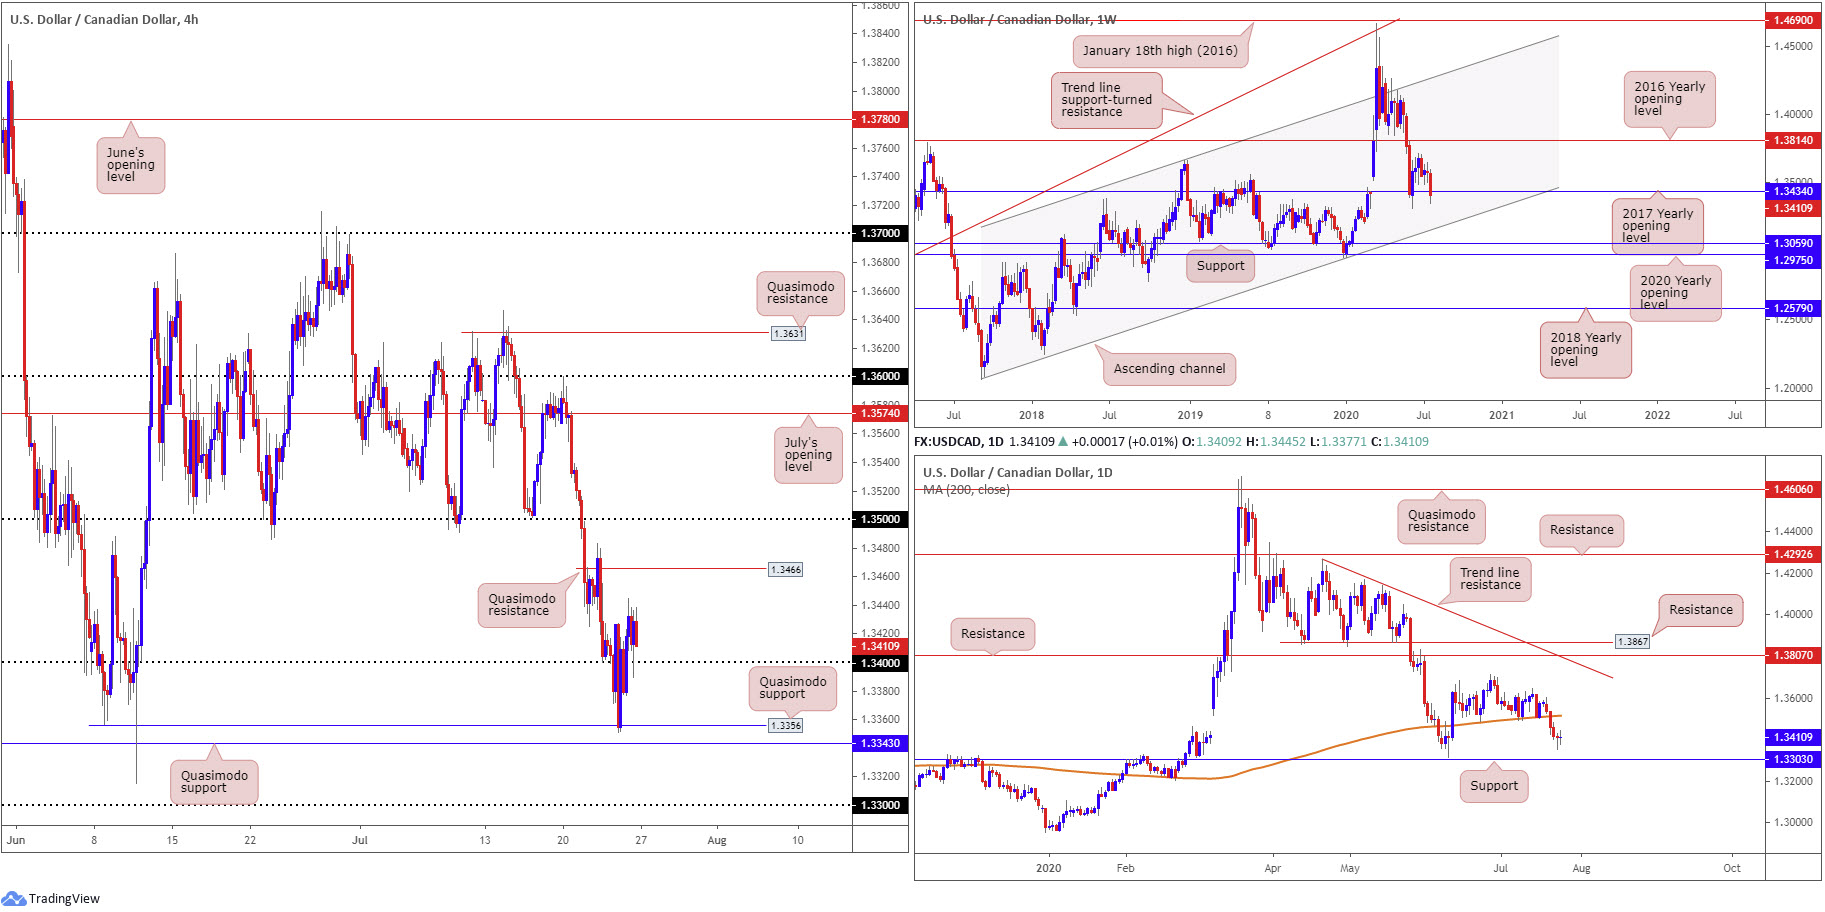
Support, by way of the 2017 yearly opening level, from 1.3434 remained in play into the close, albeit delivering a somewhat delicate tone. Below 1.3434, channel support, taken from the low 1.2061, can be viewed as the next potential floor. A USD/CAD bid, nevertheless, brings light to the 2016 yearly opening level at 1.3814 as resistance, with follow-through buying to try and tackle a dense block of supply between 1.4190/1.3912.
Daily perspective:
Viewing things from the daily timeframe reveals the 200-day SMA (orange – 1.3515) relinquished its position as support Tuesday, with follow-through action sinking things to lows at 1.3351 Thursday.
Thursday finished considerably off worst levels, with some traders labelling the day’s movement as a hammer pattern drawn ahead of support at 1.3303. Impetus lacked Friday, however, entering a subdued tone, forming a doji candlestick formation.
H4 perspective:
Crude oil modestly rebounded Friday, following Thursday’s 2.2% decline, while the US dollar index dipped through 94.50 and is poised to cross swords with 94.00.
The H4 candles, as you can see, maintained a position above the 1.34 handle, following Thursday’s recovery off Quasimodo support coming in from 1.3356. 1.34 withstood a downside attempt amid US hours on Friday, shining the limelight on a possible approach to Quasimodo resistance at 1.3466 this week, with a break exposing the 1.35 handle.
Areas of consideration:
According to chart studies, there’s scope for additional upside off 1.34 early week, having seen buyers tackling support on the weekly timeframe at 1.3434 (the 2017 yearly opening level). As highlighted above, the initial upside target falls in at Quasimodo resistance on the H4 at 1.3466.
1.35 is also an interesting point of possible resistance to watch this week, owing to its current connection with the 200-day SMA at 1.3515. Equally attractive is the 1.33 handle, given it converging with daily support priced in at 1.3303.
USD/CHF:
Weekly gain/loss: -1.97%
Weekly close: 0.9198
Weekly perspective:
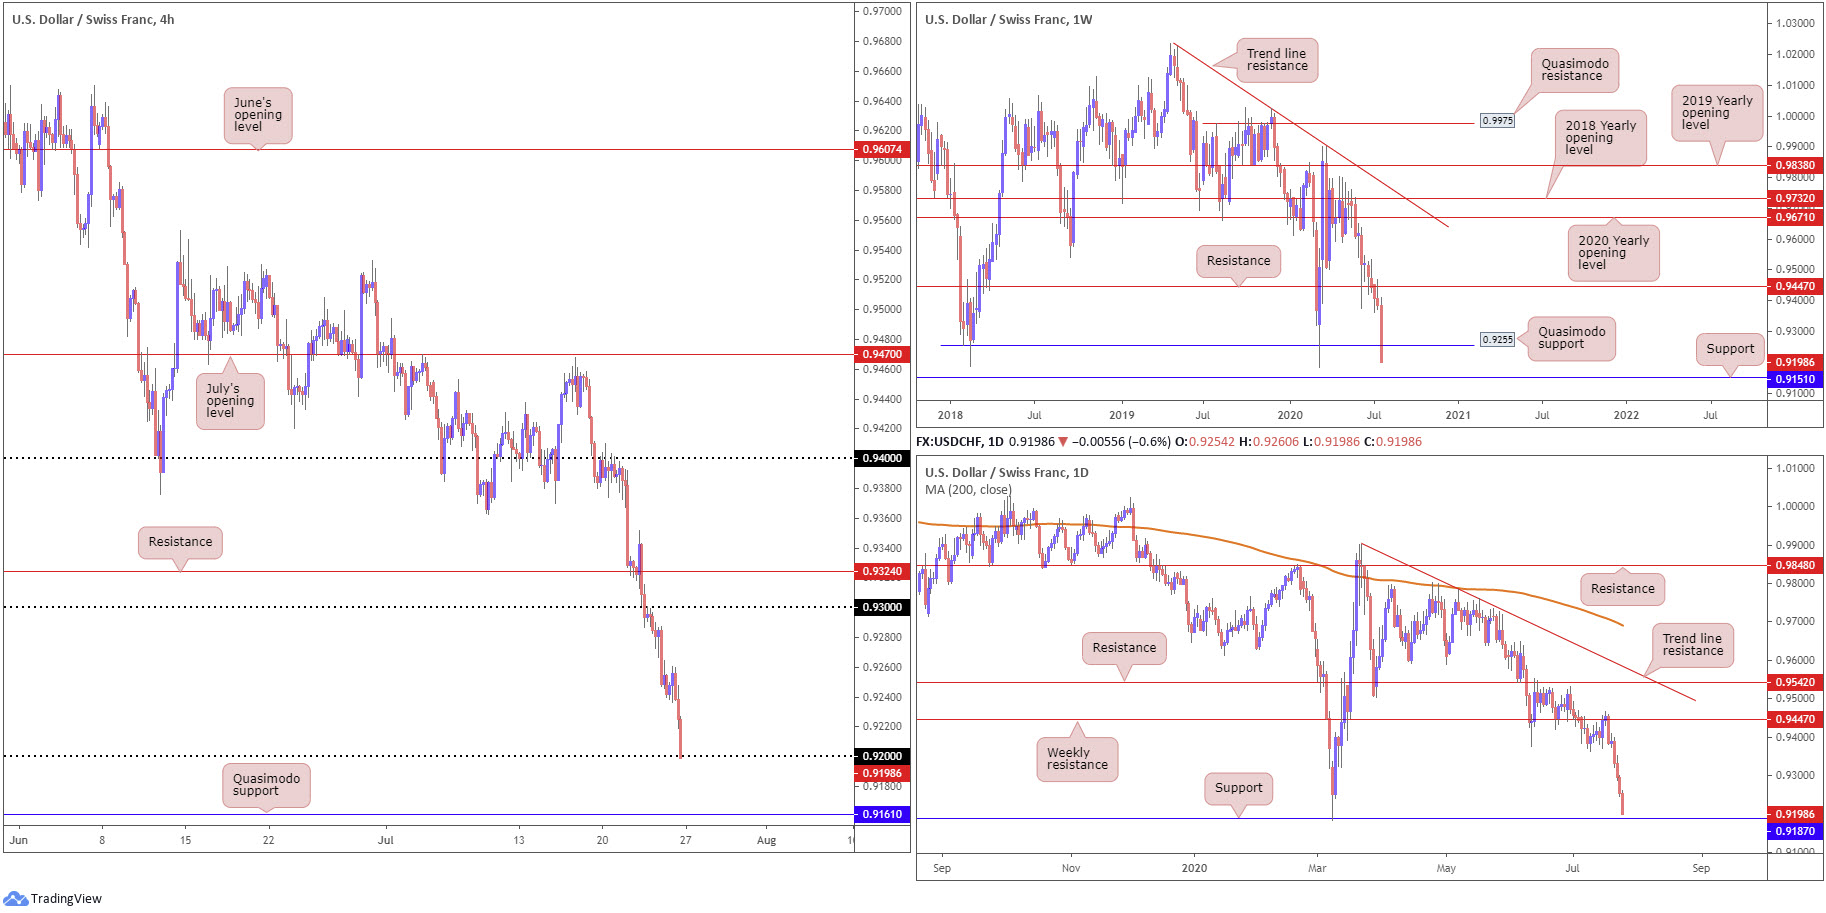
Last week’s precipitous decline south of resistance at 0.9447 directed USD/CHF 180 pips lower, delivering a near-full-bodied bearish candle that swept through Quasimodo support at 0.9255. Though without taking out the Quasimodo’s low point at 0.9187, the pattern remains valid.
In the event we do pop under 0.9187 this week, nearby support at 0.9151 could welcome the unit.
Daily perspective:
Following a decisive retest at weekly resistance drawn from 0.9447 the week prior, aside from a brief attempt at higher levels Monday, recent trade shaped four dominant bearish candles, with this week likely bound for support at 0.9187. The latter essentially represents the lower bracket of Quasimodo support on the weekly timeframe.
Pushing through 0.9187 this week, however, as highlighted above, shifts crosshairs to weekly support at 0.9151 and then daily support at 0.9072.
H4 perspective:
The US dollar added to the week’s heavy losses vs. the Swiss franc on Friday, with downward momentum, weighed by the US dollar index squeezing through 94.50 and increased demand for the safe-haven Swiss franc amid a decline in equities, hauling H4 price into the 0.92 handle by the close.
0.92, as you can probably see, echoes a vulnerable tone, with a break of this base uncovering Quasimodo support at 0.9161.
Areas of consideration:
Sell-stop liquidity stationed south of 0.92 appears to be calling for attention right now. The rationale behind this approach comes from the possibility of countertrend traders likely to attempt to fade the noted round number this week, having seen the level cap downside since June 2015. In addition, the daily timeframe proposes a drop to support at 0.9187 and weekly, assuming our Quasimodo support (0.9255) fails) to 0.9151 support.
Owing to the extremely oversold conditions right now, a fakeout through 0.92 could come to life today/early week and test daily support at 0.9187. A H4 close back above 0.92 may stimulate buying. Alternatively, a break of 0.92 and daily support at 0.9187 could steer intraday breakout sellers into weekly support at 0.9151, and by extension the H4 Quasimodo support at 0.9161.
Dow Jones Industrial Average:
Weekly gain/loss: -0.71%
Weekly close: 26447
Weekly perspective:
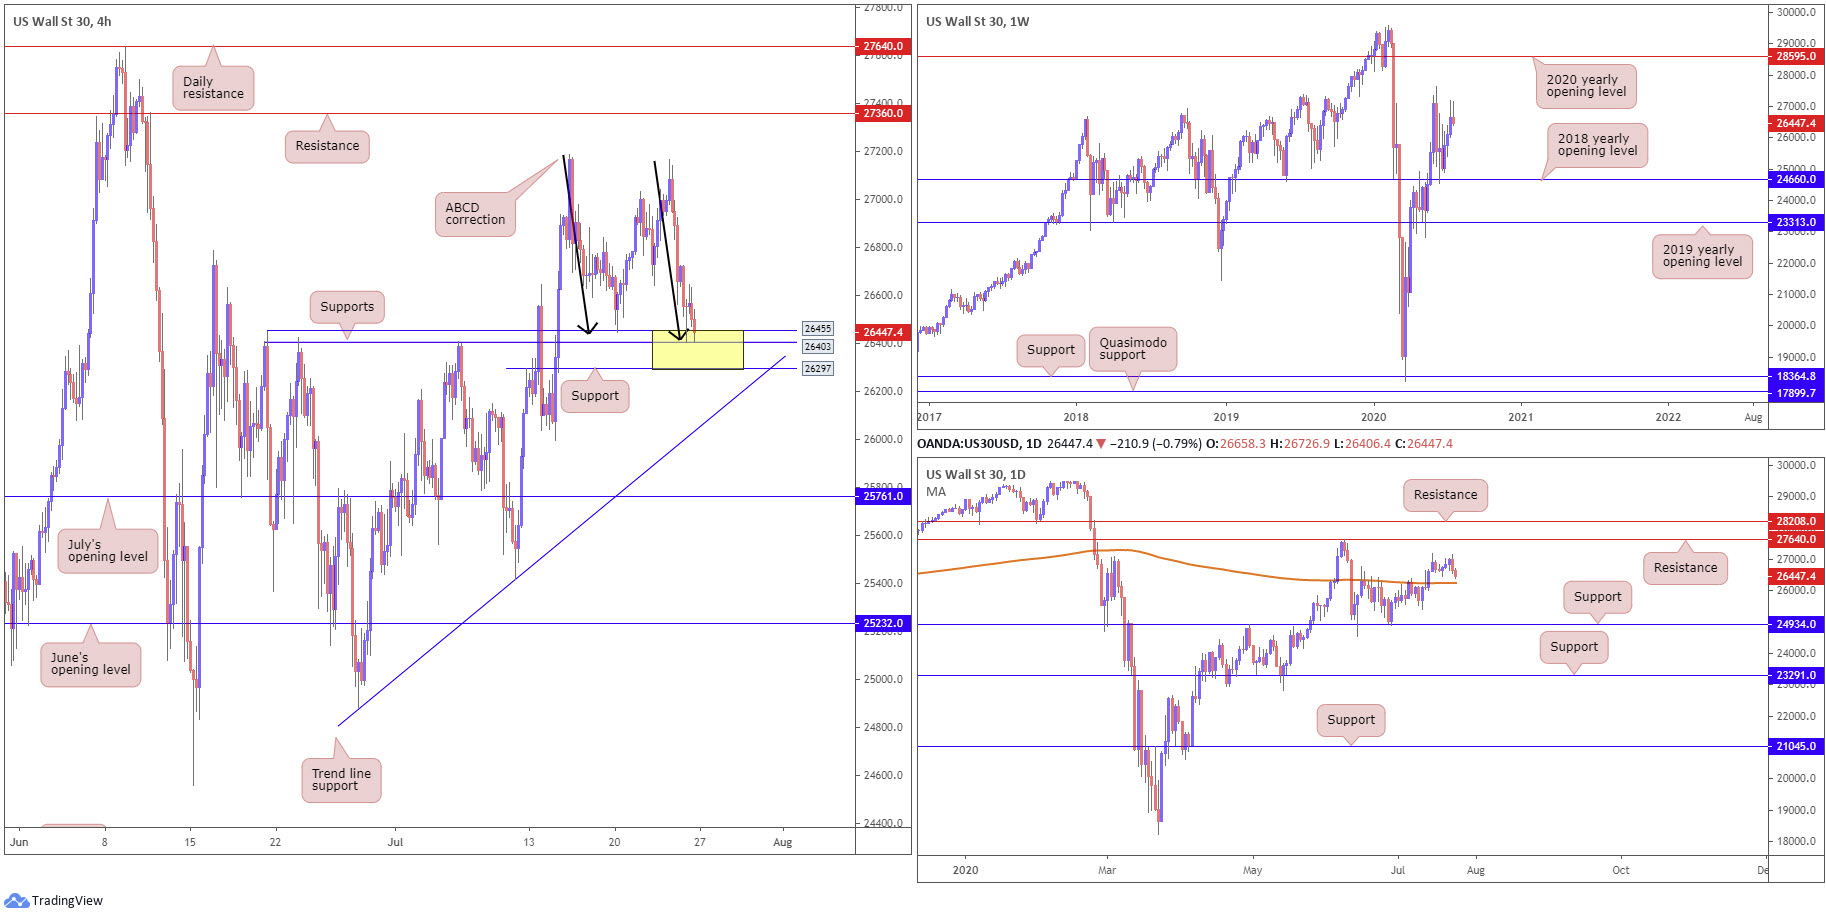
The 2018 yearly opening level at 24660 remains intact and is an important base of support to keep eyes on. Traders are likely to eventually pull in the 27638 high, despite last week’s modest pullback snapping a three-week bullish phase, followed by a possible run to the 2020 yearly opening level at 28595.
Daily perspective:
Since climbing above the 200-day SMA (orange – 26252) on July 14, daily price entered a rangebound environment, with the second half of last week emphasising the possibility of retesting the aforementioned SMA.
Despite this, the transition higher has shifted focus towards resistance at 27640.
H4 perspective:
US stocks extended Thursday’s retracement slide on Friday as investors digested mounting US/China tensions. The Dow Jones Industrial Average shed 182.44 points, or 0.68%; the S&P 500 dropped 20.03 points, or 0.62%, and the tech-heavy Nasdaq 100 concluded lower by 97.46 points, or 0.92%.
For technical traders who read Friday’s briefing you may recall the following (italics):
Technicians noted H4 price declined to levels just shy of a particularly interesting gathering of supports between 26297/26455 (yellow), an area which if tested completes an ABCD bullish correction (black arrows) at 26417. Areas of resistance to the upside can be seen at 27360, assuming we pass 27167 peaks.
Testing 26297/26455 on the H4 timeframe today is a possibility, perhaps sparking buying interest, having seen the area join with an ABCD correction. A rebound from the aforementioned zone is also reinforced by the fact we have room to navigate north on the higher timeframes.
Areas of consideration:
With 26297/26455 making an appearance Friday, this, as expected, gathered some buyer interest. The problem is, despite an early hammer candlestick pattern forming from the noted support, sellers had the advantage. This implies we may be in for a whipsaw through the zone this week, a move which could bring in the 200-day SMA at 26252 and H4 trend line support, taken from the low 24881, before any serious buyers consider making a show.
XAU/USD (GOLD):
Weekly gain/loss: +5.06%
Weekly close: 1901.6
Weekly perspective:
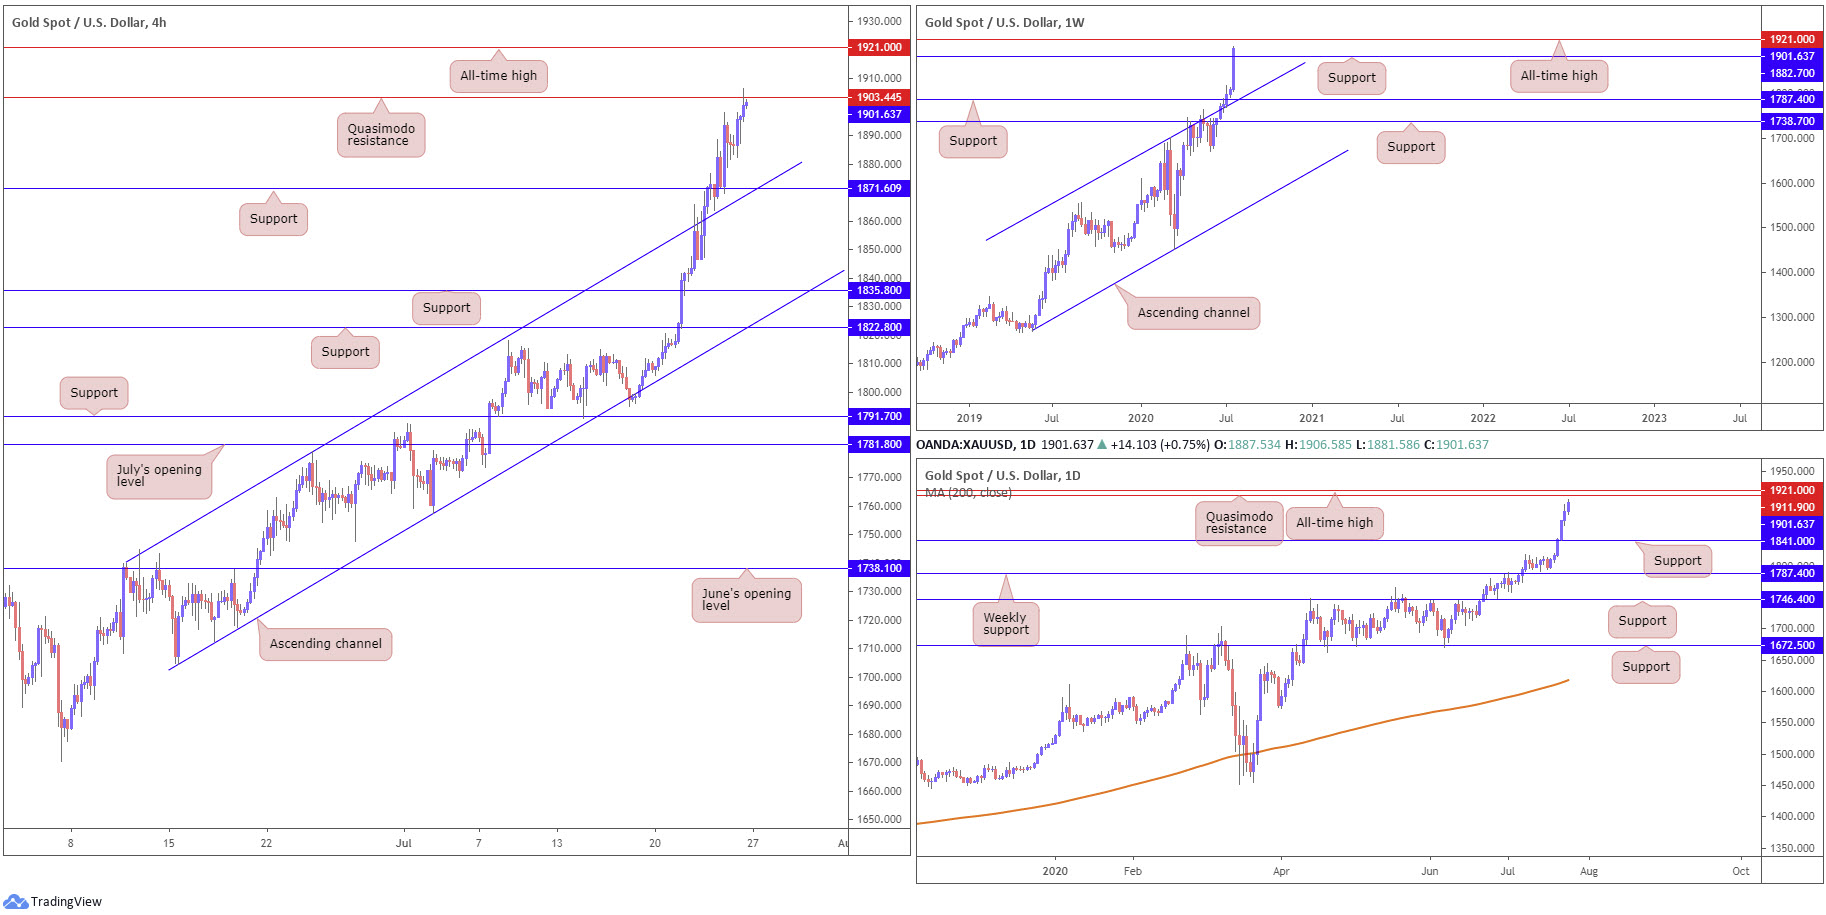
Bullion retained a strong underlying bid last week, inviting a bullish close above resistance at 1882.7 and recording a seventh consecutive weekly gain.
Thanks to an incredibly driven session last week, we are now within touching distance of shaking hands with the all-time high stationed at 1921.0. A crack above the latter this week could see buyers navigate unchartered territory.
Daily perspective:
After brushing aside resistance at 1841.0 during mid-week trade, buyers climbed to levels positioned just south of Quasimodo resistance at 1911.9, a base located just under the all-time high 1921.0.
H4 perspective:
The yellow metal pencilled in a sixth consecutive bullish session Friday, backed by persistent USD selling and safe-haven buying amid escalating US/China tensions.
Leaving support at 1871.6 unopposed, Friday leapt above Thursday’s session high at 1898.3 and engaged Quasimodo resistance coming in at 1903.4. As you can see, rupturing current resistance leads to all-time highs at 1921.0.
Areas of consideration:
The all-time high 1921.0 is a watched border this week. Countertrend traders, therefore, will likely monitor candle action for signs of exhaustion, a notable shooting star pattern or bearish engulfing candle, for example.
Decisively breaking the all-time high potentially fills breakout buyers’ orders and squeezes countertrend sellers out of the market. Conservative breakout traders, on the other hand, may still desire a retest at 1921.0 to form before pulling the trigger.
The accuracy, completeness and timeliness of the information contained on this site cannot be guaranteed. IC Markets does not warranty, guarantee or make any representations, or assume any liability regarding financial results based on the use of the information in the site.
News, views, opinions, recommendations and other information obtained from sources outside of www.icmarkets.com.au, used in this site are believed to be reliable, but we cannot guarantee their accuracy or completeness. All such information is subject to change at any time without notice. IC Markets assumes no responsibility for the content of any linked site.
The fact that such links may exist does not indicate approval or endorsement of any material contained on any linked site. IC Markets is not liable for any harm caused by the transmission, through accessing the services or information on this site, of a computer virus, or other computer code or programming device that might be used to access, delete, damage, disable, disrupt or otherwise impede in any manner, the operation of the site or of any user’s software, hardware, data or property.


