
Key risk events today:
Limited.
(Previous analysis as well as outside sources – italics).
EUR/USD:
Weekly gain/loss: +1.23%
Weekly close: 1.1857
Weekly perspective:
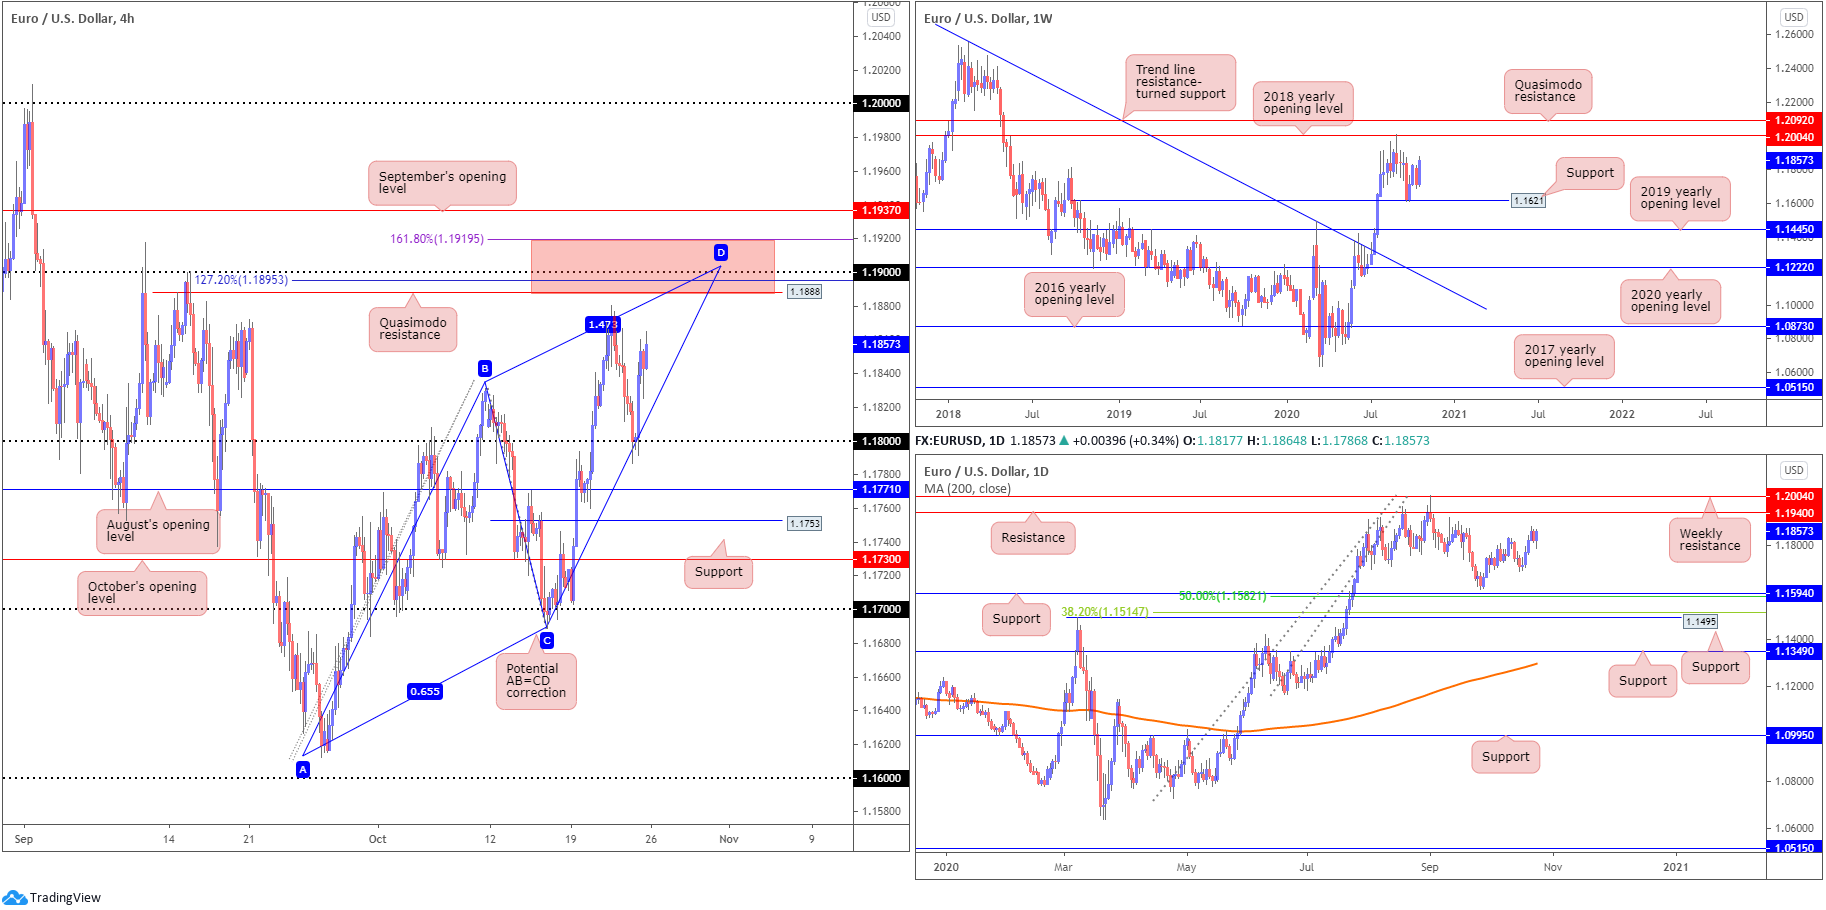
Since unseating trend line resistance (mid-July), taken from the high 1.2555, EUR/USD has mostly outlined an upside bias.
Buyers, however, as you can see, reduced speed after shaking hands with the 2018 yearly opening value at 1.2004 late August, enough to force a 1.1621 support retest (clearly interpreted by many as a dip-buying signal).
Sustained upside this week throws the 2018 yearly opening value back into the mix.
Daily perspective:
The technical position on the daily timeframe also exhibits scope to explore higher terrain this week, with little seen preventing bulls from taking a run at resistance coming in from 1.1940. It is also worth noting this base is sited just under weekly resistance mentioned above at 1.2004.
H4 perspective:
Surprisingly upbeat Eurozone manufacturing PMIs Friday, specifically out of Germany, provided enough fuel to rebound from the 1.18 handle.
Aside from last Wednesday’s session peak at 1.1880, H4 Quasimodo resistance at 1.1888 is considered the next upside target. What’s interesting here, nevertheless, is the level is sited close by a 127.2% Fibonacci projection point at 1.1895, the 1.19 handle, along with an AB=CD correction point at 1.1905 and a 1.618 BC projection plotted at 1.1919.
Should we manage to topple 1.1919-1.1888, on the other hand, September’s opening value at 1.1937 can be seen.
Areas of consideration:
- The H4 zone marked red between 1.1919/1.1888 is made up of a number of technical elements, highlighting strong resistance to be aware of this week.
- While the H4 area underlined above offers appeal, September’s opening value also on the H4 timeframe at 1.1937, given its connection with daily resistance at 1.1940, opens up the possibility of a fakeout forming through 1.1919 before sellers make an appearance.
- Beyond 1.1937, breakout buyers north of the level are likely to be fixed on the key figure 1.2000, which as you can probably see, merges with the 2018 yearly opening value on the weekly timeframe at 1.2004.
GBP/USD:
Weekly gain/loss: +0.97%
Weekly close: 1.3040
Weekly perspective:
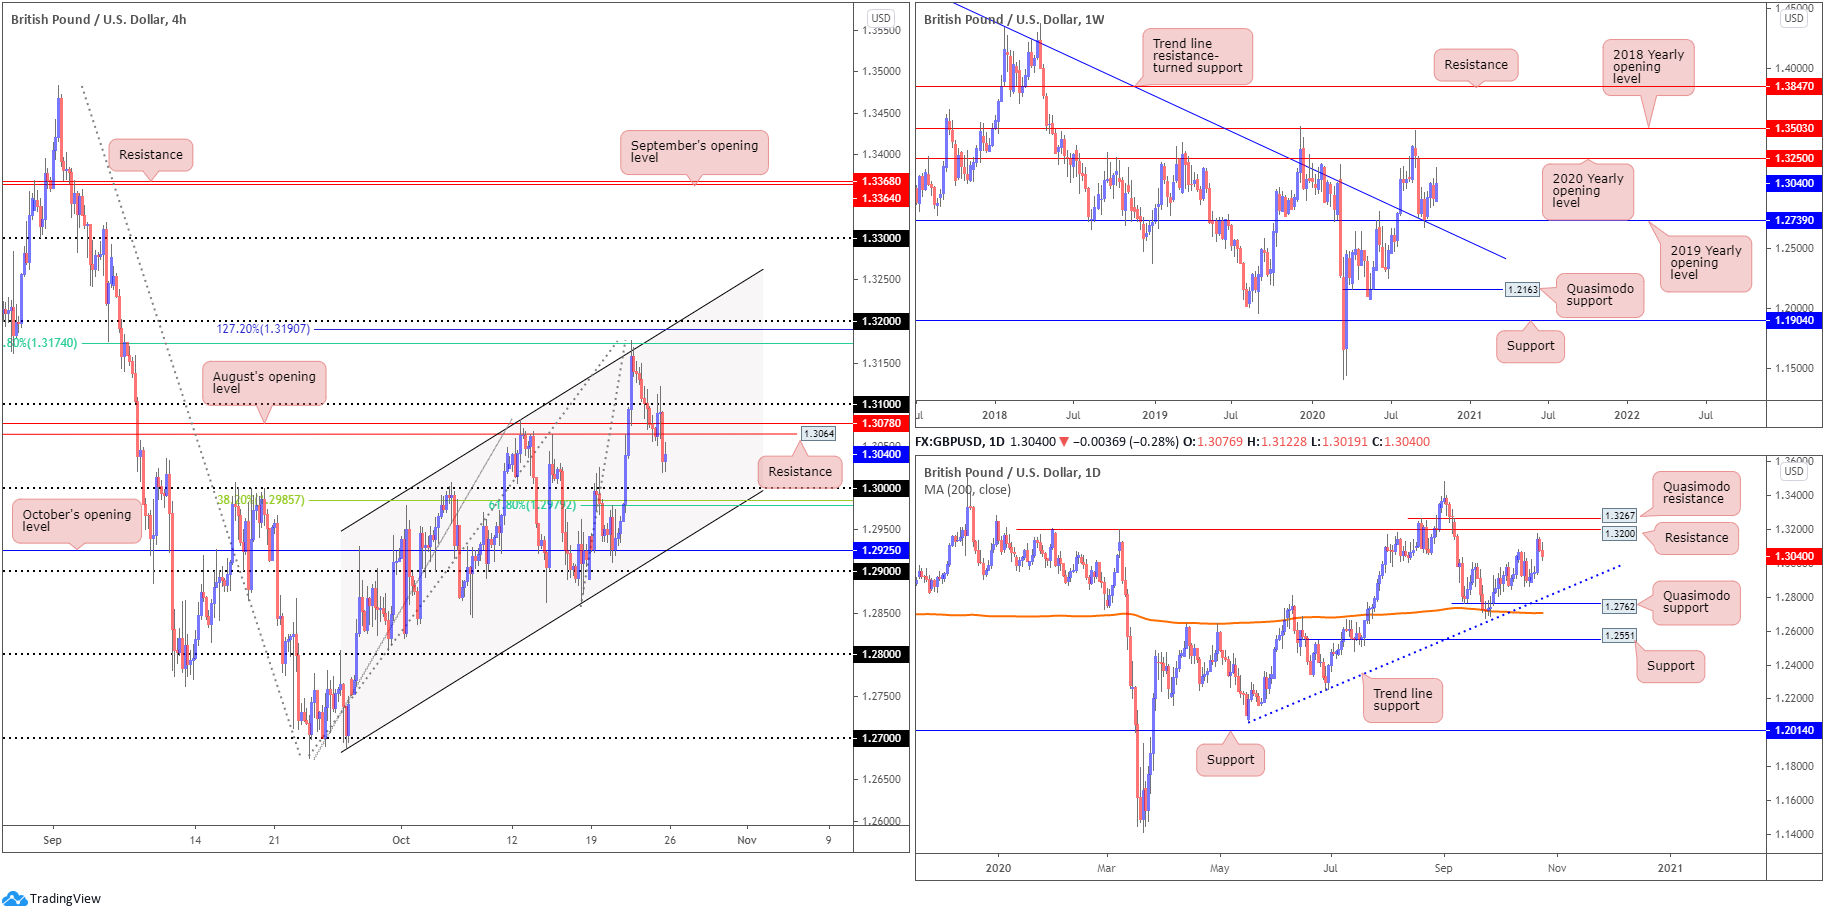
Although concluding off session highs, GBP/USD still finished the week on a relatively solid footing.
Following a bout of dip-buying off support at 1.2739 (a 2019 yearly opening value blending with trend line resistance-turned support, extended from the high 1.5930), weekly candles now target the 2020 yearly opening value at 1.3250. Should 1.2739 fail, nonetheless, the 1.2251 low (June 29) is in sight, shadowed by Quasimodo support from 1.2163.
It is also worth pointing out the aforementioned trend line was engulfed in late July this year, announcing an uptrend could be on the cards.
Daily perspective:
Price action on the daily timeframe hit the brakes a touch ahead of resistance from 1.3200 last week, a level pinned just south of Quasimodo resistance at 1.3267.
Diving to deeper waters this week shines the spotlight on trend line support, extended from the low 1.2075, with a break exposing Quasimodo support located at 1.2762 and a 200-day SMA (orange – 1.2707).
H4 perspective:
Unable to find grip north of the 1.31 handle Friday, despite coming off support at 1.3064 and August’s opening value at 1.3078, cable softened to lows just ahead of the key figure 1.30 and a nearby 61.8% Fibonacci retracement ratio at 1.2979, as well as a 38.2% Fibonacci retracement ratio at 1.2985.
Beyond the aforementioned supports, channel support, etched from the low 1.2687, is also seen as a reasonable base this week, together with October’s opening value placed at 1.2925.
Areas of consideration:
- The 1.30 handle has ‘fakeout’ written all over it. The 38.2% and 61.8% Fibonacci retracements plotted beneath 1.30 around 1.2980ish offer a support to consider. A bounce from the latter this week, followed up with a H4 close back above 1.30 is likely to be interpreted as a bullish signal, targeting at least 1.3064.
- H4 channel support is also likely to garner interest should we reach this far south, though whether the ascending level will be enough to stop price from reaching for October’s opening value at 1.2925 (or the 1.29 handle) is difficult to judge.
AUD/USD:
Weekly gain/loss: +0.81%
Weekly close: 0.7133
Weekly perspective:
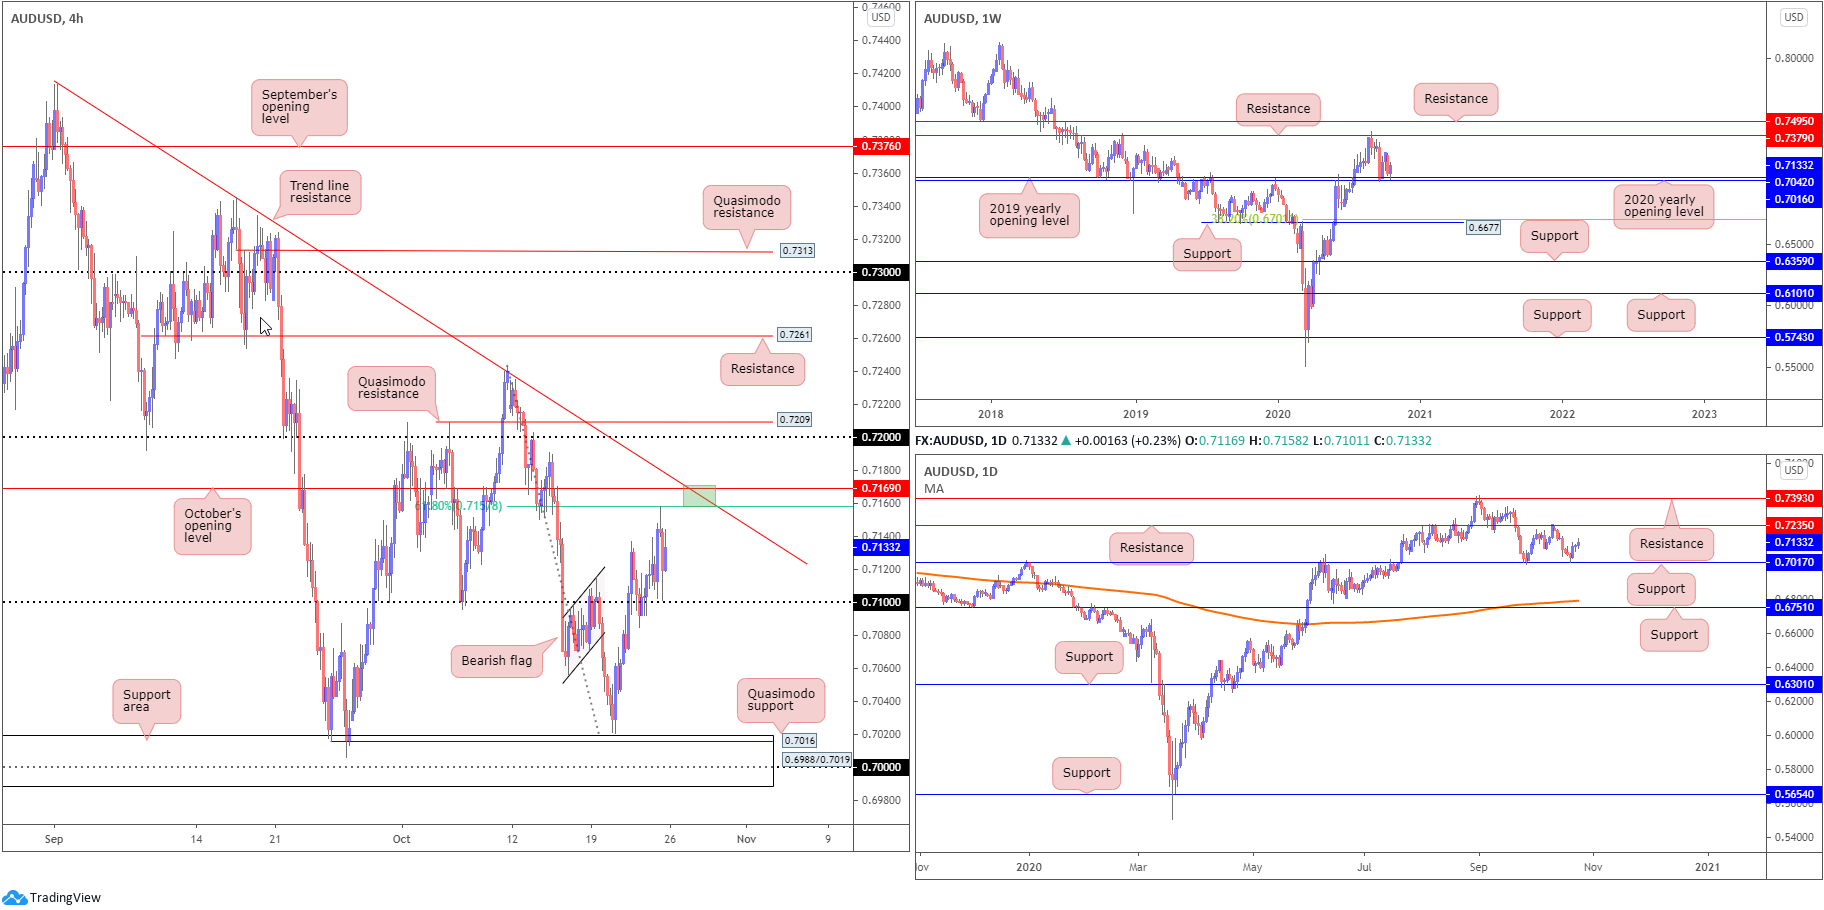
The combination of the 2020 (0.7016) and 2019 (0.7042) yearly opening values continues to be recognised as support on the weekly timeframe.
Resistance at 0.7379 lines up as the next upside hurdle should an advance materialise this week. It should also be pointed out that the trend in this market remains to the upside.
Failure to maintain position off 0.7016/0.7042 shifts motivation towards support plotted at 0.6677, and a corresponding 38.2% Fibonacci retracement ratio at 0.6701.
Daily perspective:
Following Tuesday’s hammer candle forming ahead of support priced in at 0.7017, AUD/USD rallied strongly Wednesday with Friday embracing peaks at 0.7158. This potentially sets the technical stage for another bout of buying, eyeing resistance plotted at 0.7235.
H4 perspective:
The Australian dollar capped off the week in positive territory against a softer buck, recently discovering support ahead of the 0.71 handle.
North, however, we can see Friday faded a 61.8% Fibonacci retracement resistance at 0.7157, plotted just south of October’s opening value at 0.7169 and a trend line resistance, formed from the high 0.7413.
Clearance of 0.7169 this week throws the 0.72 handle into the mix as possible resistance, closely shadowed by a Quasimodo resistance level at 0.7209.
Areas of consideration:
- Owing to the overall trend in this market, producing sizeable gains since early 2020, and the weekly and daily timeframes revealing thin resistance until reaching 0.7235 (daily), buyers perhaps enter the new week with the upper hand. 0.71 on the H4, therefore, remains a support to watch, in addition to a possible breakout scenario above October’s opening value at 0.7169.
- While north is likely to be the favoured direction this week, traders could still witness an intraday response from H4 trend line resistance (0.7413), due to 61.8% Fibonacci and resistance convergence (green).
USD/JPY:
Weekly gain/loss: -0.66%
Weekly close: 104.68
Weekly perspective:
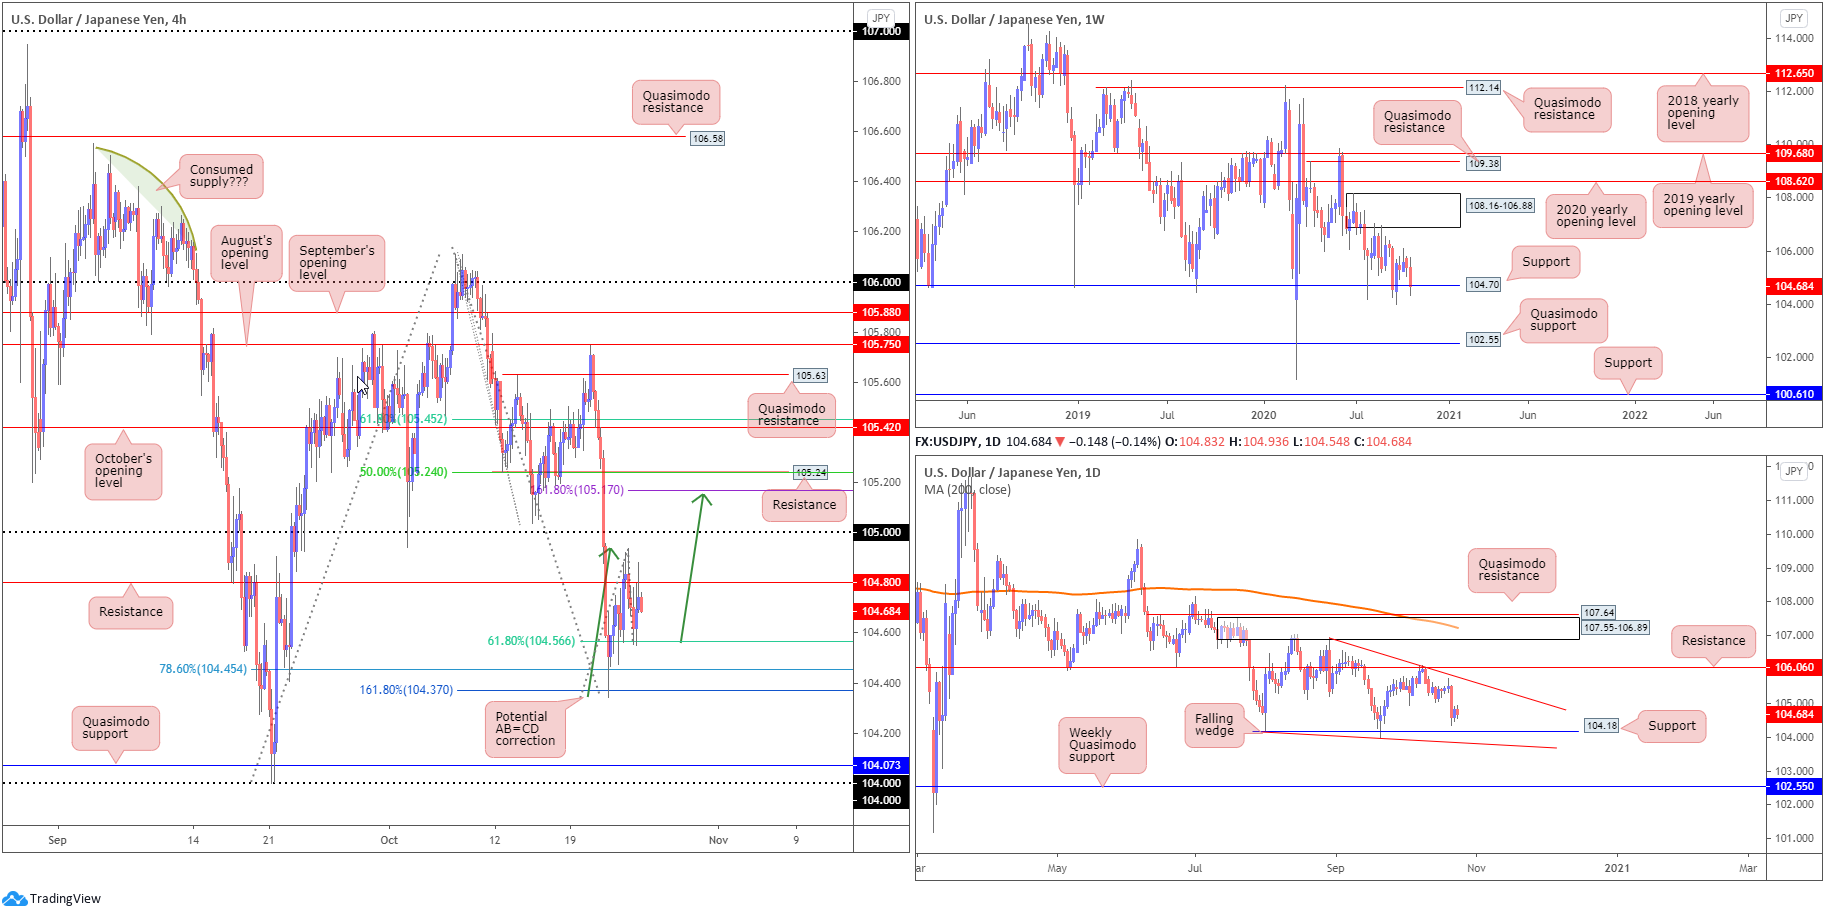
Down more than 60 pips, USD/JPY concluded the week at long-term support from 104.70. Though this may excite buyers, the level has failed to turn the dial in terms of bullish interest since early August, ultimately hindered by supply at 108.16-106.88.
Quasimodo support at 102.55 offers a feasible target beyond current support in the event we turn south this week, while removing the aforementioned supply draws the 2020 yearly opening value at 108.62 into the fight.
Daily perspective:
Movement on the daily timeframe is visibly compressing between two converging descending lines taken from 104.18/106.94, establishing a falling wedge pattern. Due to the series of lower lows and lower highs since March, the current falling wedge is likely to be interpreted as a reversal signal should a breakout higher take shape.
In addition to the wedge construction, support stands at 104.18 and resistance falls in around 106.06.
H4 perspective:
Buying from the 161.8% H4 Fibonacci projection point at 104.37 (and 78.6% Fibonacci retracement ratio at 104.45), levelled off in recent dealings, thanks to a correction in the US dollar index off peaks at 93.12. USD/JPY resistance at 104.80, as you can see, proved stubborn, capping upside twice during the second half of the week.
Although 104.80 remains in play, ‘bearishness’ off the level (possibly helped by ‘lower timeframe 61.8% Fibonacci support around 104.56) appears to be deteriorating. This perhaps shifts the spotlight towards 105 and neighbouring resistances overhead at 105.24 (connecting with a possible AB=CD bearish formation [green arrows] at 105.15 and 1.618 BC projection at 105.17) and October’s opening value at 105.42 (together with a 61.8% Fibonacci retracement ratio at 105.45).
Areas of consideration:
- The break of H4 resistance at 104.80, in light of weekly support at 104.70 holding position, could encourage an intraday bullish theme this week, targeting H4 resistances 105, 105.24, 105.42.
- H4 resistance at 105.24 and 105.42 are also interesting levels with respect to confluence; the former joins with a 50.0% retracement and nearby AB=CD resistance, while the latter boasts a connection with a 61.8% Fibonacci retracement at 105.45.
USD/CAD:
Weekly gain/loss: -0.47%
Weekly close: 1.3121
Weekly perspective:
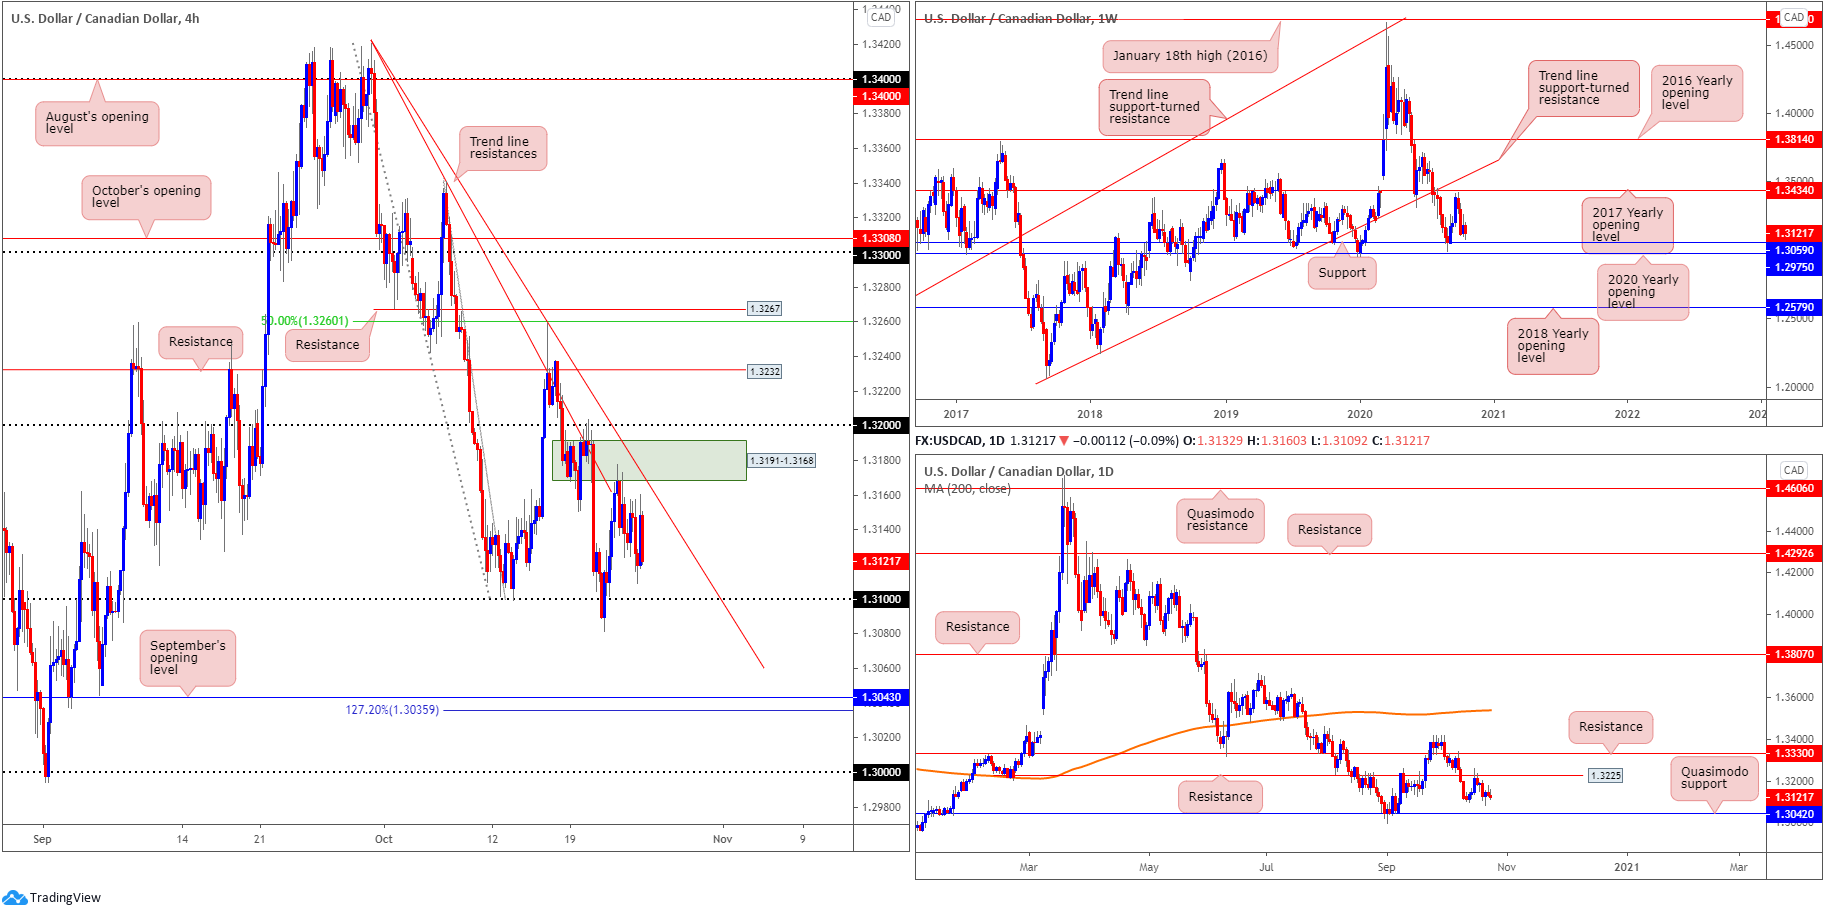
Despite shedding more than 2% south of the 2017 yearly opening value at 1.3434, longer-term activity established a floor ahead of support at 1.3059 (arranged above the 2020 yearly opening value at 1.2975) over the last couple of weeks.
Daily perspective:
Resistance at 1.3225 pushed its way into the spotlight mid-October and has so far held ground.
Though initial selling pressure was impressive, last week (specifically Wednesday onwards) witnessed a subdued tone form around 1.3135.
Should sellers regain a foothold this week, Quasimodo support at 1.3042 offers a reasonable target. Moves above 1.3225, on the other hand, could lead candle action to resistance at 1.3330.
H4 perspective:
A stronger-than-anticipated recovery from 1.31 saw price engage supply (green) around 1.3191-1.3168 in early trading Thursday (positioned beneath 1.32), which led to a slow grind lower into the week’s end. We also have two trend line resistances to work with, both pencilled in from the high 1.3420, though the inner line appears delicate.
Digging under 1.31 this week, however, will have traders’ crosshairs shift towards September’s opening value at 1.3043 (according to our charts), closely shadowed by a 127.2% Fibonacci projection point at 1.3036. Price readers will also acknowledge the aforementioned H4 supports converge closely with weekly support at 1.3059 and daily Quasimodo support priced at 1.3042.
Areas of consideration:
- With the higher timeframes displaying an absence of support until 1.3059 (weekly timeframe), an extension south of H4 supply at 1.3191-1.3168 could be seen this week, perhaps nudging under 1.31.
- Tunnelling under 1.31 on the H4 also unchains a potential fresh bearish theme, targeting 1.3059 as an initial take-profit zone, closely followed by September’s opening value at 1.3043 and daily Quasimodo support at 1.3042.
USD/CHF:
Weekly gain/loss: -1.19%
Weekly close: 0.9036
Weekly perspective:
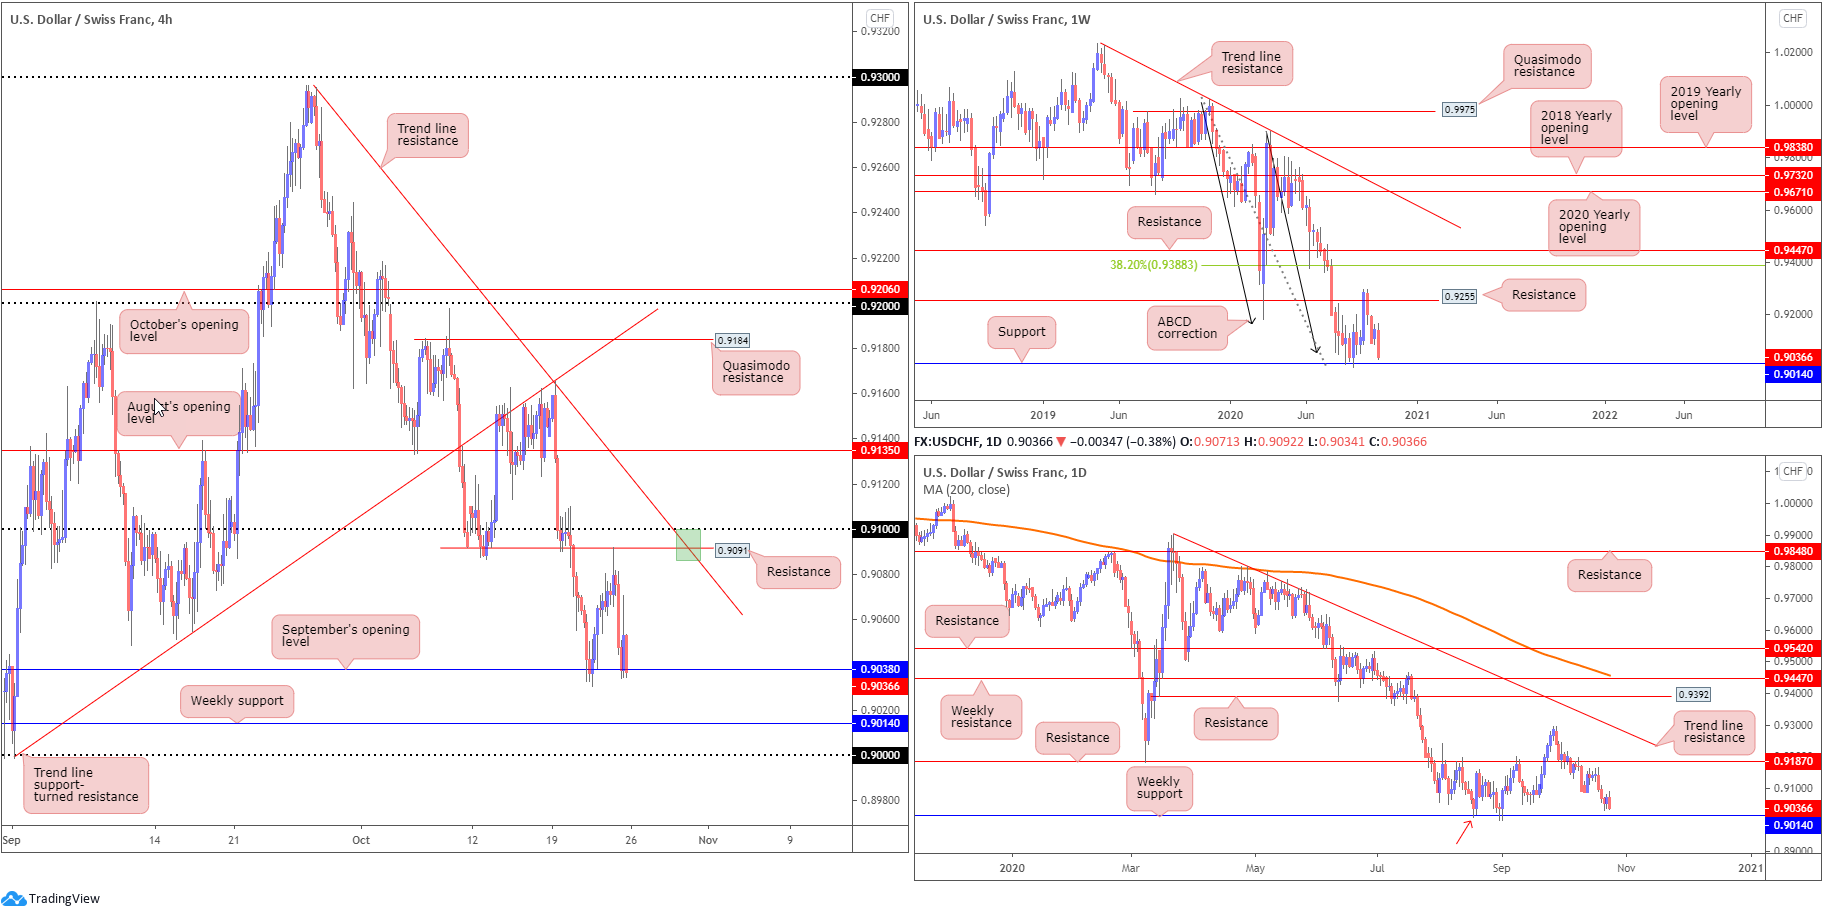
Erasing more than 100 points and closing out the week a shade off session lows, USD/CHF smothered the prior week’s recovery attempt and set price within striking distance of support at 0.9014. For those who read previous analysis on this pair, you will also note current support is bolstered by ABCD support at 0.9051 (black arrows).
Quasimodo support at 0.8692 is in view as the next downside objective should sellers bring down 0.9014 this week.
Daily perspective:
Closer analysis of price action on the daily timeframe also reveals the pair closing in on weekly support mentioned above at 0.9014, after failing to test resistance priced in at 0.9187.
What’s interesting is weekly support on the daily chart also represents a Quasimodo support (red arrow – left shoulder).
H4 perspective:
September’s opening value from 0.9038 echoed solid support mid-week, encouraging moves to resistance at 0.9091 (sited south of 0.91). Unable to penetrate 0.9091, buying pressure subsided into the closing stages of the week, gesturing a possible dip to weekly support featured above at 0.9014.
Blending current weekly support and the key figure 0.90 establishes a small, yet potentially highly reactive zone of support.
Areas of consideration:
- Intraday bearish themes developing south of 0.9038 may motivate lower-timeframe breakout strategies, with bearish eyes targeting 0.90 (lower-timeframe traders are unlikely to be aware of weekly support at 0.9014).
- Bullish scenarios are also possible out of 0.90/0.9014 this week. Conservative buyers, however, could seek additional confirmation (think bullish candlesticks or even lower timeframe setups off support) before pulling the trigger.
- Another scenario to be conscious of, should buyers welcome 0.9038 again, is a retest at the 0.9091 H4 resistance, particularly around the area marked in green combining H4 trend line resistance (0.9295) and the 0.91 handle (green).
Dow Jones Industrial Average:
Weekly gain/loss: -0.82%
Weekly close: 28316
Weekly perspective:
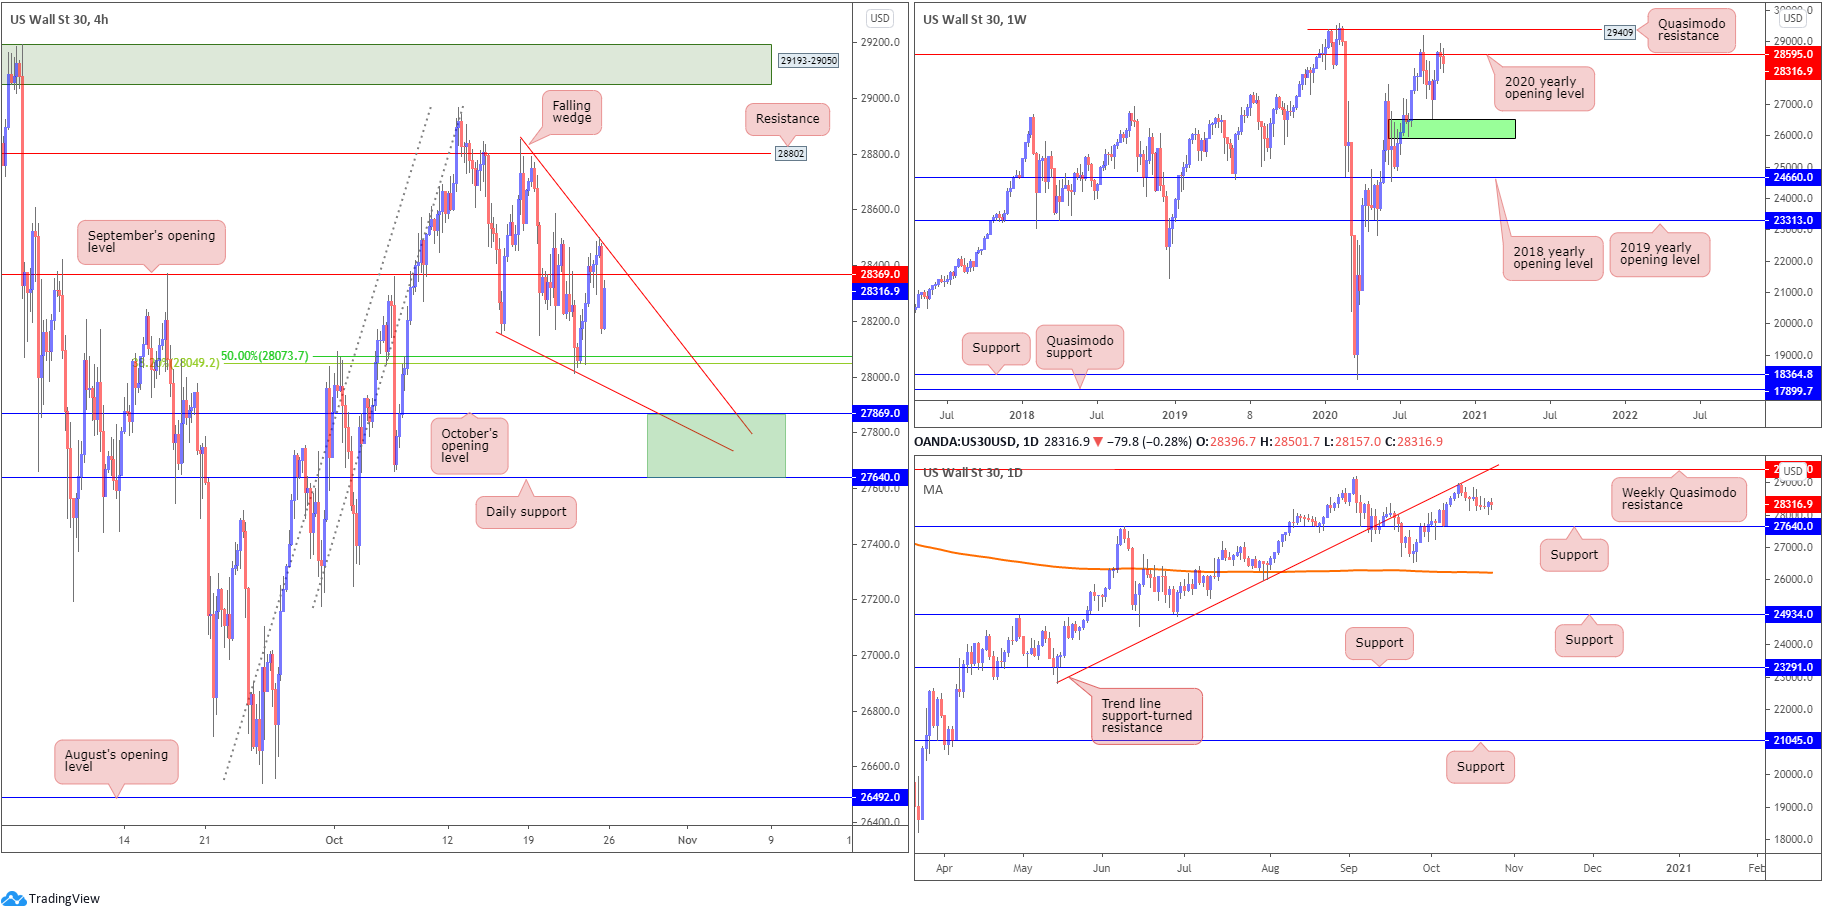
Price, based on the weekly timeframe, demonstrated moderate selling interest around 28595, a 2020 yearly opening value, over the past few weeks. This followed a robust two-week advance ahead of demand (green) at 25916/26523.
A break to higher land this week swings Quasimodo resistance at 29409 into the light as a possible target.
Daily perspective:
Daily price has, to some extent, emphasised a stationary tone since mid-October, following an earlier reaction off trend line support-turned resistance, extended from the low 22803.
Additional areas of focus on this scale can be found at support drawn from 27640 and the weekly Quasimodo resistance at 29409.
H4 perspective:
Uncertainty surrounding the next stimulus deal and upcoming election witnessed US equity benchmarks finish lower on the week.
Friday, nonetheless, had the Dow Jones Industrial Average drop 28.09 points, or 0.10%, the S&P 500 rally 11.90 points, or 0.34% and the Nasdaq trade higher by 42.28 points, or 0.37%.
On the technical front, a falling wedge is in the process of forming, taken from 28854/28155 (note we would have preferred the upper limit to have been drawn from 28967 though was not possible – we work with what we’re given).
September’s opening value at 28369 has largely been ignored as support/resistance, while Thursday saw buyers step in off a 38.2% Fibonacci retracement ratio and a 50.0% retracement ratio at 28073 (an area tucked above October’s opening value at 27869).
Areas of consideration:
- Breakout buyers north of 28369 on the H4 are clearly uncertain, knowing we have weekly resistance plotted at 28595.
- The H4 falling wedge could remain a central theme this week, with the possibility of further declines filling its space until reaching the zone marked in green between daily support (27640) and October’s opening level at 27869. An explosive move from this region, breaking the upper limit of the falling wedge, is likely to attract fresh longs.
XAU/USD (GOLD):
Weekly gain/loss: +0.14%
Weekly close: $1,902
Weekly perspective:
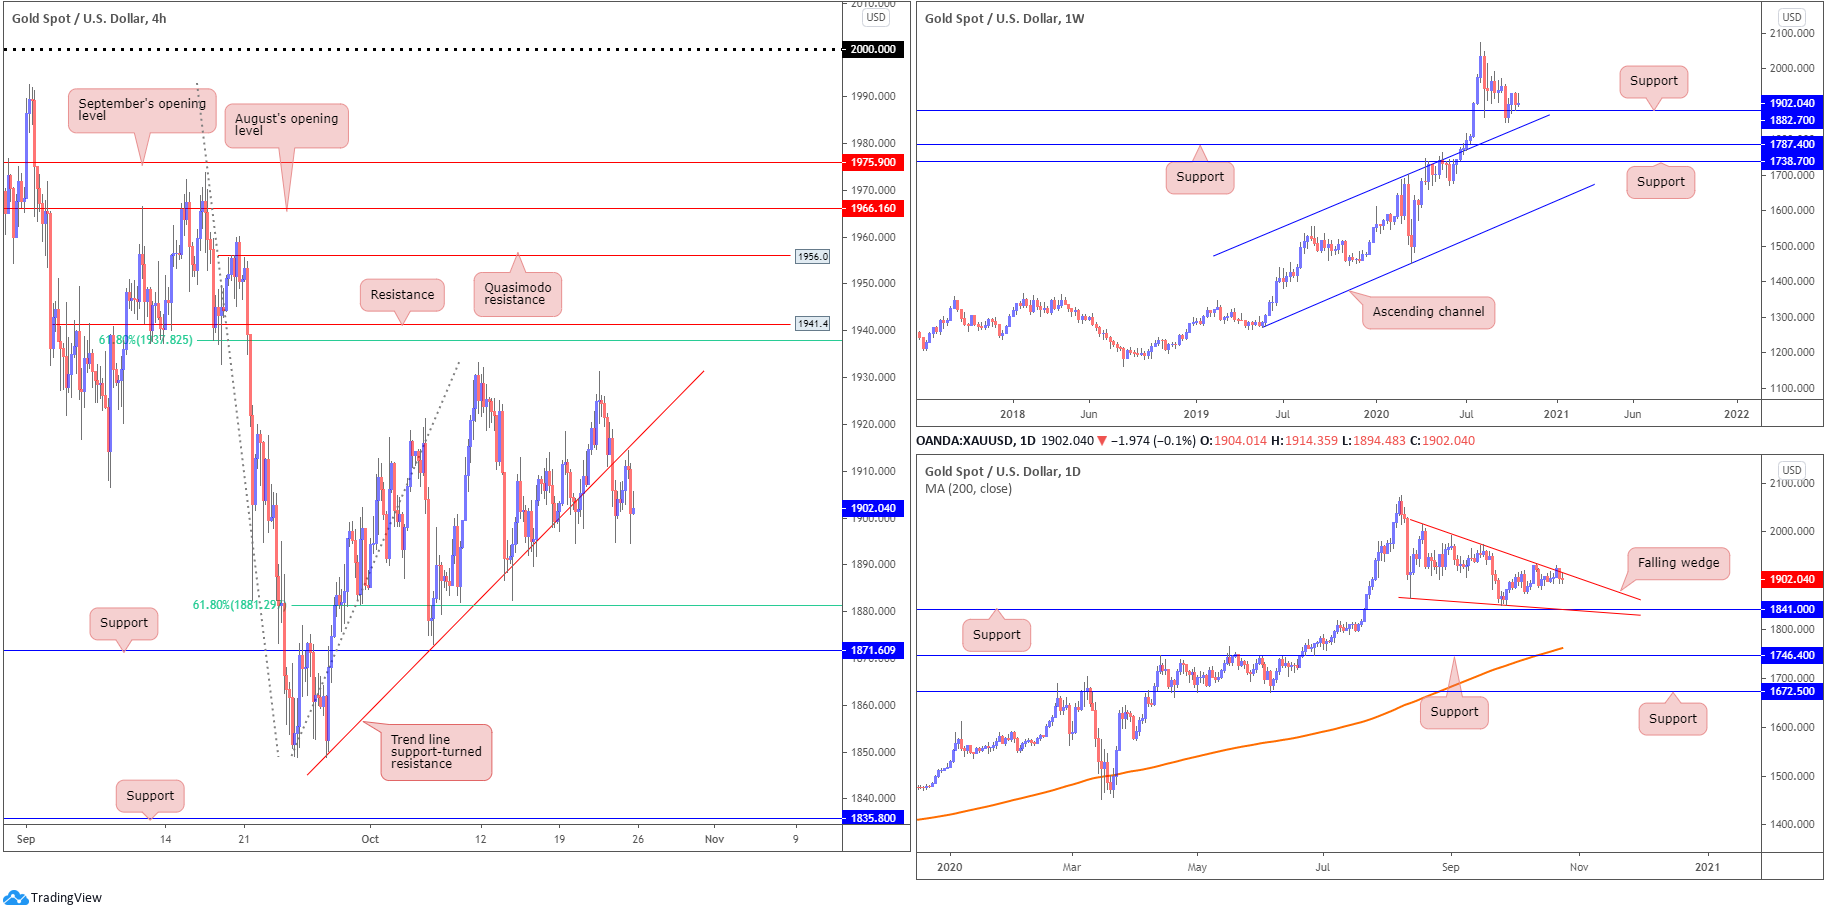
Buyers and sellers continue to battle for position around support at $1,882, fixed a touch above channel resistance-turned support, taken from the high $1,703. Note last week wrapped up off best levels.
While the immediate trend (higher since 2016) favours a bullish scenario here, the lack of buying interest seen from mid-August suggests a dip to the aforementioned channel support. Traders are also urged to pencil in supports at $1,787 and $1,738 in the event buyers fail to make an appearance.
Daily perspective:
Mid-week observed the daily timeframe challenge a descending resistance line, taken from the high $2,015. We also appear to be creating a falling wedge between $2,015 and $1,862 (the lower boundary also lines up closely with support at $1,841), which may be interpreted as a continuation signal in the event of a breakout north this week.
H4 perspective:
The technical landscape on the H4 chart shows price failed to challenge near-two-week peaks at $1,933 before tumbling Thursday and overthrowing trend line support, taken from the low $1,848. As you can see, a pullback occurred Friday, presumably to gather fresh sellers from the underside of trend line support (now a serving resistance).
This may have sellers work through local support around $1,895 this week and head towards the 61.8% Fibonacci retracement ratio at $1,881, followed by support at $1,871.
Areas of consideration:
Outlook mostly unchanged.
- The break of H4 trend line support helps confirm additional downside from the upper border of the daily timeframe’s falling wedge. Consequently, H4 sellers off trend line support-turned resistance could be targeting the $1,881/$1,871 region.
- Expecting much more of a move beyond $1,881/$1,871 is tricky since you’re then also dealing with weekly support at $1,882.
The accuracy, completeness and timeliness of the information contained on this site cannot be guaranteed. IC Markets does not warranty, guarantee or make any representations, or assume any liability regarding financial results based on the use of the information in the site.
News, views, opinions, recommendations and other information obtained from sources outside of www.icmarkets.com.au, used in this site are believed to be reliable, but we cannot guarantee their accuracy or completeness. All such information is subject to change at any time without notice. IC Markets assumes no responsibility for the content of any linked site.
The fact that such links may exist does not indicate approval or endorsement of any material contained on any linked site. IC Markets is not liable for any harm caused by the transmission, through accessing the services or information on this site, of a computer virus, or other computer code or programming device that might be used to access, delete, damage, disable, disrupt or otherwise impede in any manner, the operation of the site or of any user’s software, hardware, data or property.


