Key risk events today:
Limited.
(Previous analysis as well as outside sources – italics).
EUR/USD:
Weekly gain/loss: +0.75%
Weekly close: 1.0898
Weekly perspective:
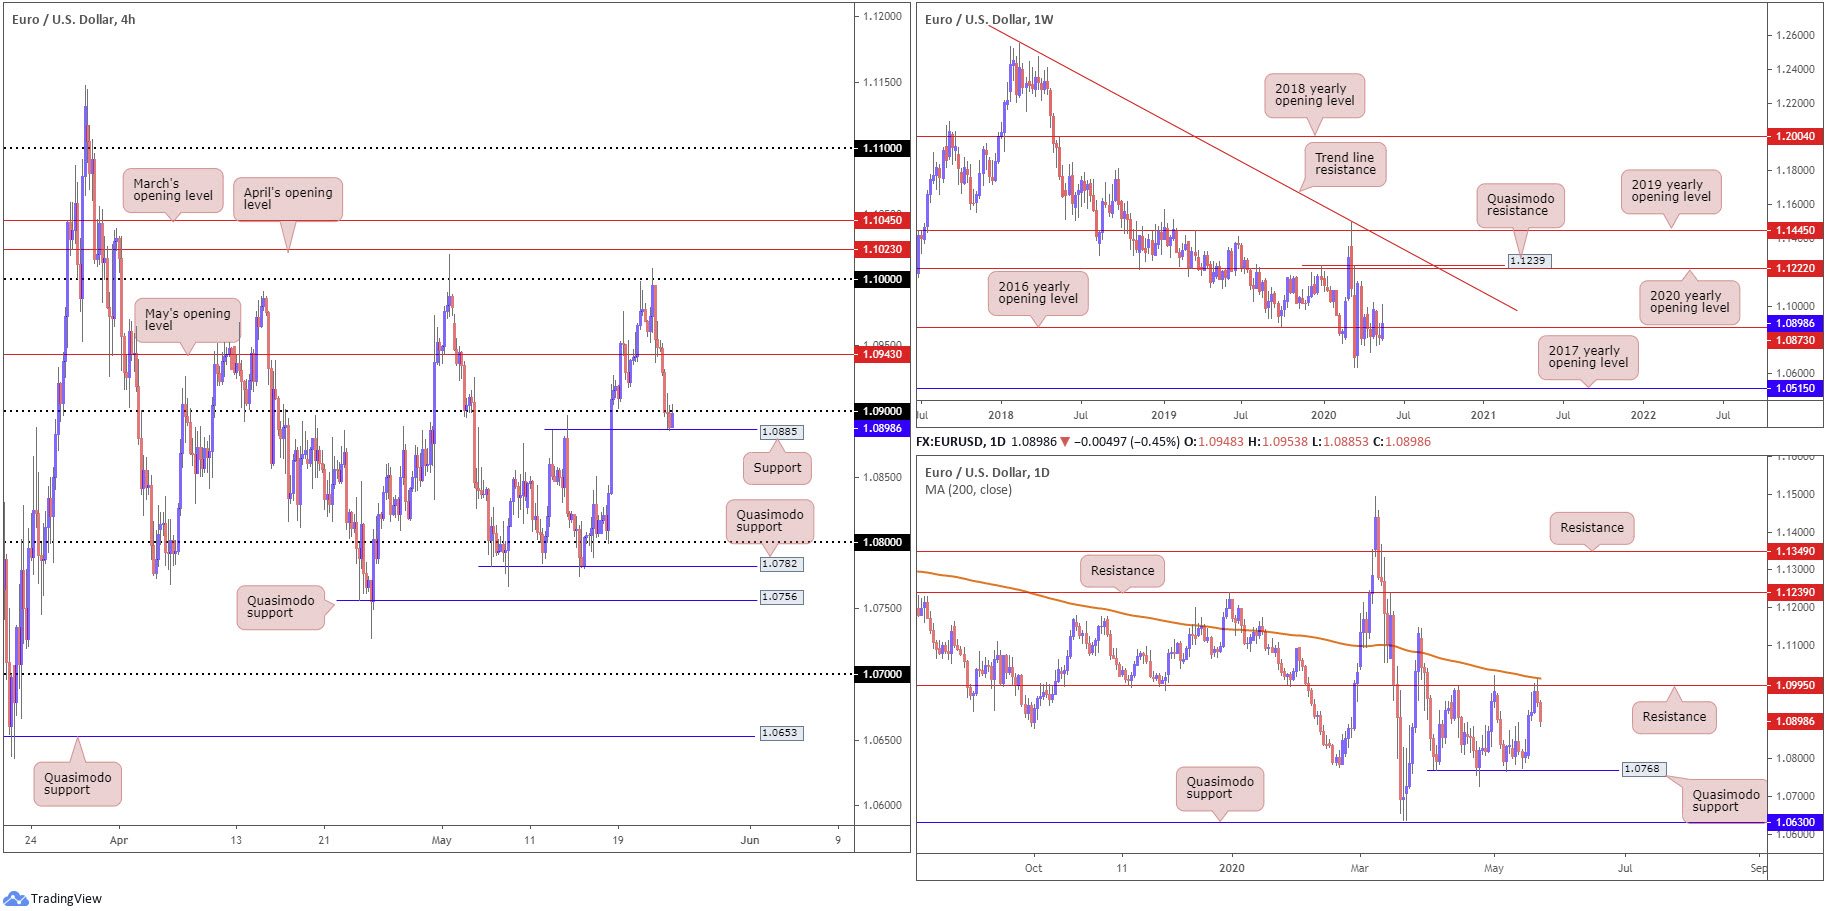
In spite of clocking session highs at 1.1008, the attempt to regain footing above the 2016 yearly opening level at 1.0873 was abruptly denied, consequently reclaiming a large portion of the week’s upside.
Major resistance on the weekly chart, however, is not expected to show itself until the 2020 yearly opening level at 1.1222, closely followed by Quasimodo resistance at 1.1239. A bump lower from here, on the other hand, could face multi-year lows at 1.0635.
With respect to the long-term trend, the pair has remained under weight since topping in early 2018.
Daily perspective:
Resistance at 1.0995, placed nearby the 200-day SMA (orange – 1.1012), checked upside at the tail end of the week, sending the pair to lows at 1.0885 Friday.
Traders may also want to note between Quasimodo support at 1.0768 and the aforementioned resistances this area has, since early April, carved out a consolidation.
H4 perspective:
Brewing angst between US and China provided fresh USD impetus Friday, extending recovery gains to peaks at 99.87, based on the US dollar index. This watched H4 candles on EUR/USD brush aside May’s opening level at 1.0943, tap into sell-stops south of 1.09 and draw in bids from local support at 1.0885 (a prior Quasimodo resistance level).
Beyond 1.0885, space towards the 1.08 handle is visible this week, positioned north of Quasimodo support at 1.0782, followed by another film of Quasimodo support at 1.0756.
Areas of consideration:
H4 price surpassing 1.09 and testing H4 support at 1.0885 is interesting. A decisive H4 close back above 1.09 may serve as a forerunner to additional gains this week, targeting May’s opening level at 1.0943 as an initial port of call and possibly the key figure 1.10.
The problem for buyers, however, is daily price fading resistance at 1.0995, with room seen to extend losses. Therefore, a H4 close under 1.0885 should not be a surprise and may be regarded as a bearish signal to approach 1.08. While some breakout sellers could attempt to enter short the breakout candle’s close, conservative traders will seek at least a retest under 1.0885/1.09 before committing.
In the event we reach 1.08 this week, keep an eye out for a fakeout through the round number to H4 Quasimodo support at 1.0782. A H4 close back above 1.08 will likely give buyers a shake.
GBP/USD:
Weekly gain/loss: +0.50%
Weekly close: 1.2161
Weekly perspective:
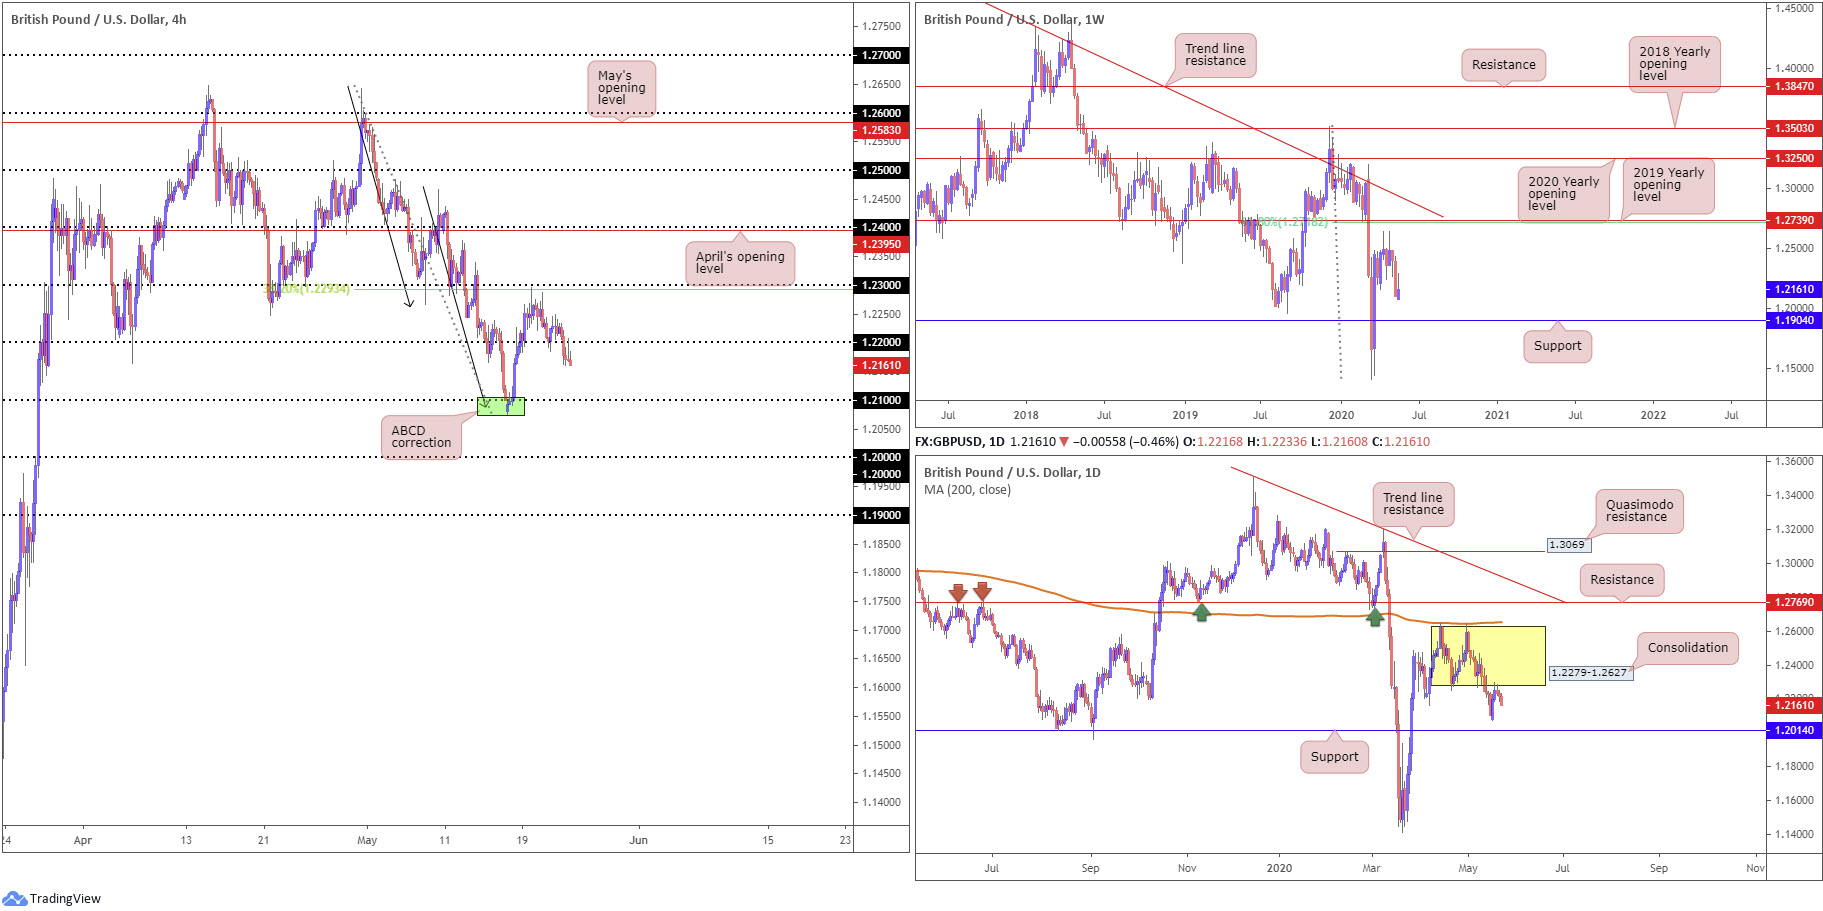
Support on the weekly timeframe positions itself at 1.1904, which could, thanks to an unsuccessful attempt at recovery last week, be welcomed into the frame in the near future.
Resistance falls in at 1.2739, the 2019 yearly opening level, and a 61.8% Fibonacci retracement ratio at 1.2718, sited close by a trend line resistance, extended from the high 1.5930.
Daily perspective:
The daily window observed sellers make a stand off range lows at around 1.2279 last week. This is a retest situation which could, assuming an engulf south of 1.2075 (May 18 low), drift towards support coming in at 1.2014, a level boasting history dating as far back as late 2016.
H4 perspective:
A combination of UK retail sales plunging to a record amount in April and increasing demand for the safe-haven buck amid US/China tensions, guided the British pound lower for a third successive session against the dollar Friday.
Friday tumbled through orders at 1.22, shining the spotlight on 1.21 as feasible support this week. Candlestick traders would have also noted a strong bearish selling wick formed off the underside of 1.22, potentially thrown in the pot as a sell signal.
Areas of consideration:
There are a number of technical elements supporting further selling this week. Primarily, we have weekly price denoting a floorless market until reaching support at 1.1904. On top of this, daily price turned off 1.2279, with room to approach at least 1.2075. Lastly, H4 price exhibits signs of weakness under 1.22, with 1.21 in view as a potential downside target. Sellers short from here will consider positioning protective stop-loss orders above 1.2208 on the H4 timeframe.
AUD/USD:
Weekly gain/loss: +1.88%
Weekly close: 0.6534
Weekly perspective:
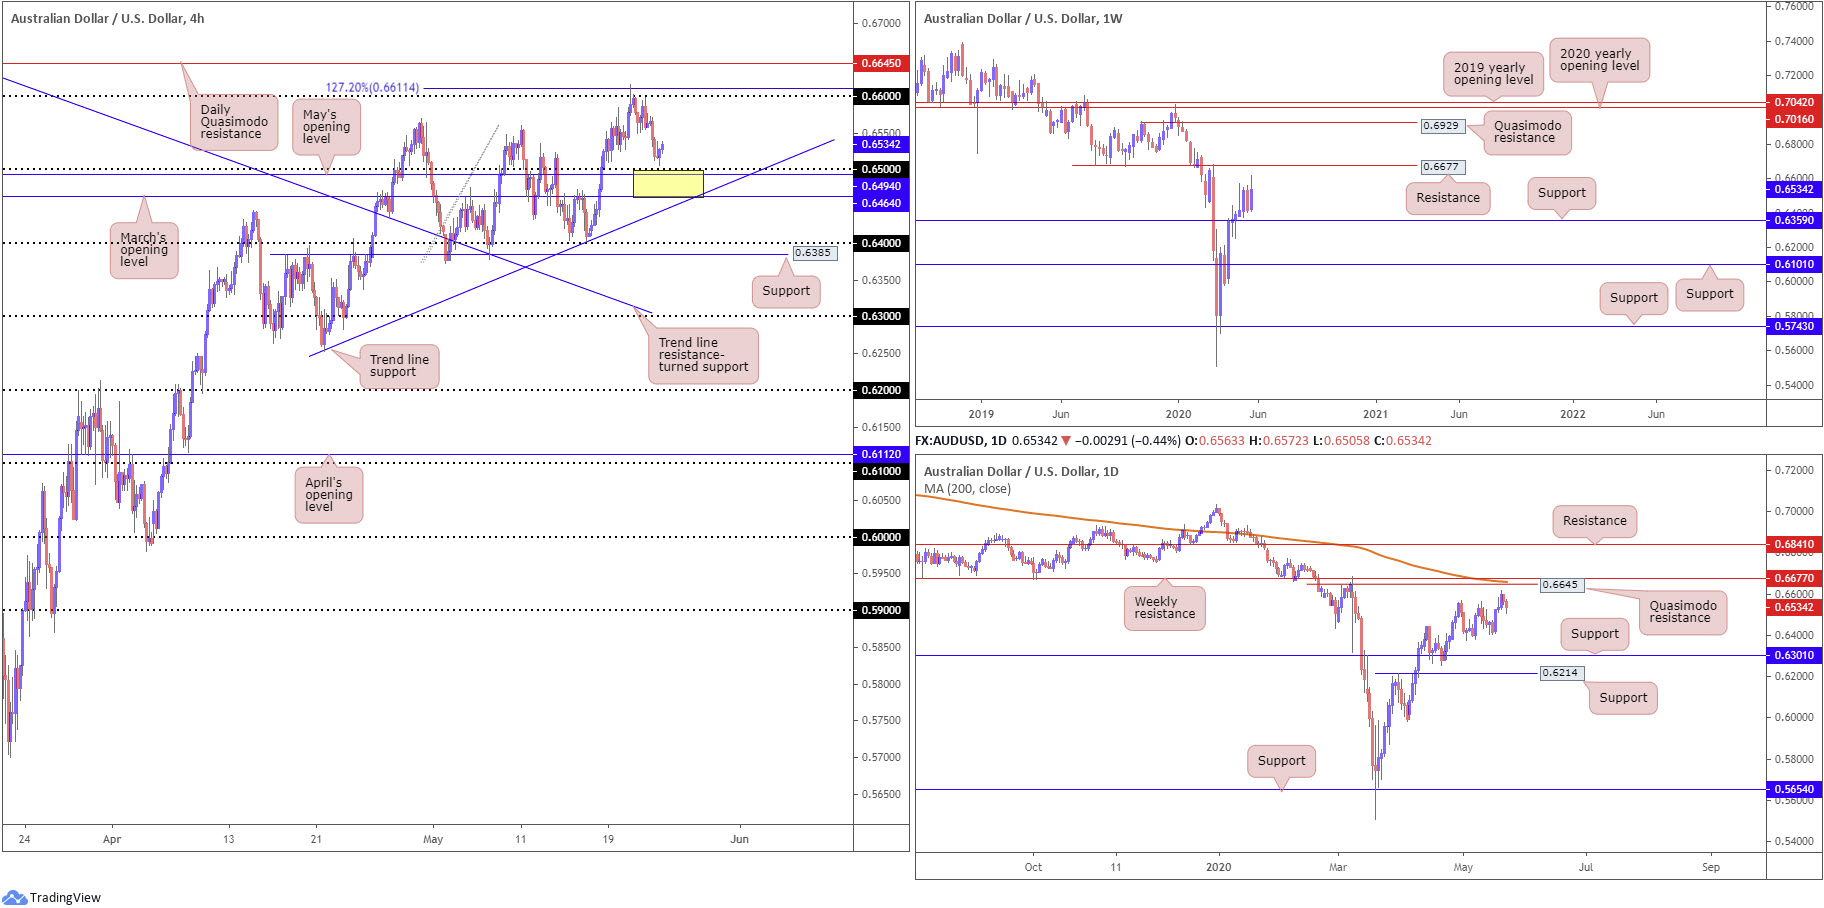
A few pips ahead of support coming in at 0.6359, long-term flow recently made a stance, bursting to peaks of 0.6616 and throwing resistance at 0.6677 in the pot as a potential upside base this week.
Overall, longer-term traders will also note we have been trending lower since the start of 2018, therefore recognising that the move from multi-year lows at 0.5506 could simply be a bulky pullback before attempting a run to fresh lows. Could 0.6677 be that level to hold back buyers and slide lower?
Daily perspective:
Technical structure on the daily timeframe had the April 30 high at 0.6569 taken last week, consequently highlighting a Quasimodo formation from 0.6645, parked just ahead of the weekly resistance level mentioned above at 0.6677 and a 200-day SMA (orange – 0.6658).
The 0.6402 May 15 low represents the next downside target on the daily scale, with a break underlining the 0.6372 May 4 low and support at 0.6301.
H4 perspective:
Downbeat risk sentiment checking demand for risk currencies and the US dollar index making a run for 100.00 Friday had AUD/USD extend downside from Wednesday’s peak at 0.6616, a move which tapped orders around the 0.66 handle and the 127.2% Fibonacci extension point at 0.6611.
A mild recovery was seen north of 0.65 Friday as we transitioned into US hours, based on the US dollar index marginally pulling off highs at 99.87. Additional support rests at May’s opening level from 0.6494, closely followed by March’s opening level at 0.6464 and a trend line support, extended from the low 0.6253. Beyond here, 0.64 is seen as a possible ‘floor’, along with support coming in at 0.6385.
Areas of consideration:
The intraday window could have buyers make a stand out of 0.6464/0.65 on the H4 timeframe this week (yellow). However, it’s worth noting the base contains zero higher-timeframe confluence, therefore, may discourage some traders.
Any sustained move beneath 0.6464/0.65 may spark breakout strategies to 0.64.
Should 0.66 come under fire, daily Quasimodo resistance at 0.6645, 200-day SMA at 0.6658 and weekly resistance at 0.6677 offers a potent combination of resistance to play with this week.
USD/JPY:
Weekly gain/loss: +0.49%
Weekly close: 107.60
Weekly perspective:
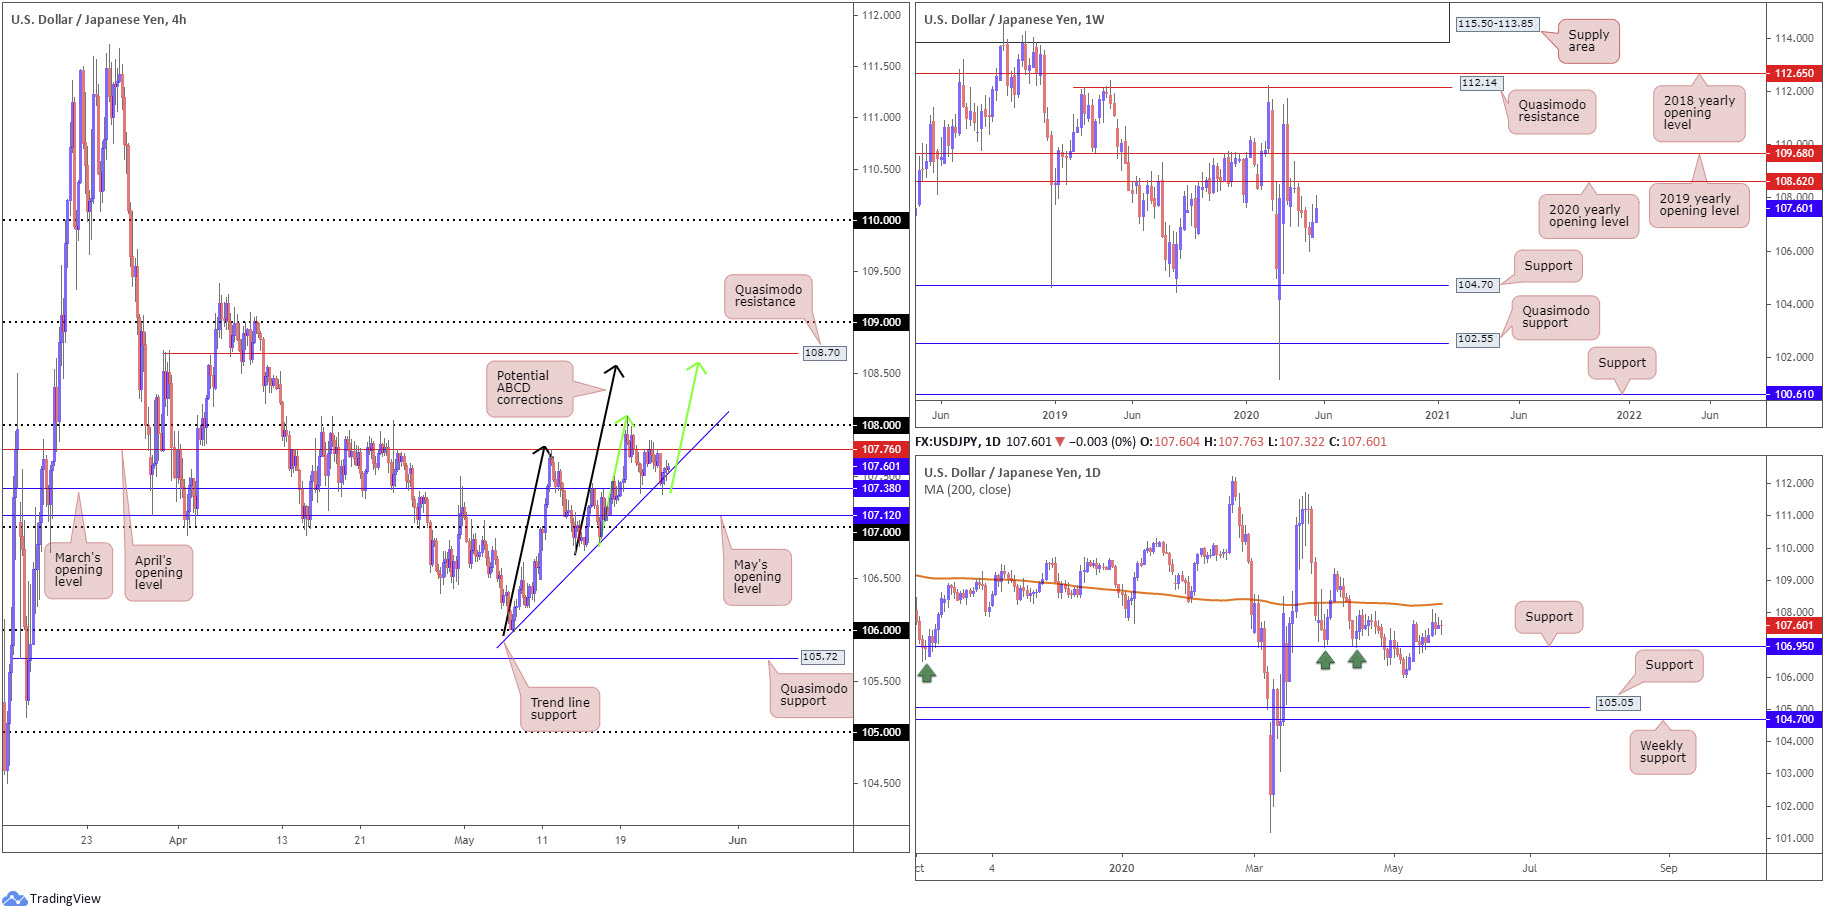
Following two consecutive weeks of gains, price action concluded last week close by the 2020 yearly opening level at 108.62. Continued bidding, moves that overthrow sellers at 108.62, nudges the 2019 yearly opening level at 109.68 into sight.
A rotation to the downside from current price, however, has support at 104.70 to target.
Daily perspective:
Technical action on the daily timeframe recently shook hands with support at 106.95, after dipping from three-week tops at 107.76.
Mid-week onwards saw price kicking its heels within striking distance of the 200-day SMA (orange – 108.27), with a break exposing the 109.38 April 6 high.
H4 perspective:
On one side of the coin, mounting US/China concerns promoted the safe-haven Japanese yen Friday. On the other side of the coin, however, increased demand for the USD capped losses.
What we did see, from a technical standpoint, is a mild fakeout through trend line support, taken from the low 105.98, into March’s opening level at 107.38. A rally from here will likely see April’s opening level at 107.76 make an entrance, followed by 108. Also of interest, above 1.08, two ABCD bearish patterns (black/green arrows) merge around 108.60ish, sited just south of Quasimodo resistance at 108.70.
Areas of consideration:
The rebound off 107.38 is likely to find opposition from 107.76, though a break to 108 is, of course, also a possibility.
A fakeout through 108 into the 200-day SMA at 108.27 is a potential scenario this week, possibly interesting sellers. Buy-stops contained above 108 will likely provide enough fuel to sell. Conservative traders, though, may seek a H4 close back beneath 108 before committing.
The H4 ABCD corrections at 108.60 also marks an interesting reversal zone this week, an area boasting a close relationship with H4 Quasimodo resistance at 108.70 and weekly resistance at 108.62 (the 2020 yearly opening level).
USD/CAD:
Weekly gain/loss: -0.72%
Weekly close: 1.4004
Weekly perspective:
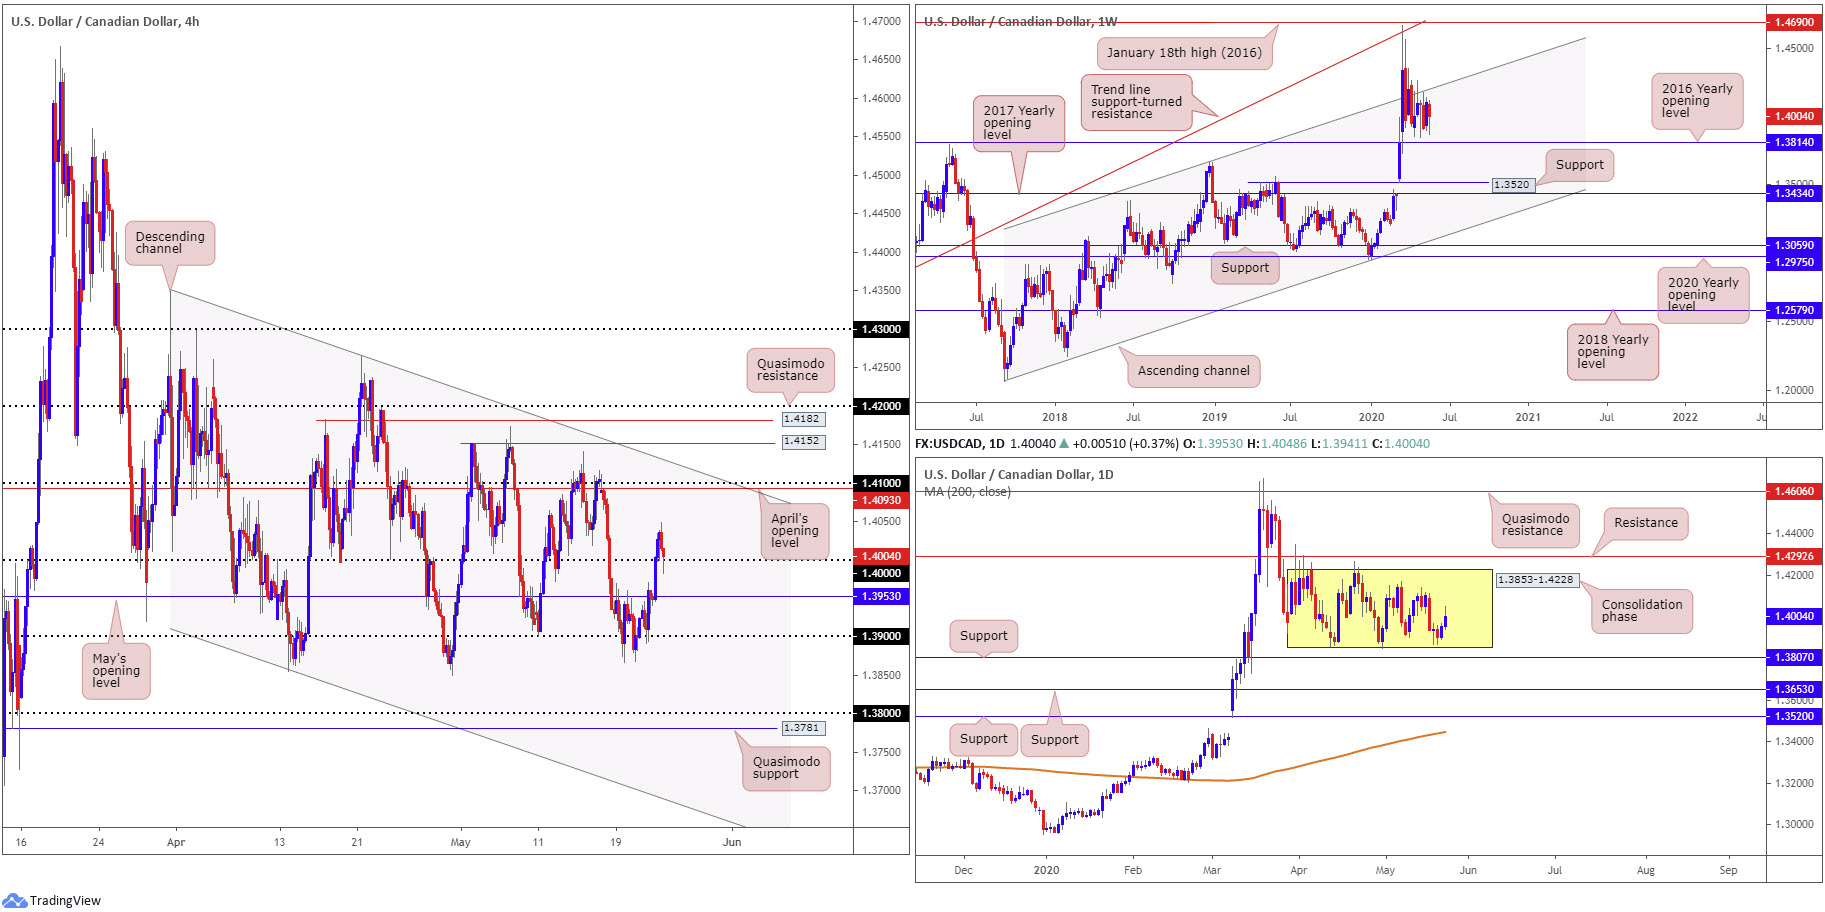
Since late March, buyers and sellers have been battling for position between a long-standing channel resistance, taken from the high 1.3661, and the 2016 yearly opening level at 1.3814. The said base stands in a reasonably healthy position as, overall, we’ve been trending higher since September 2017.
Daily perspective:
Since April, price action has been carving out a consolidation between 1.3853-1.4228 – current price trades above range lows, though off best levels at 1.4048.
Outside of the range, resistance is drawn from 1.4292 and support can be found at 1.3807. In addition, traders will note the 200-day SMA (orange – 1.3445) has been drifting northbound since March.
H4 perspective:
Friday reported retail sales out of Canada plummeted by the most on record, hit by the COVID-19 pandemic.
Statistics Canada noted:
Retail sales fell for the first time in five months, plunging 10.0% to $47.1 billion in March. This drop is the largest on record and is comparable to the retail sales decline observed in the United States (-7.1%) and other countries in the wake of COVID-19. As a result of this pandemic, many Canadian retailers shut down operations mid-month, curtailed hours and customer flow in the stores that remained open, all of which contributed to changes in the shopping habits of consumers.
Dismal retail sales lifted USD/CAD in relatively strong fashion Friday, eventually reaching highs at 1.4048, before turning lower and retesting the key figure 1.40, amid a modest rebound in crude oil off lows at $30.73/bbl.
Areas of consideration:
Going into the new week, it appears H4 action is gearing up for a defensive move off 1.40, closing in the shape of a hammer candlestick signal. Upside from here has April’s opening level from 1.4093 to consider, followed by 1.41.
Under 1.40, May’s opening level at 1.3953 is seen, as well as 1.39.
If 1.39 gives way, reaching daily range lows at 1.3853 and maybe, with a little oomph, the daily support at 1.3807 and 1.38 handle is possible this week. Conservative sellers below 1.39 may seek additional bearish candlestick confirmation before taking action. Not only does this help confirm seller intent under 1.39, it provides structure to position entry and risk levels.
USD/CHF:
Weekly gain/loss: -0.05%
Weekly close: 0.9708
Weekly perspective:
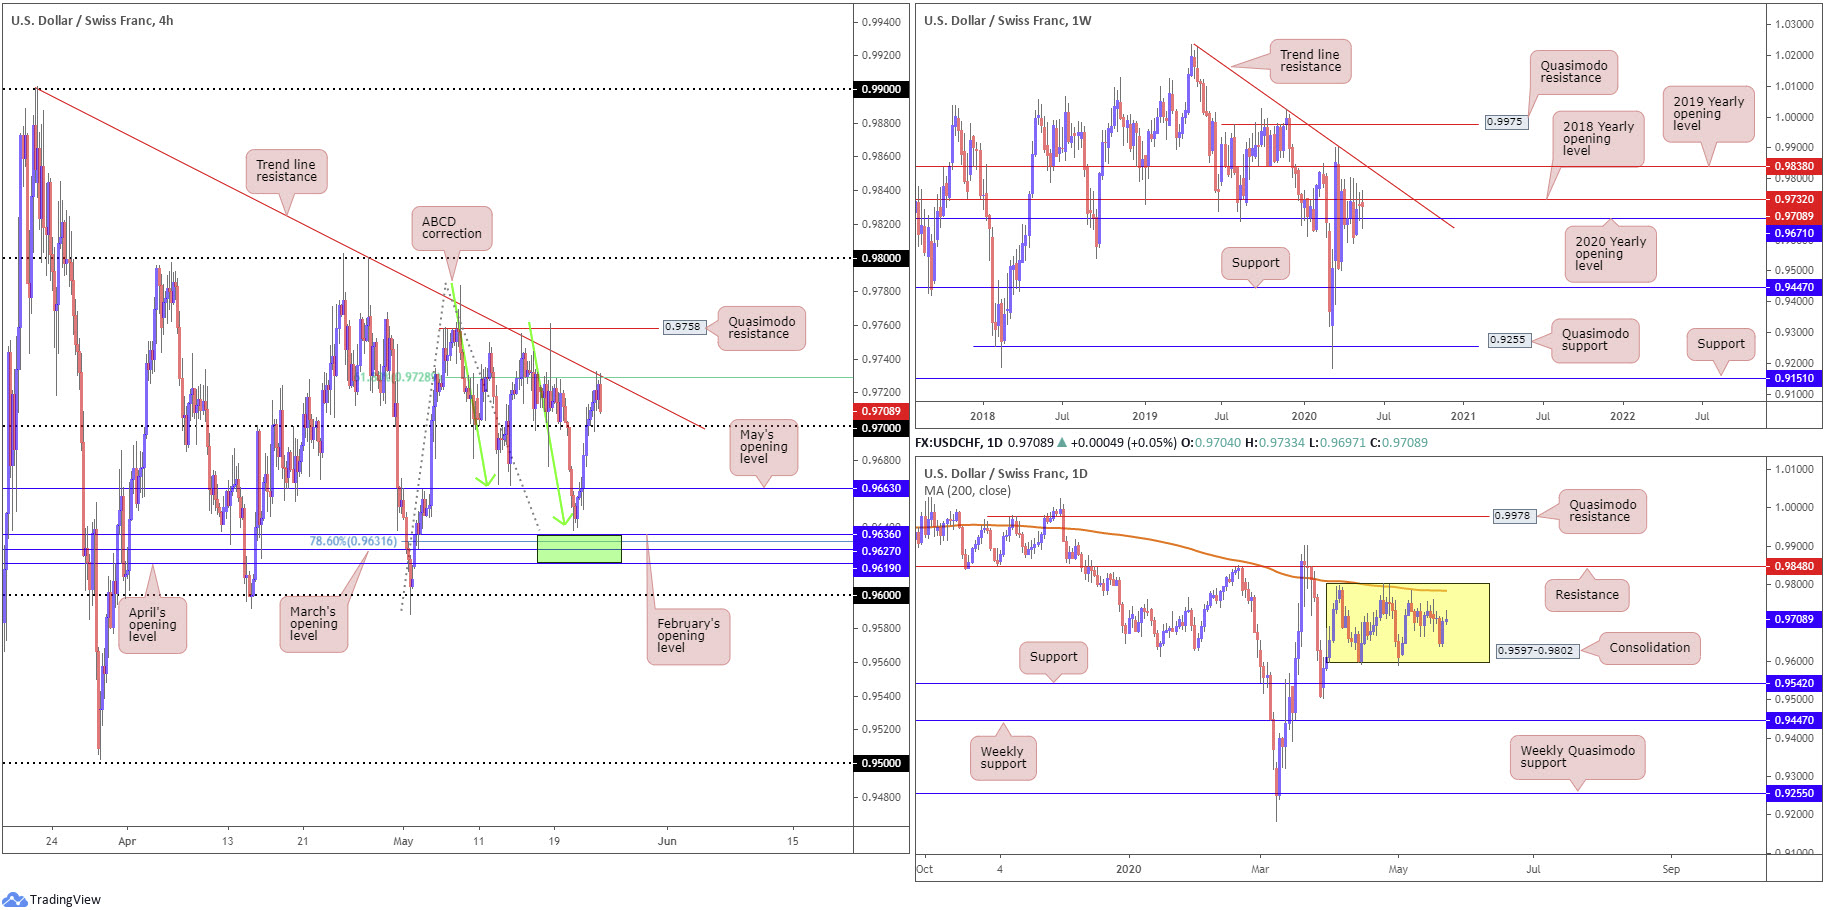
April onwards has witnessed the 2018 yearly opening level at 0.9732 establish resistance, recently motioned in the form of consecutive selling wicks off 0.9800ish. The past couple of weeks, nevertheless, concluded forming clear-cut indecision candles, with extremes connecting with 0.9732 and the 2020 yearly opening level from 0.9671.
Technical structure above 0.9732 is seen at the 2019 yearly opening level drawn from 0.9838 and trend line resistance, taken from the high 1.0226. Moves south of 0.9671 shines the spotlight on the possibility of a run to support at 0.9447.
Daily perspective:
Since early April, price action on the daily timeframe has seesawed between 0.9802/0.9597, with current price drifting mid-range. Traders may also want to acknowledge the 200-day SMA (orange – 0.9784) circling the upper border of the aforementioned range.
Outside of the base, traders will note resistance rests at 0.9848 and support from 0.9542.
H4 perspective:
Responding to a H4 ABCD correction (green arrows) at 0.9641 Thursday, and leaving 0.9619/0.9636 (green) unchallenged, an area made up of April, March and February’s opening levels, the US dollar pencilled in a firm recovery against the Swiss franc. Follow-through buying emerged Friday, bolstered by a broad USD bid.
Traders who read Friday’s technical briefing may recall the following (italics):
H4 price climbed above May’s opening level at 0.9663 and shook hands with 0.97, with the unit threatening further upside to trend line resistance, extended from the high 0.9900, and a 61.8% Fibonacci retracement ratio at 0.9728 (note this is traditionally considered a take-profit target out of ABCD scenarios).
Intraday traders today, having seen H4 price attempting to conquer 0.97, may make their way towards the trend line resistance and the 61.8% Fibonacci retracement ratio combination around 0.9728. These two levels, coupled with weekly resistance seen plotted at 0.9732, will likely be viewed as reasonably strong resistance, healthy enough to perhaps force moves back to 0.97.
Areas of consideration:
As evident from the H4 chart, we can see an intraday rotation formed from 0.9728/32 at the tail end of the session Friday, establishing a bearish engulfing pattern and threatening a retest at 0.97. Sellers will be reluctant to pull the trigger at current price, knowing 0.97 could house active buyers. Consequently, a H4 close south of 0.97 may be needed to tempt bearish strategies this week towards May’s opening level at 0.9663.
Should we break through current resistance, H4 Quasimodo resistance is seen at 0.9758, followed by the 200-day SMA at 0.9784 and then the 0.98 handle, which merges with the top edge of the current daily range.
Dow Jones Industrial Average:
Weekly gain/loss: +3.59%
Weekly close: 24520
Weekly perspective:
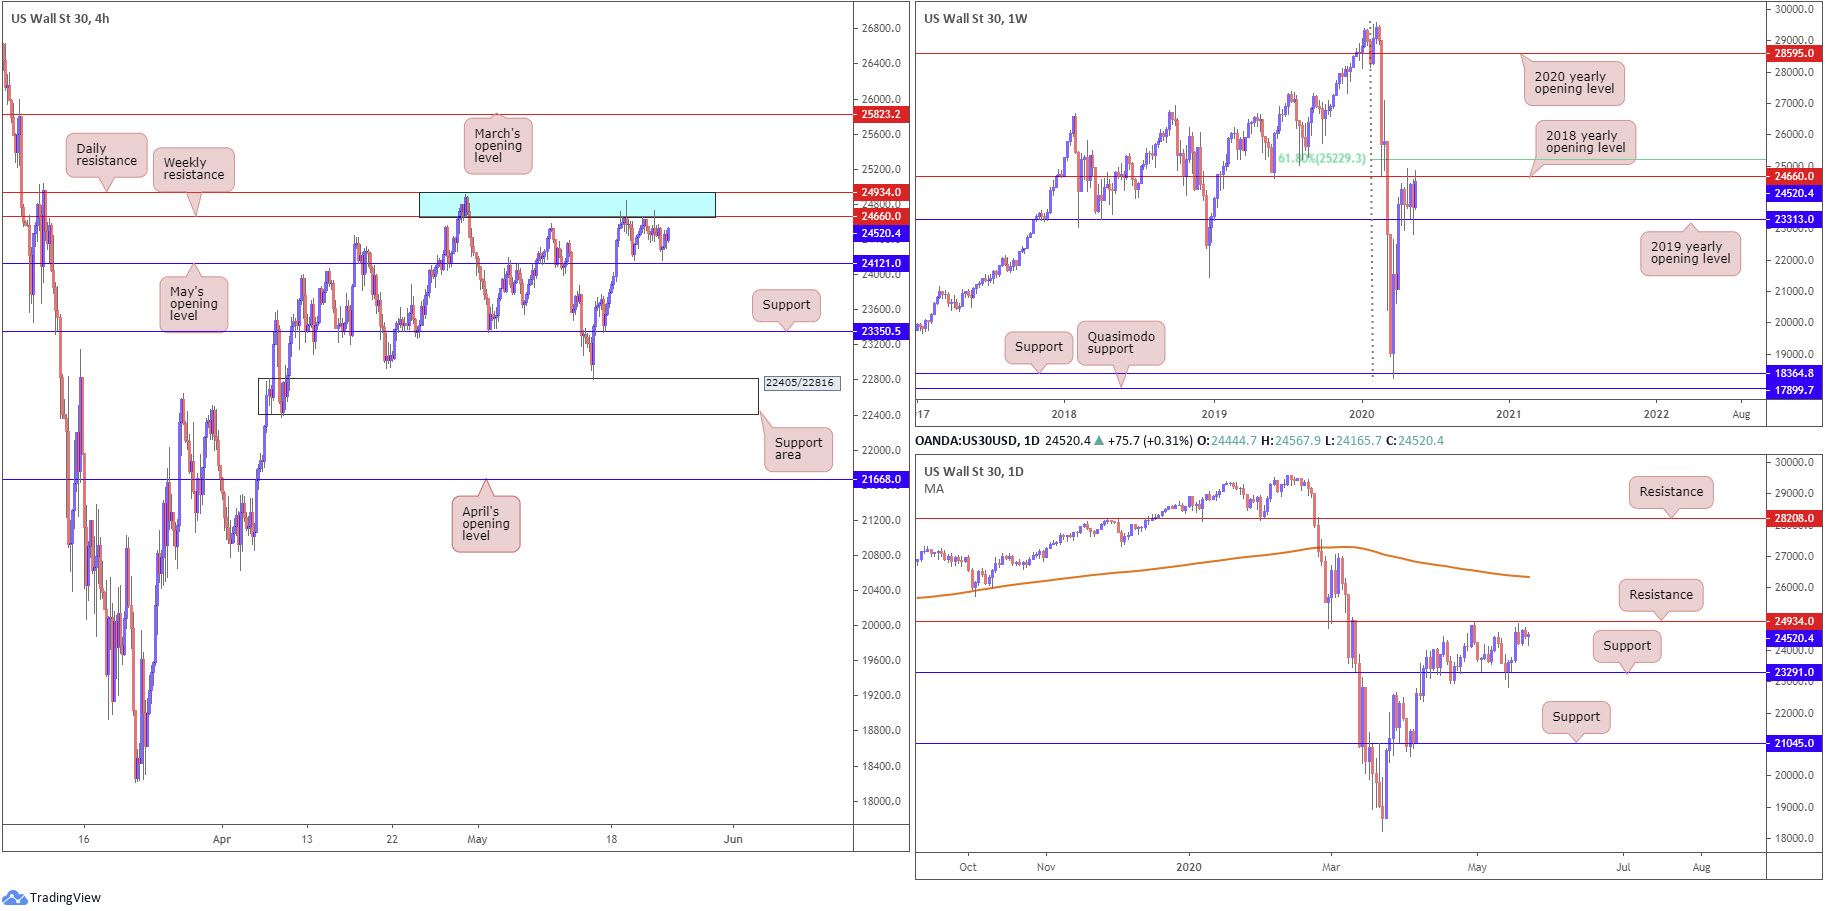
Since mid-April, price has struggled to pin down direction between 23313 (2019 yearly opening level) and 24660 (2018 yearly opening level), closely shadowed by a 61.8% Fibonacci retracement ratio at 25229. A violation of 23313 shines light on support from 18364, whereas the sky above 25229 is reasonably clear back to the 2020 yearly opening level at 28595.
Daily perspective:
A similar picture presents itself on the daily chart, only here resistance forms at 24934 and support at 23291, offering clear levels to work with this week.
Beyond resistance we have the 200-day SMA (orange – 26348) floating close by, while through support we may find another layer of support develop at 21045.
Pushing through current levels, on account of the above, displays room to exercise breakout strategies.
H4 perspective:
US equities finished mostly higher Friday ahead of the three-day weekend, concluding the week in positive territory amid COVID-19 vaccine developments and global economies easing restrictions. The Dow Jones Industrial Average dropped 8.96 points, or 0.04%; the S&P 500 gained 6.94 points, or 0.24%, and the tech-heavy Nasdaq 100 concluded higher by 36.00 points, or 0.38%.
A familiar area of resistance worked its way into the spotlight in recent trading, a zone comprised of a daily resistance level at 24934 and weekly resistance, by way of the 2018 yearly opening level, at 24660 (blue). May’s opening level at 24121 is visible as the next downside target on the H4 timeframe, while a break above the higher-timeframe base could eventually land March’s opening level at 25823.
Areas of consideration:
Considering the lacklustre movement into the later stages of last week, areas of interest remain unchanged going into the new week.
In light of where we’re trading from on the higher timeframes, between 24934/24660, a violation of May’s opening level at 24121 on the H4 is a possibility this week.
24934/24660, therefore, remains a platform to consider shorts from, with conservative traders probably waiting on H4 bearish candlestick confirmation. A break beneath 24121 underlines H4 support at 23350, followed by H4 support at 22405/22816.
Should buyers remain in the driving seat this week, nevertheless, we could see a move above 24934, rattling breakout buyers. However, do be aware, the weekly 61.8% Fibonacci retracement ratio at 25229 could hamper upside.
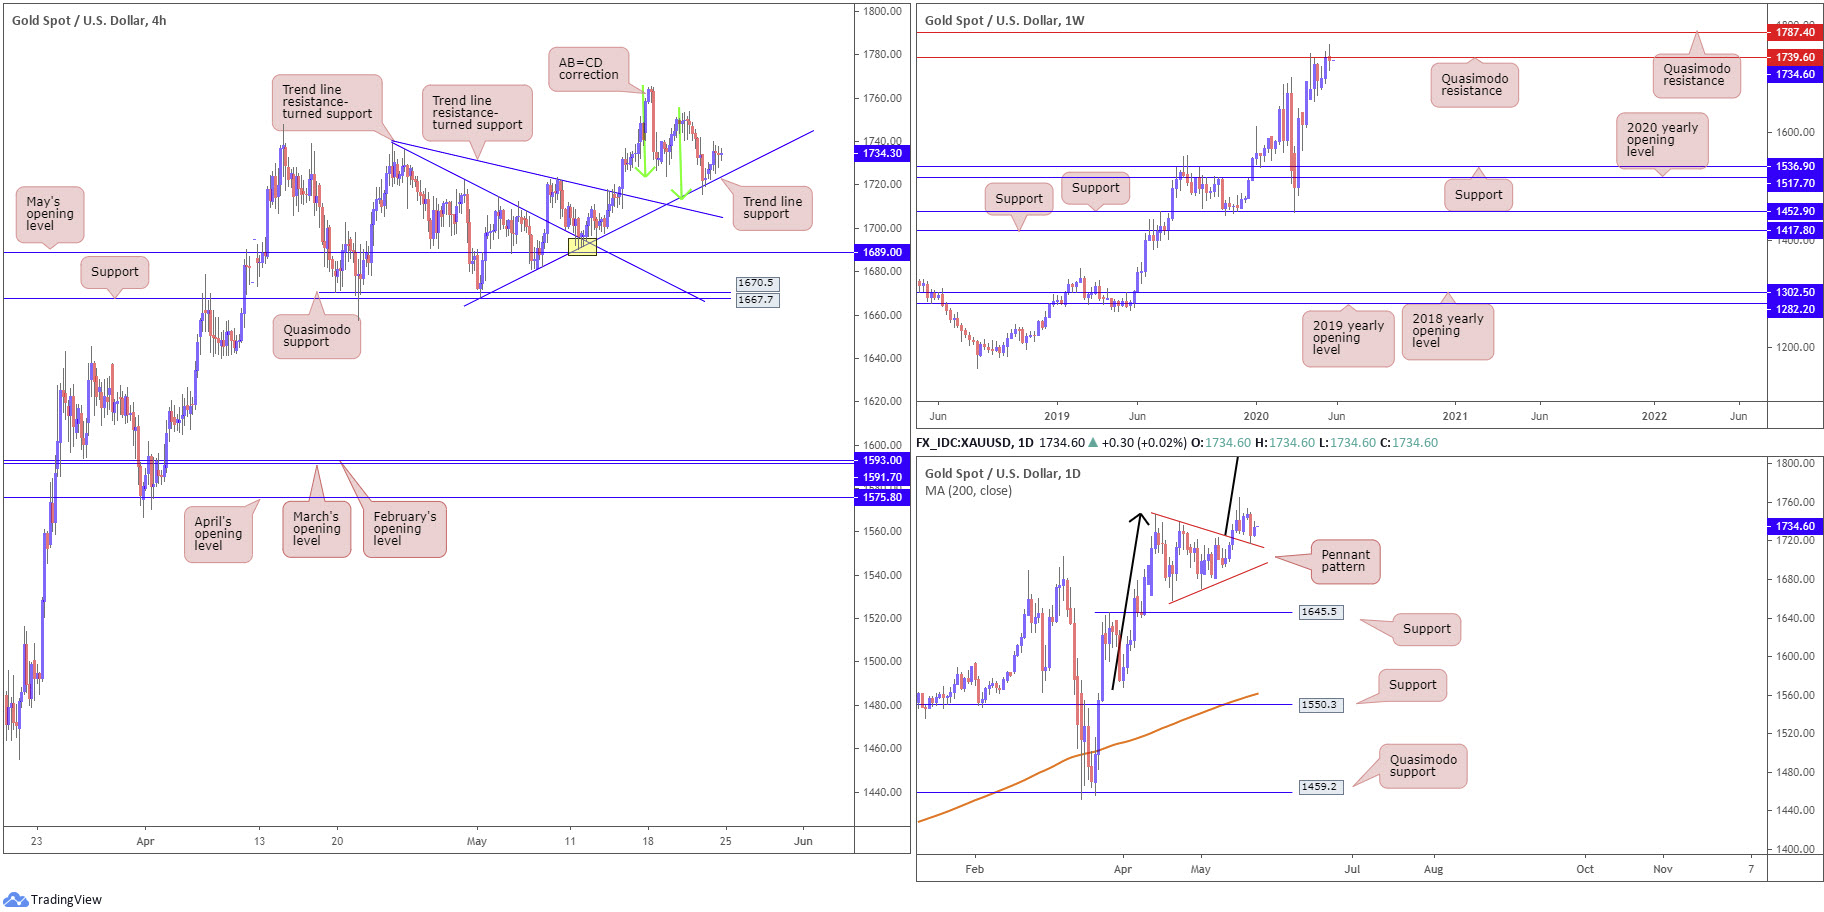
XAU/USD (GOLD):
Weekly gain/loss: -0.38%
Weekly close: 1734.3
Weekly perspective:
From mid-April, buyers and sellers have been battling for position around the underside of Quasimodo resistance at 1739.6. That was until last week after buyers regained consciousness and took off to highs at 1765.3, slicing through the aforementioned Quasimodo formation.
Clearance of 1739.6 places another layer of Quasimodo resistance on the hit list at 1787.4. It may also interest some traders to note the trend on gold has faced a northerly trajectory since 2016.
Daily perspective:
The daily timeframe offers chart pattern enthusiasts a bullish pennant configuration to work with, established from a high of 1747.7 and a low coming in from 1658.1. What’s also notable is Thursday retested the broken pennant resistance as support, and held into Friday.
Take-profit targets out of pennant patterns are measured by taking the preceding move (black arrows) and adding the value to the breakout point. This offers a sizeable take-profit, coming in at 1909.4.
H4 perspective:
As aired in Friday’s technical briefing, the piece made note of an AB=CD bullish correction (green arrows) at 1712.8, terminating at trend line support, extended from the low 1668.0. It was also underlined this pattern merged with daily price retesting the recently broken pennant resistance as support, along with gold exhibiting a northerly trend since 2016.
Areas of consideration:
The combination of trend line support, based on the H4 timeframe, the AB=CD approach, daily pennant pattern and underlying trend, witnessed a modest rally take shape Friday.
It was noted in Friday’s briefing traders long the H4 AB=CD configuration may have protective stop-loss orders set around 1700.8, under a H4 trend line resistance-turned support, taken from the high 1739.1, targeting a H4 close above weekly Quasimodo resistance at 1739.6.
Some buyers will have either reduced risk to breakeven heading into the three-day weekend, or liquidated the position. Those who remain in the fight may seek a close above weekly Quasimodo resistance mentioned above at 1739.6, in favour of a possible extension to weekly Quasimodo resistance at 1787.4 this week.
The accuracy, completeness and timeliness of the information contained on this site cannot be guaranteed. IC Markets does not warranty, guarantee or make any representations, or assume any liability regarding financial results based on the use of the information in the site.
News, views, opinions, recommendations and other information obtained from sources outside of www.icmarkets.com.au, used in this site are believed to be reliable, but we cannot guarantee their accuracy or completeness. All such information is subject to change at any time without notice. IC Markets assumes no responsibility for the content of any linked site.
The fact that such links may exist does not indicate approval or endorsement of any material contained on any linked site. IC Markets is not liable for any harm caused by the transmission, through accessing the services or information on this site, of a computer virus, or other computer code or programming device that might be used to access, delete, damage, disable, disrupt or otherwise impede in any manner, the operation of the site or of any user’s software, hardware, data or property.