
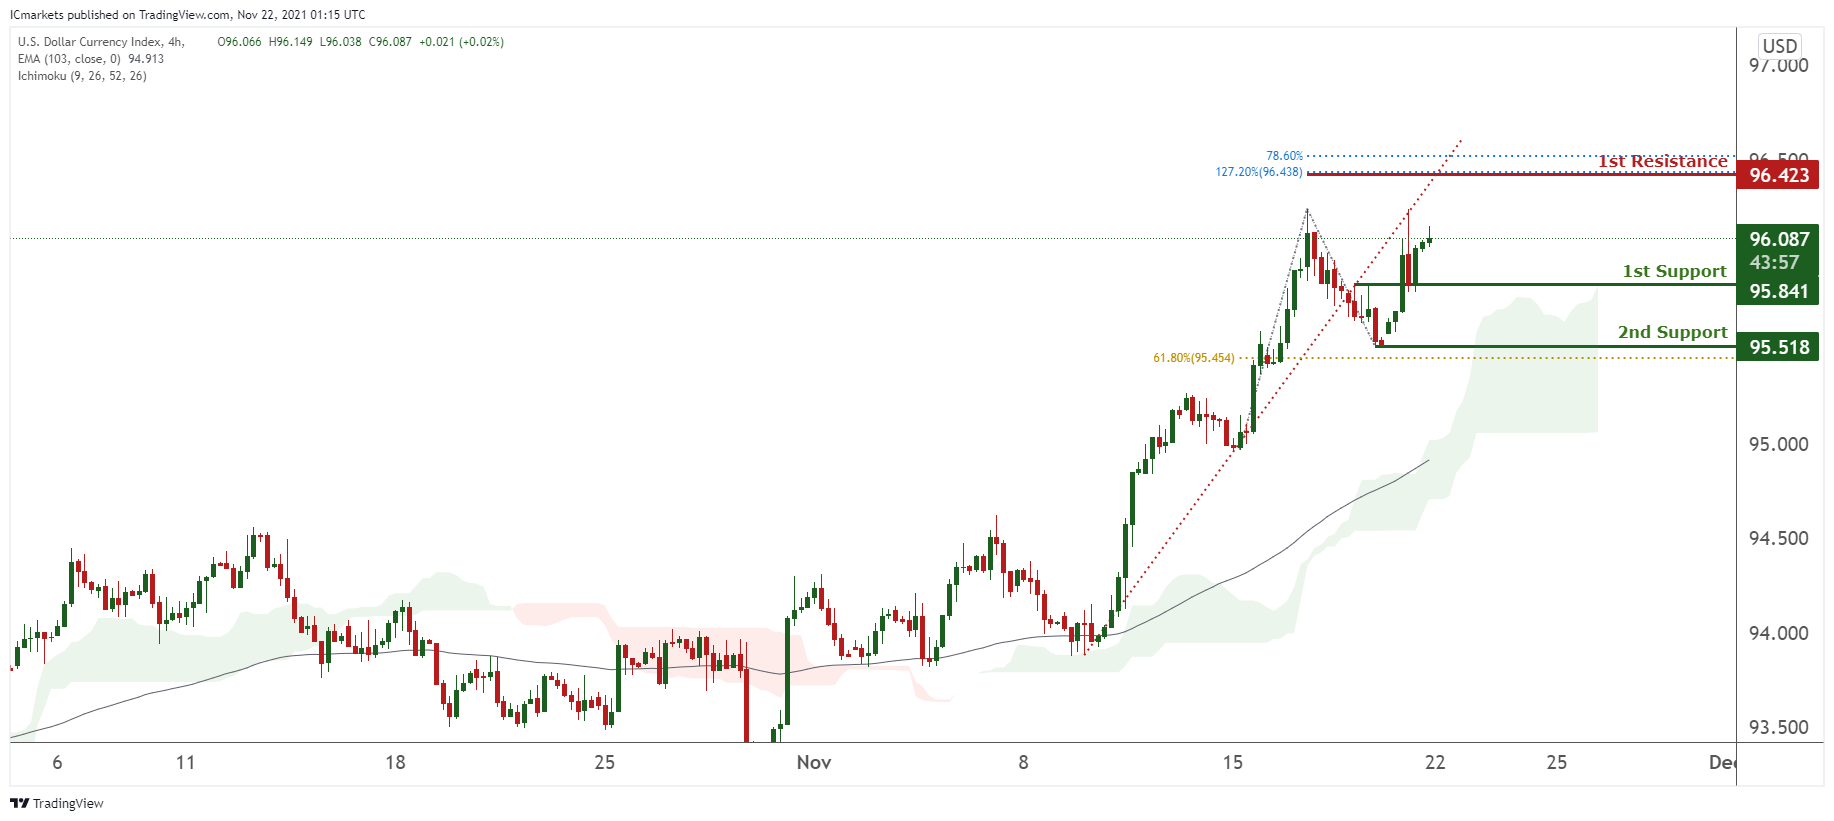
DXY:
On the H4 timeframe, prices have recently broken out of our ascending trendline but are still on a bullish momentum. We see potential for prices to retest our bullish trendline at 1st resistance at 96.423 in line with 78.6% Fibonacci retracement and 127.2% Fibonacci extension from our 1st support at 95.841 in line which is a graphical overlap. Technical indicators are on a bullish momentum. Alternatively, breaking our 1st support might find prices dip towards our 2nd support at 95.518 in line with 61.8% Fibonacci retracement.
Areas of consideration:
- H4 time frame, 1st resistance at 96.423
- H4 time frame, 1st support at 95.841
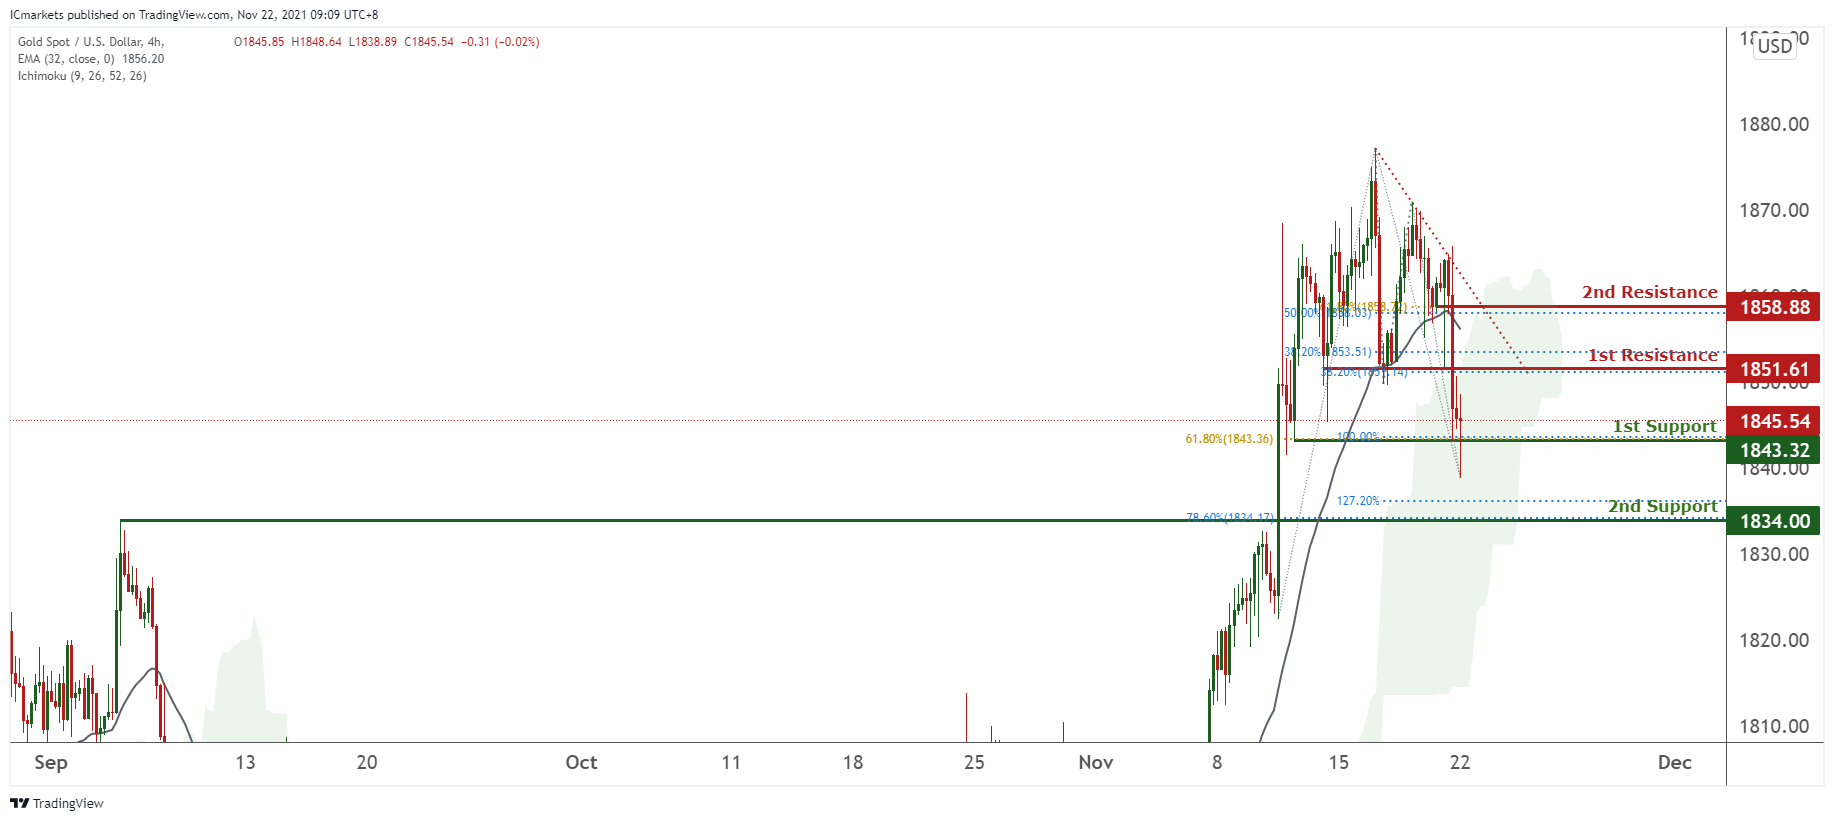
XAU/USD (GOLD):
On the H4 chart, prices are on a bearish momentum. We see potential for a small bounce from our 1st support at 1843.32 in line with 61.8% Fibonacci retracement and 100% Fibonacci extension towards our 1st resistance at 1851.61 in line with 38.2% Fibonacci retracement. However, as technical indicators are showing mixed signals, we prefer to remain neutral for now. Alternatively, prices may dip towards our 2nd support at 1834 in line with 127.2% Fibonacci extension and 38.2% Fibonacci retracement.
Areas of consideration:
- 4h 1st support at 1843.32
- 4h 1st resistance at 1851.61
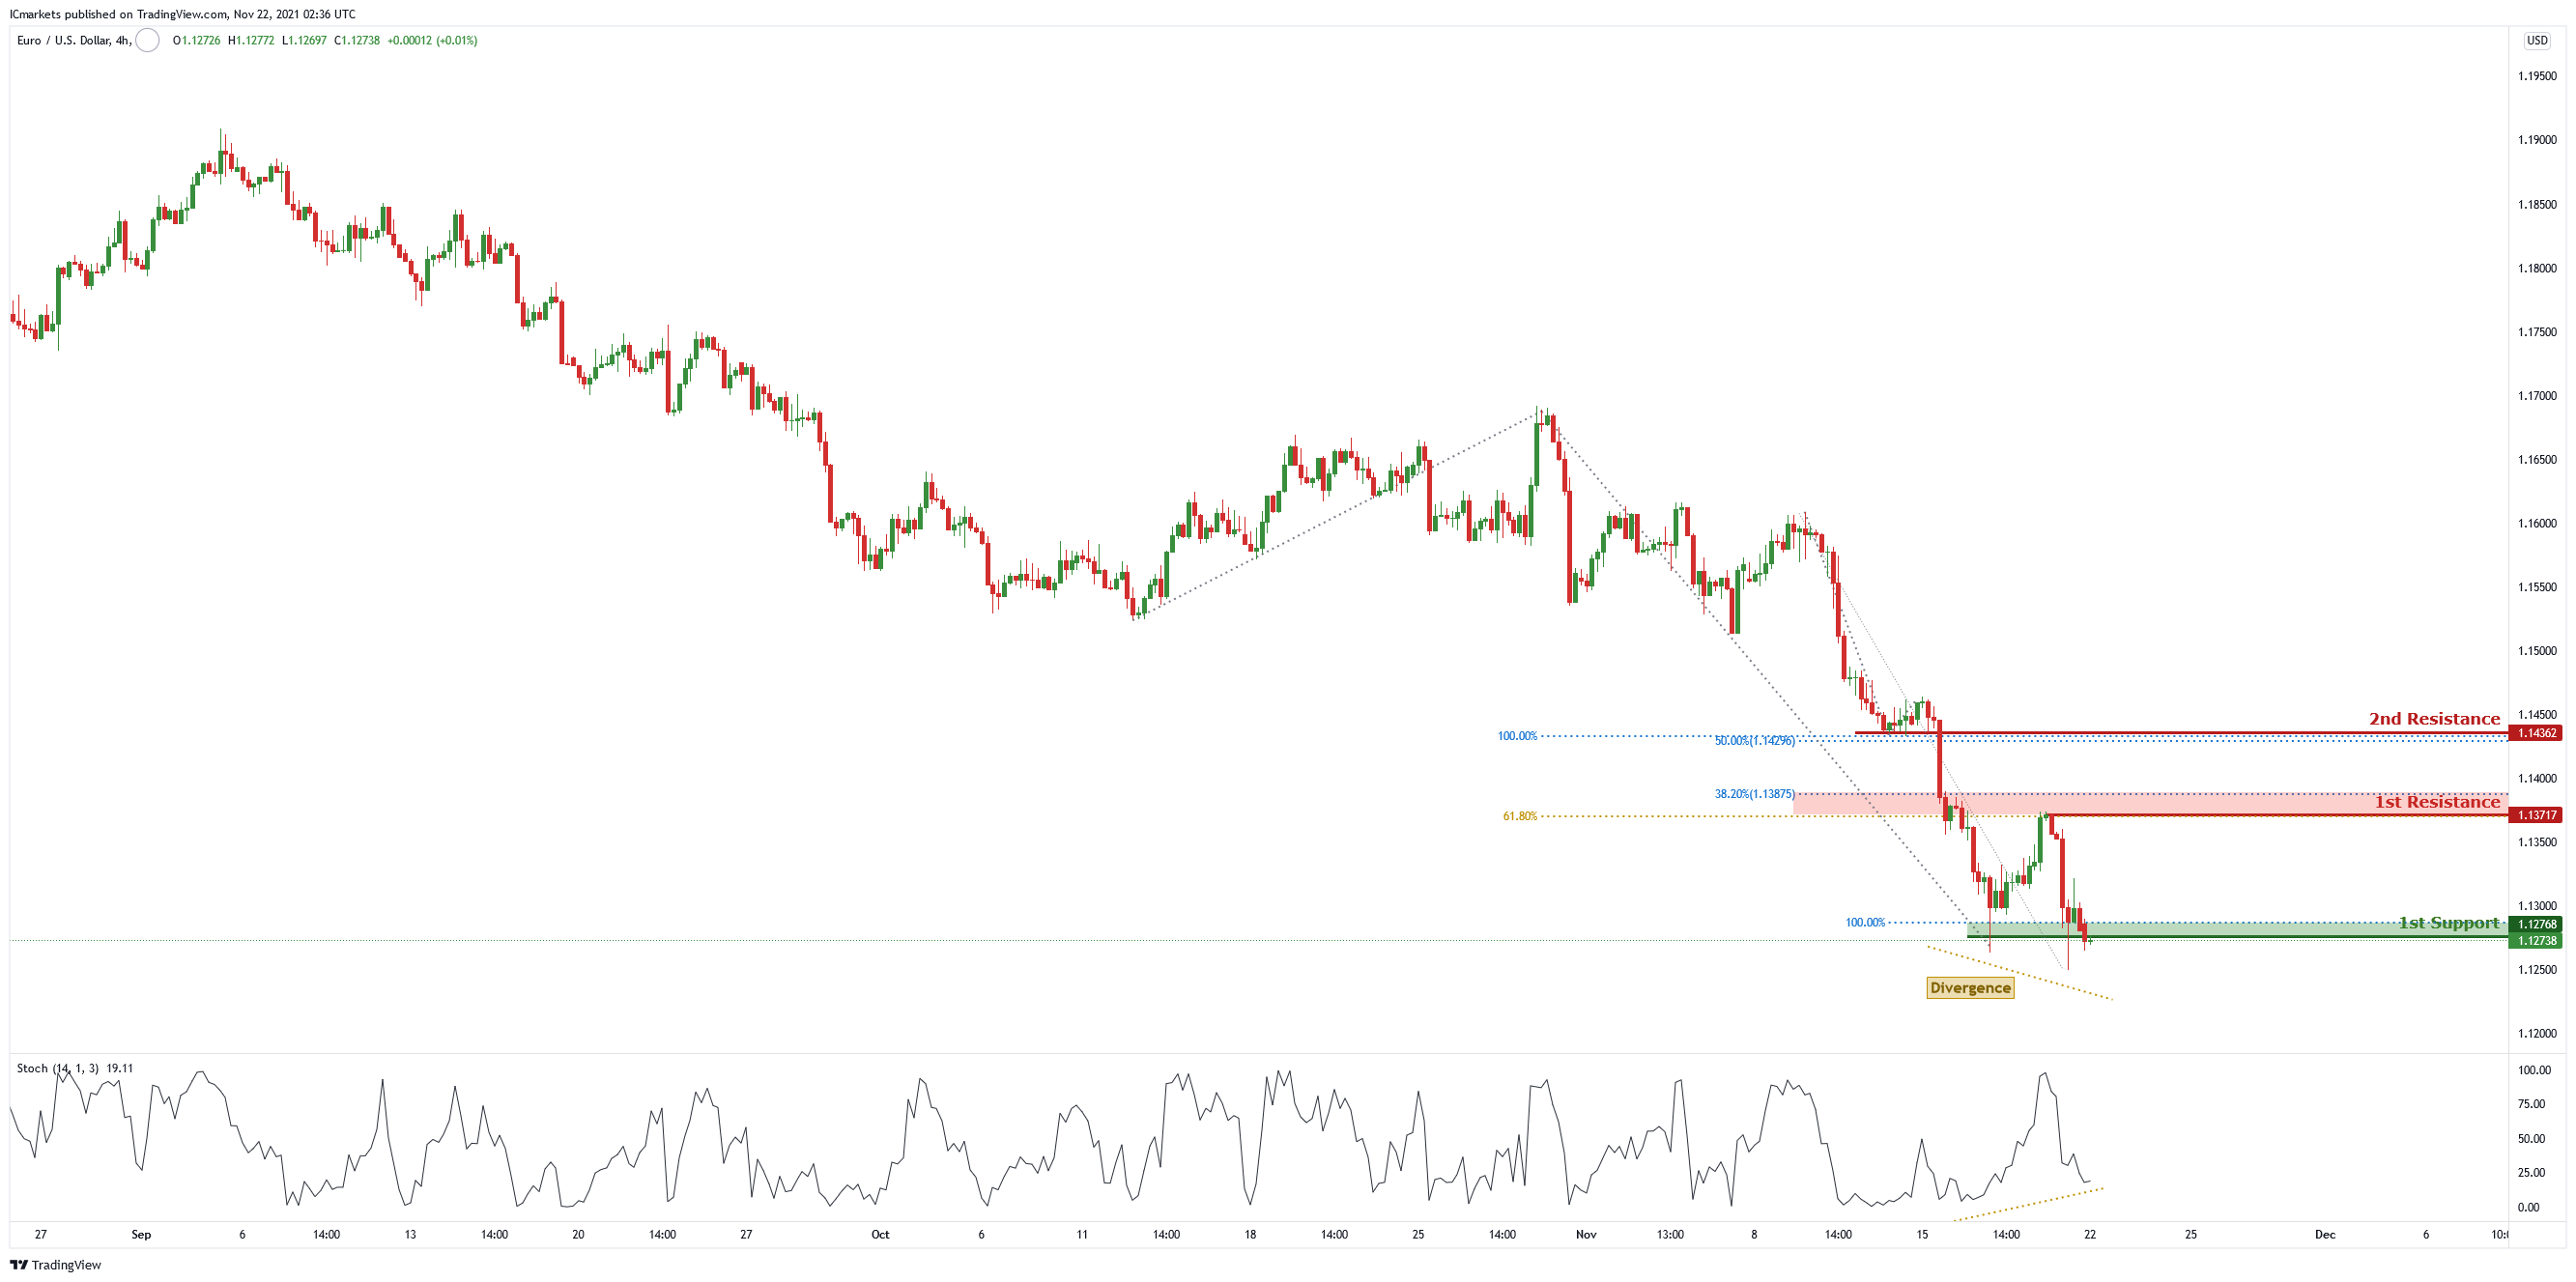
EUR/USD:
On the H4 chart, price is near the first support level of 1.12768 which is also the graphical swing low level and 100% Fibonacci projection. Price can potentially go to the first resistance level of 1.13717 which is also 38.2% Fibonacci retracement and 61.8% Fibonacci projection. Our bullish bias is supported by the stochastic indicator as it shows a divergence.
Areas of consideration :
● First support level – 1.12768
● First resistance – 1.13717
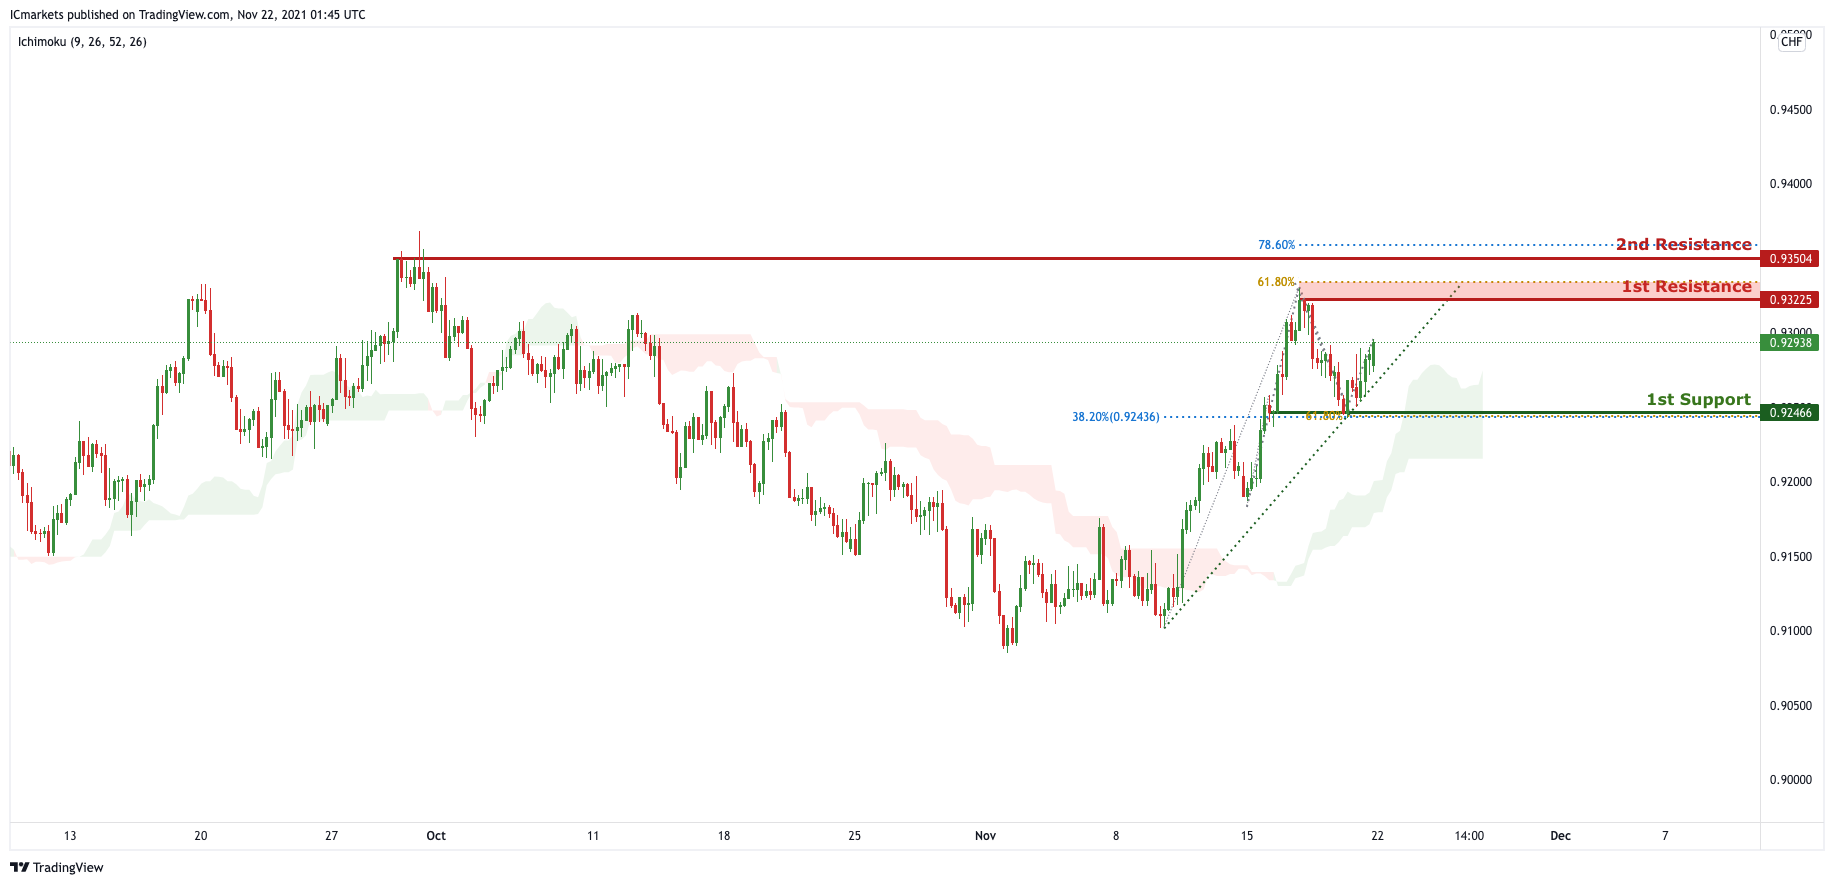
USD/CHF:
On the H4 timeframe, price is abiding to the ascending trendline support, signifying an overall bullish momentum. Price is currently in between 1st Resistance in line with 61.8% Fibonacci projection and 1st Support in line with 61.8% Fibonacci projection and 38.2% Fibonacci retracement. Traders could take note of these key levels and wait for the price to swing higher or lower.
Areas of consideration:
- Watch 1st Support at 0.92466
- Watch 1st Resistance at 0.93225
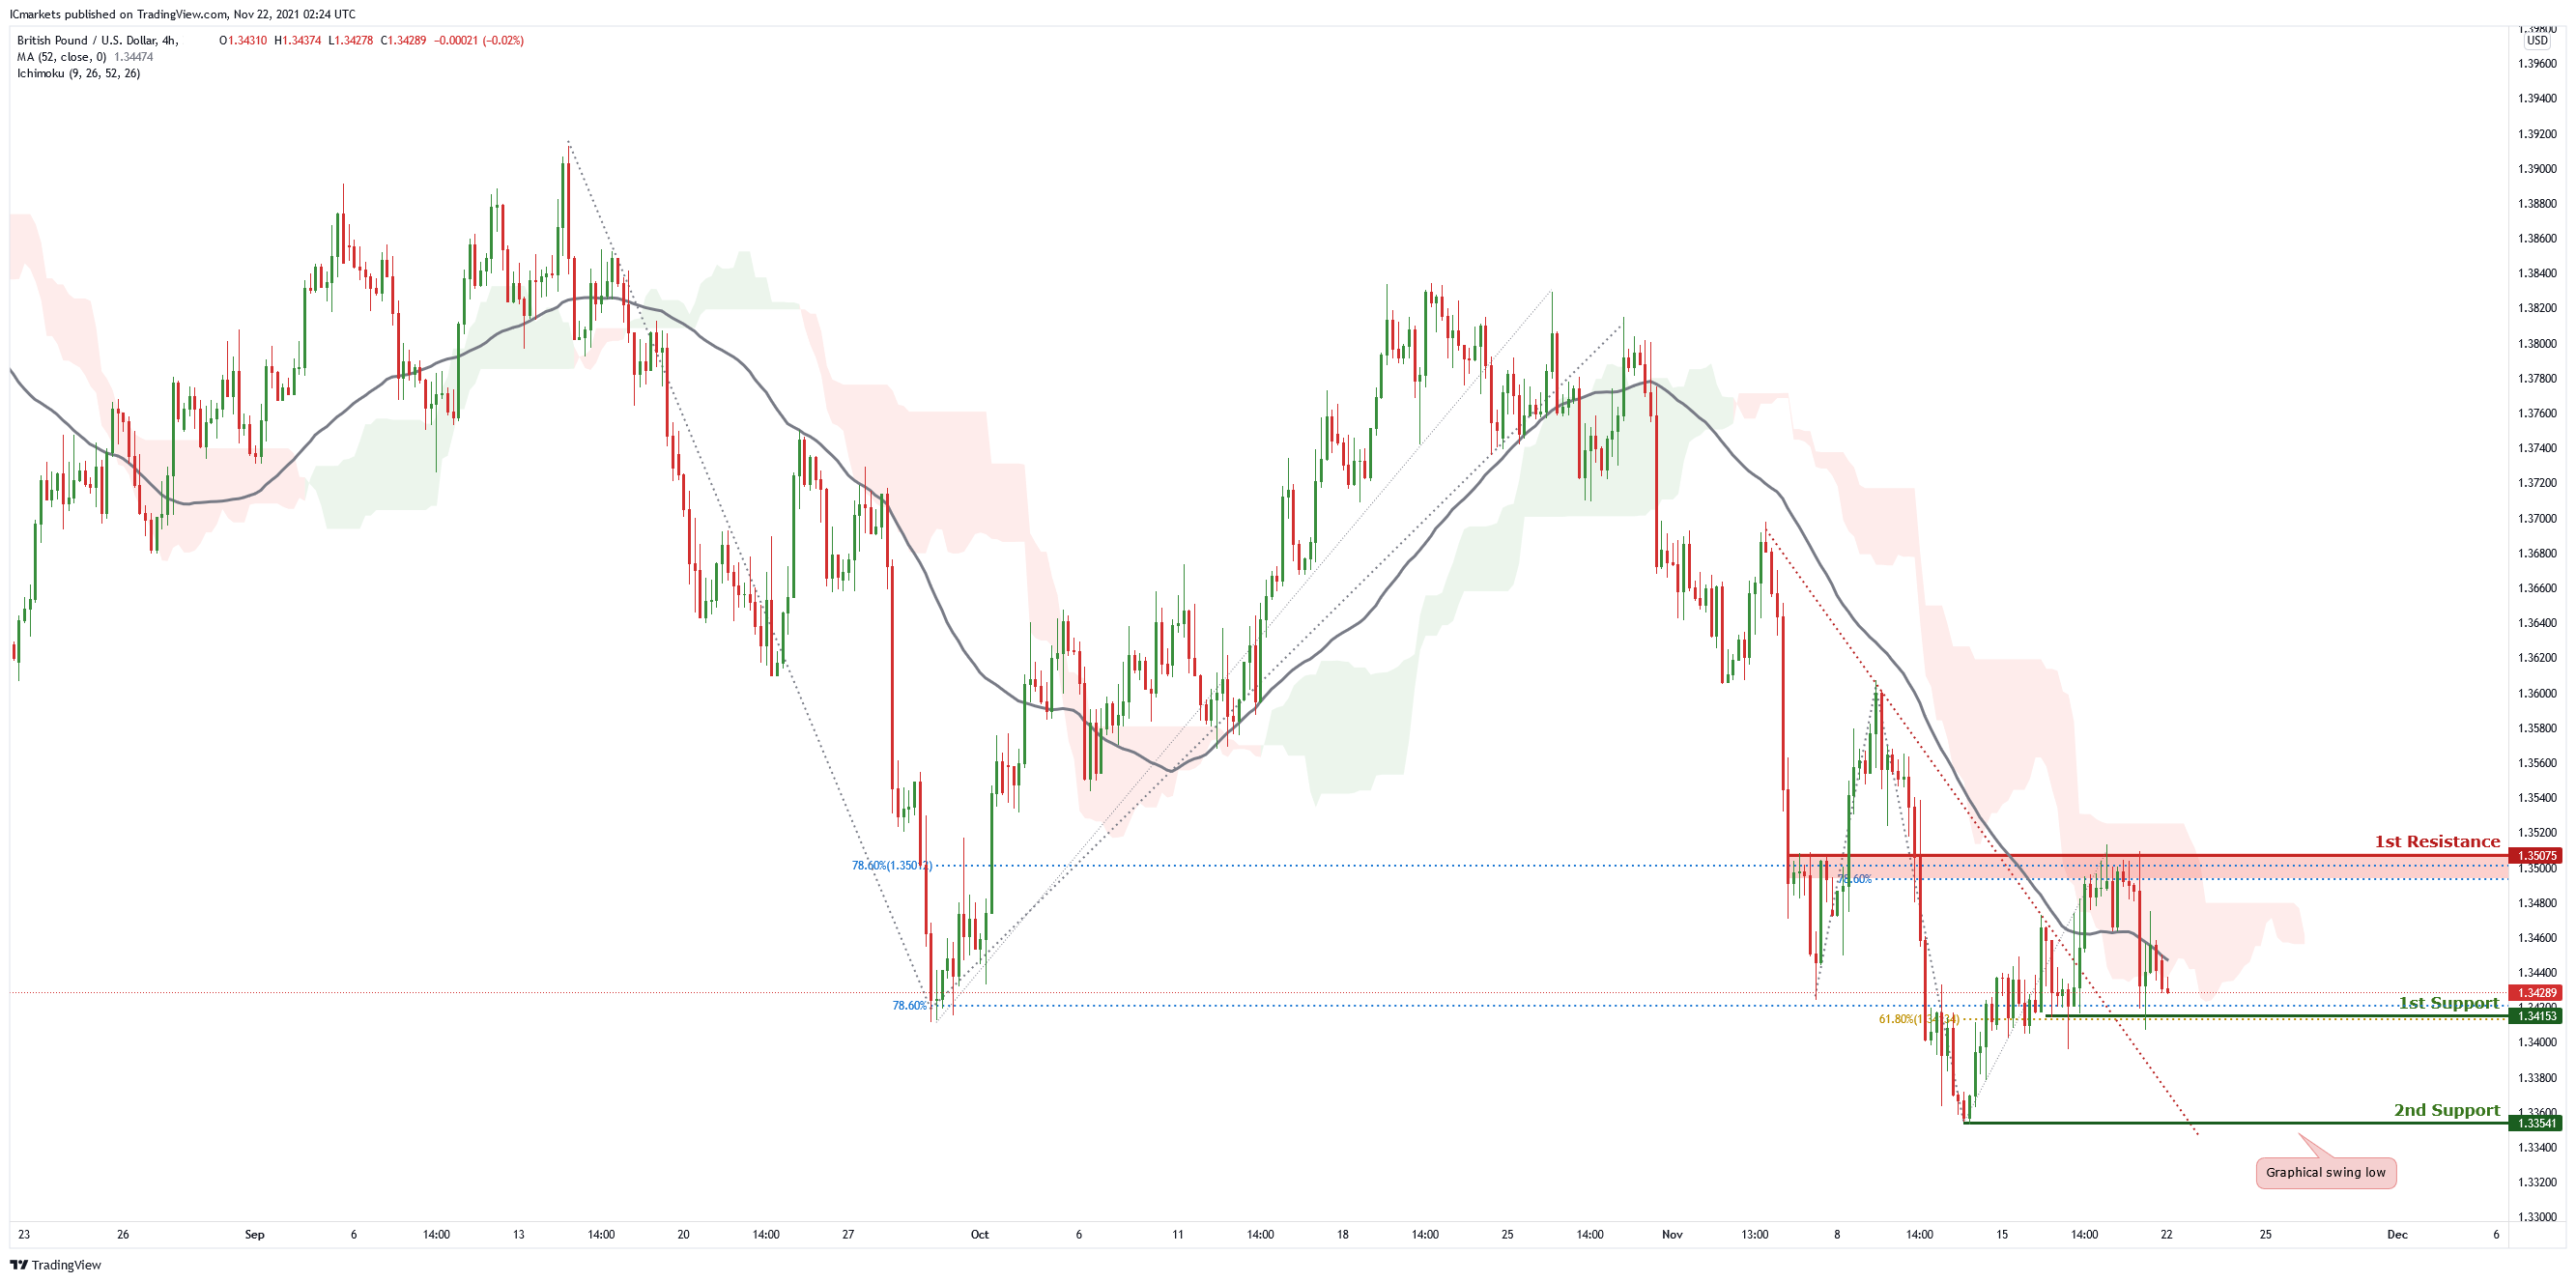
GBP/USD:
On the H4 chart price is near the first support level of 1.34153 which is also 78.6% projection and 61.8% Fibonacci retracement. Price can potentially dip to the 2nd support of 1.33541 which is the graphical swing low level. Our bearish bias is supported by both the natural moving average of 52 and Ichimoku cloud indicator as price is trading under it.
Areas of consideration :
● 1st resistance – 1.35075
● 1st support – 1.34153
● 2nd support – 1.33541
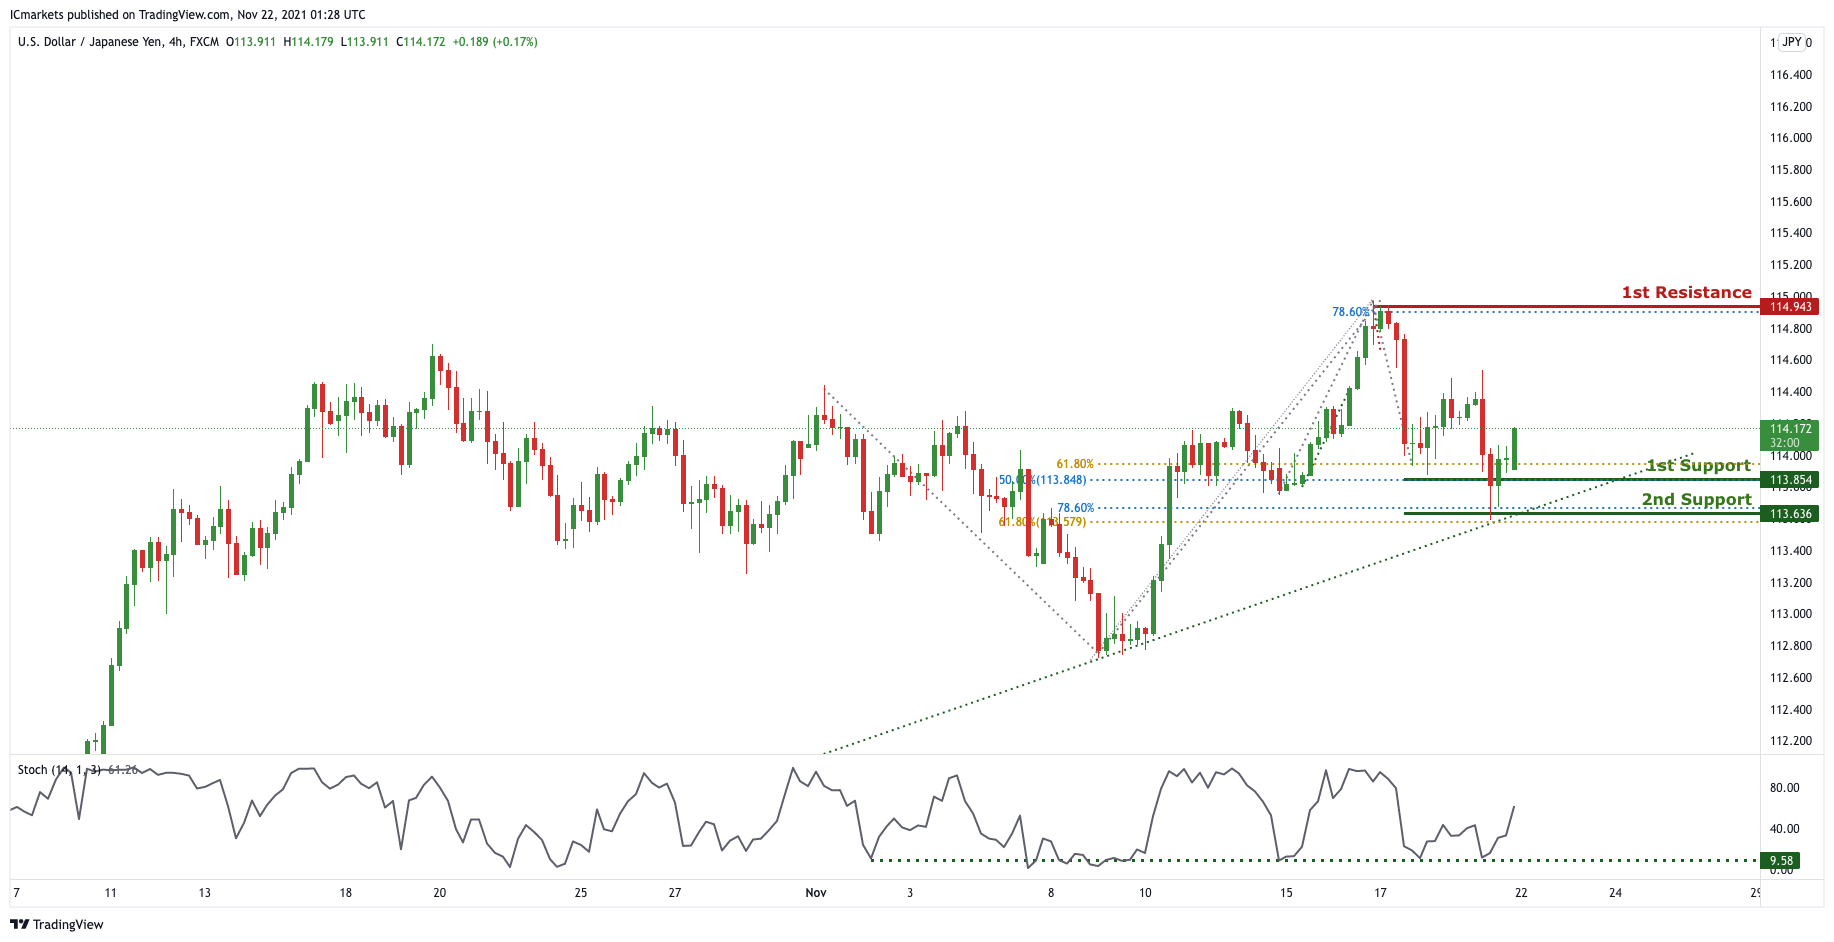
USD/JPY:
On the H4 timeframe, price bounced from the 1st Support in line with 50% Fibonacci retracement and 61.8% Fibonacci projection and abiding to daily ascending trendline. We can expect price to further push upwards towards 1st Resistance in line with 78.6% Fibonacci projection and previous swing high. Our bullish bias is further supported by the stochastic indicator where the %K line touched the support level and bounced.
Areas of consideration:
- H4 1st resistance level 114.943
- H4 1st support level 113.854
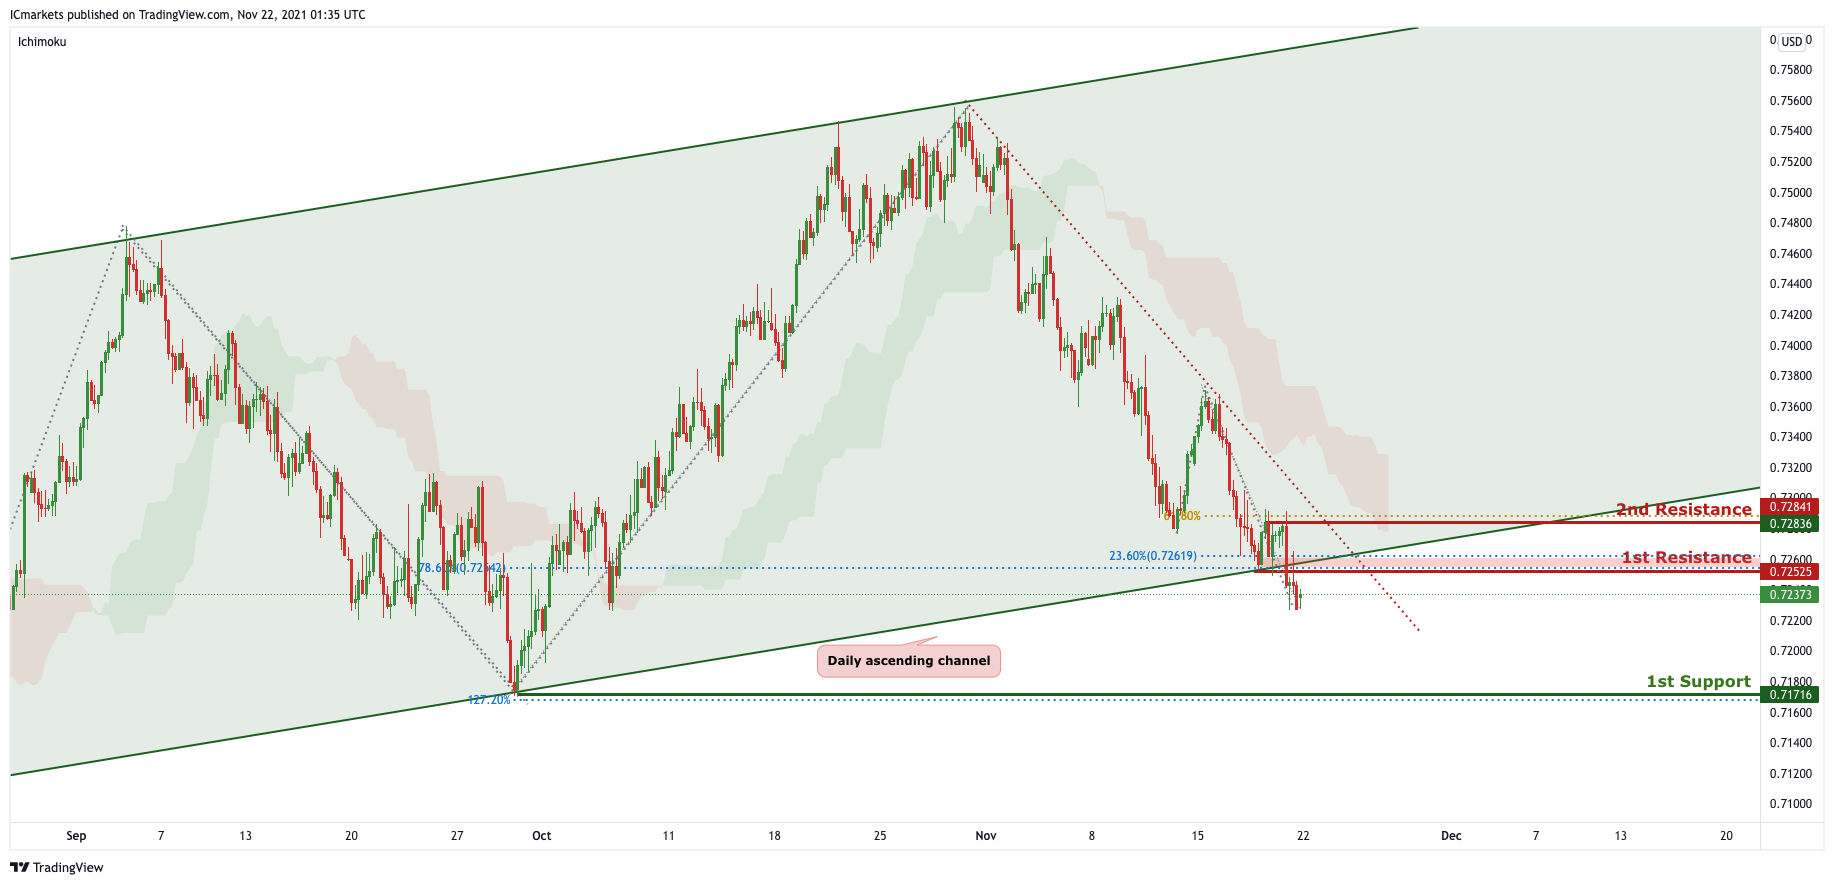
AUD/USD:
On the H4, we can see that price broke out of the ascending channel on the daily and abiding to the descending trendline on the H4. We can expect the price to drop from 1st Resistance in line with 78.6% Fibonacci Retracement and 23.6% Fibonacci retracement towards the 1st Support in line with 127.2% Fibonacci projection. Our bearish bias is further supported by the Ichimoku cloud indicator where price is holding below it and it is forming a strong resistance level.
Areas of consideration:
- H4 1st resistance level 0.72525
- H4 1st support level 0.71716
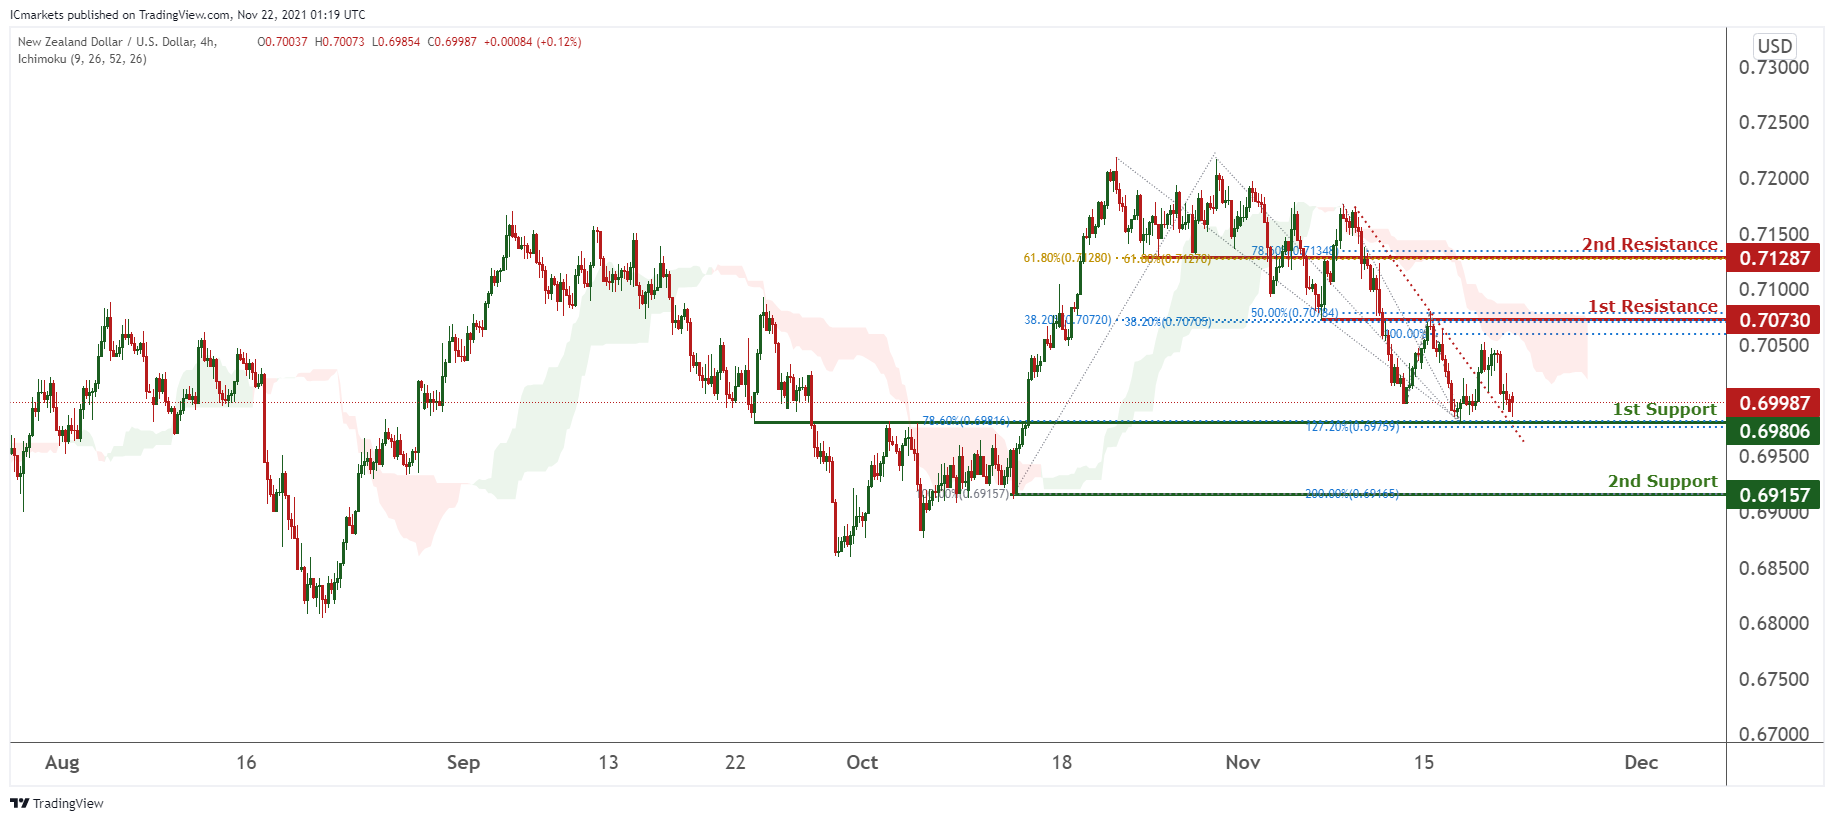
NZD/USD:
On the H4 timeframe, prices have recently broken out of the descending trendline and are retesting at our 1st support at 0.69806 in line with 127.2% Fibonacci extension. Technical indicators are showing bearish momentum. We see potential for prices to break our 1st support at 0.69806 and dip further towards our 2nd support at 0.69157 in line with 200% Fibonacci extension.
Areas of consideration:
- H4 time frame, 1st resistance at 0.70730
- H4 time frame, 1st support at 0.69806
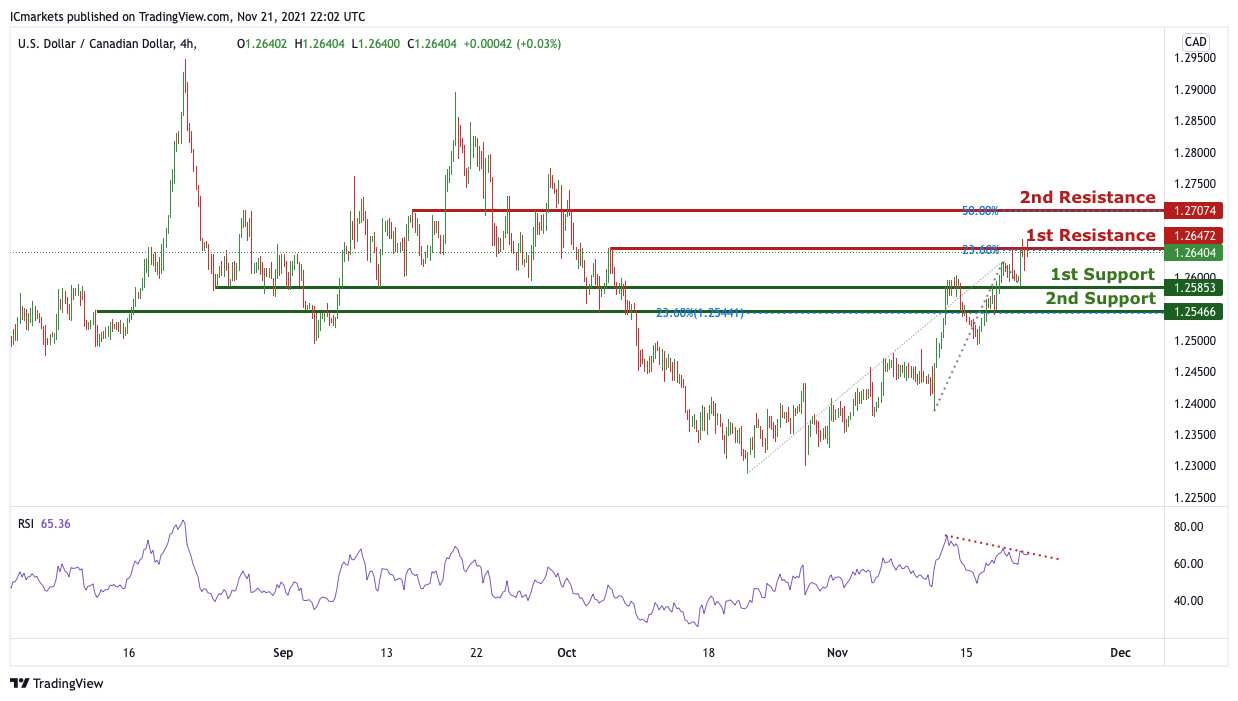
USD/CAD:
On the H4, with price reversing off the resistance on the RSI indicator and the a graphical level, we have a bearish bias that price will dip to 1st support at 1.25853 in line with the graphical overlap support and possibly to 2nd support at 1.27074 in line with the graphical overlap support from 1st resistance at 1.26472 in line with the horizontal overlap resistance and 23.6% Fibonacci retracement level. Alternatively, we may see price break 1st resistance structure and head for 2nd resistance at 1.25466 in line with the 50% Fibonacci projection retracement level and horizontal swing high resistance.
Areas of consideration:
- H4 time frame, support at 25853
- H4 time frame, resistance at 26472
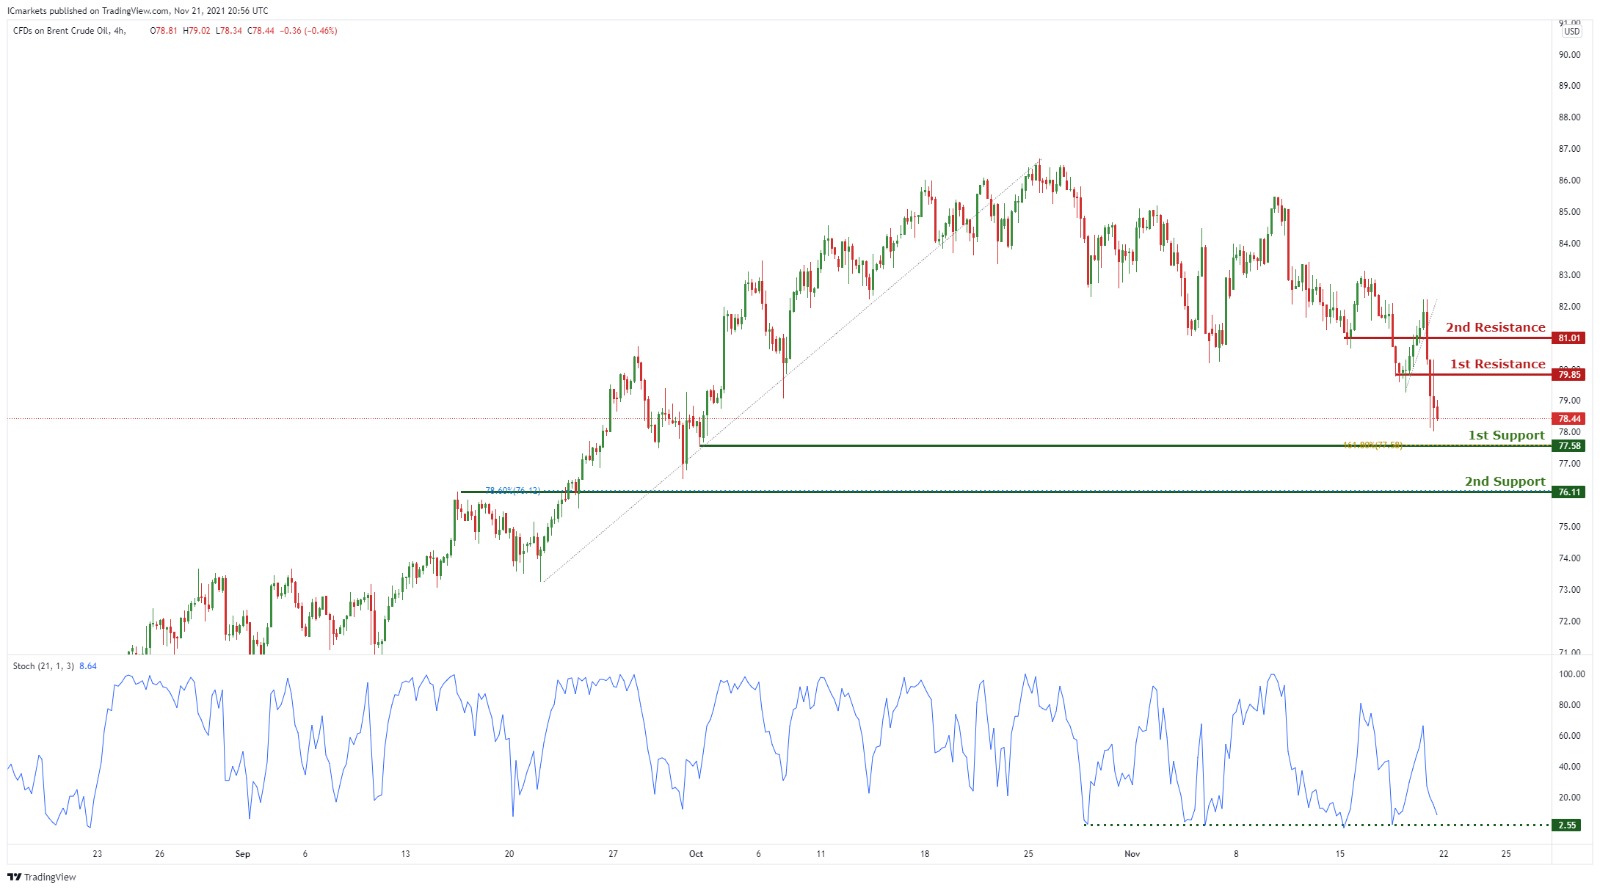
OIL:
On the H4 timeframe, with price approaching the support level on the stochastics indicator, we have a bias that price will rise from 1st support at 77.58 in line with the 161.8% Fibonacci extension and horizontal swing low support to 1st resistance at 79.85 in line with the horizontal overlap resistance and possibly to 2nd resistance at 81.01 in line with the horizontal overlap resistance . Alternatively, price may break 1st support structure and head for 2nd support at 76.11 in line with the 78.6% Fibonacci retracement and horizontal overlap support.
Areas of consideration:
- H4 time frame, 1st resistance of 85
- H4 time frame, 1st support of 58
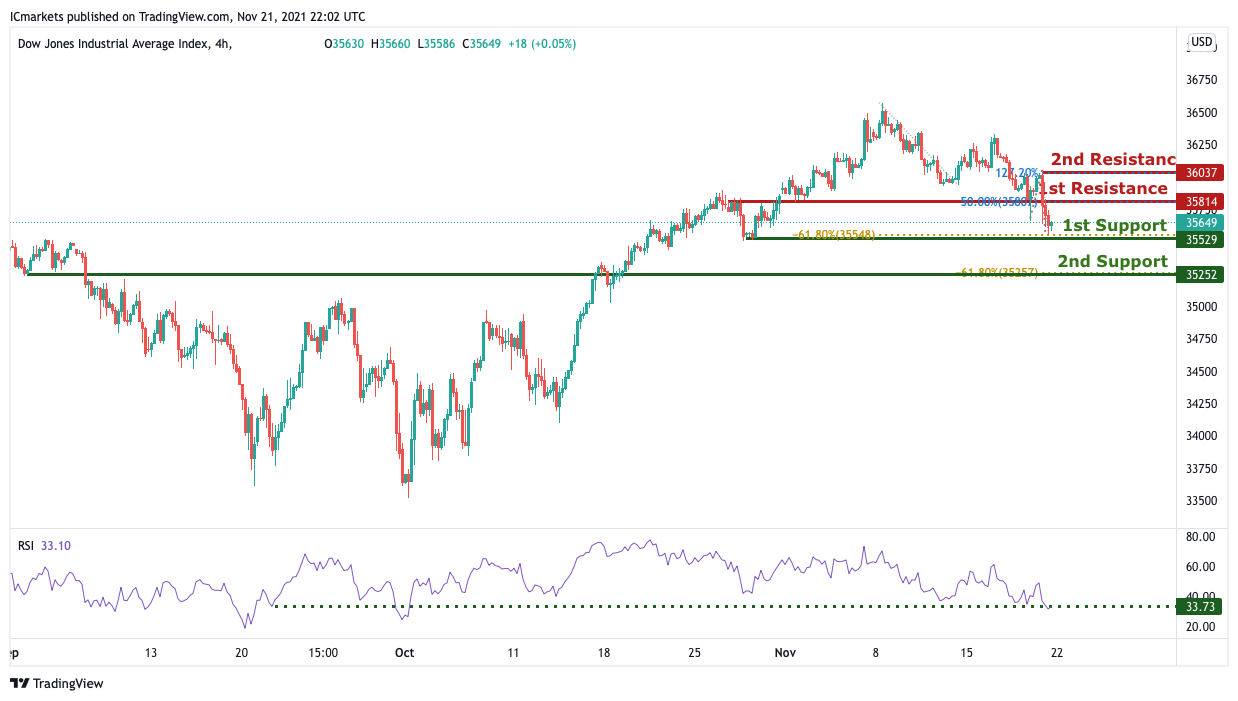
Dow Jones Industrial Average:
On the H4, with price testing the support on the RSI indicator, rejecting the graphical horizontal overlap support at 1st support at 35529 in line with the -61.8%Fibonacci expansion, we are biased that price will rise from 1st support to 1st resistance at 35814 in line with the 50% Fibonacci retracement and horizontal overlap resistance and possibly to 2nd resistance at 36037 in line with the 127.2% Fibonacci extension and graphical swing high resistance. Alternatively, we may see price break 1st support and head for 2nd support at 35252 in line with graphical swing low support and 61.8% Fibonacci projection.
Areas of consideration:
- 4H resistance at 35814
- 4H support at 35529
The accuracy, completeness and timeliness of the information contained on this site cannot be guaranteed. IC Markets does not warranty, guarantee or make any representations, or assume any liability regarding financial results based on the use of the information in the site.
News, views, opinions, recommendations and other information obtained from sources outside of www.icmarkets.com.au, used in this site are believed to be reliable, but we cannot guarantee their accuracy or completeness. All such information is subject to change at any time without notice. IC Markets assumes no responsibility for the content of any linked site.
The fact that such links may exist does not indicate approval or endorsement of any material contained on any linked site. IC Markets is not liable for any harm caused by the transmission, through accessing the services or information on this site, of a computer virus, or other computer code or programming device that might be used to access, delete, damage, disable, disrupt or otherwise impede in any manner, the operation of the site or of any user’s software, hardware, data or property.