EUR/USD:
Weekly gain/loss: -0.73%
Weekly close: 1.1217
Weekly perspective:
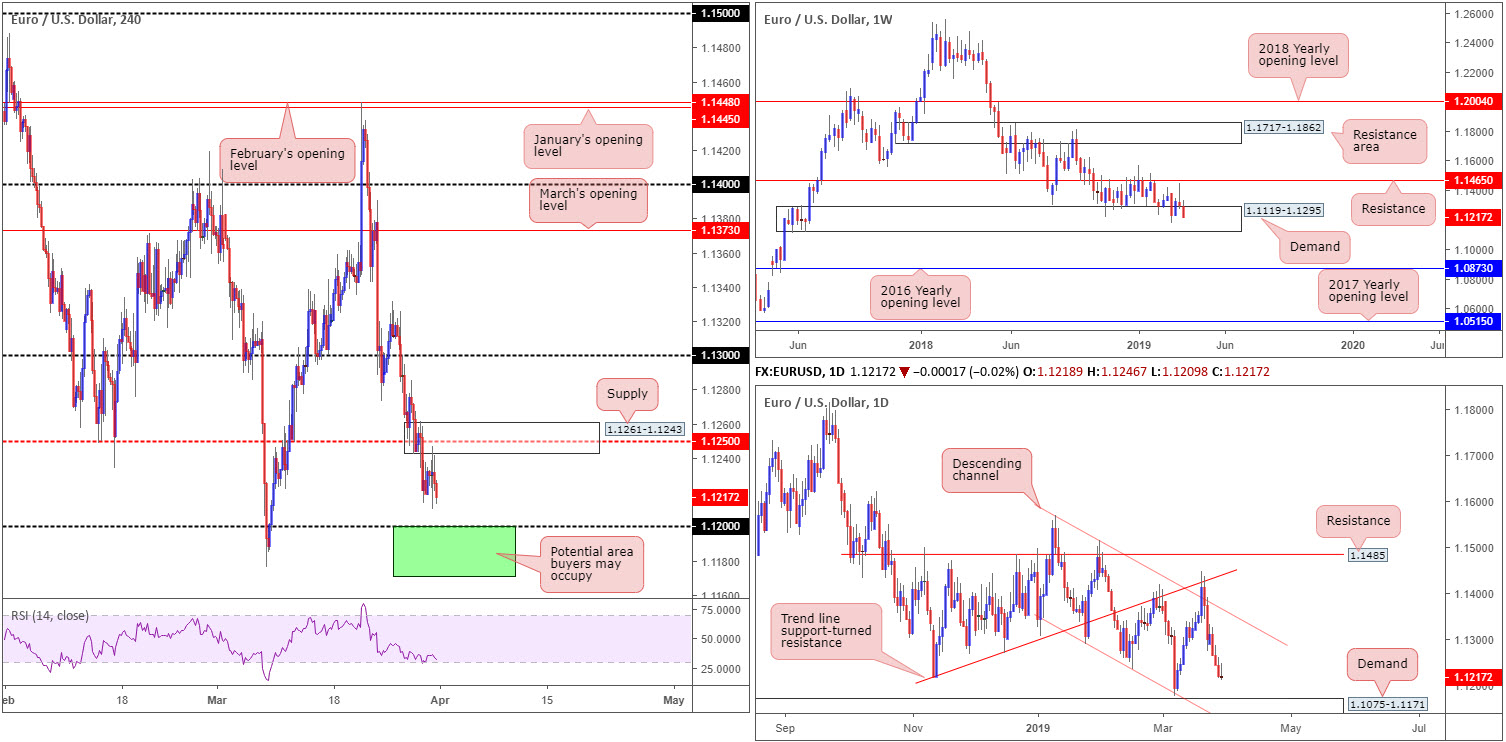
Although steadied by demand coming in at 1.1119-1.1295, price action wrapped up the week closing not too far off its lows, marking its second consecutive losing session.
Overall, the long-term trend on the weekly timeframe continues to face a southerly direction, with traders’ crosshairs now likely fixed on 1.1176: the 2019 yearly low. The next area of interest beyond the current demand, however, falls in around the 2016 yearly opening level priced in at 1.0873.
Daily perspective:
Four out of five trading days concluded in negative territory last week, with Friday’s candle ending by way of a relatively strong bearish pin-bar formation. This, according to our technical studies, places the daily candles in good stead to approach demand at 1.1075-1.1171 this week. Note this demand area is fastened to the underside of the current weekly demand.
H4 perspective:
A brief recap of Friday’s movement on the H4 timeframe witnessed the pair turn lower a few points south of the 1.1250 point. In its place, price responded to the supply zone enclosing the level at 1.1261-1.1243. Moving in sympathy with sterling to an extent, the pair concluded the day closing within striking distance of the 1.12 handle. Traders may want to acknowledge 1.12 is sited within the walls of the aforementioned weekly demand area, and less than thirty points above the current daily demand zone.
Areas of consideration:
1.1171/1.12 (green H4) is in view as a potential area buyers may occupy today/early week. Not only is this zone enclosed within weekly demand, we have the top edge of daily demand present at 1.1171 and also the yearly low lurking at 1.1176.
A handsome H4 bullish candlestick pattern (entry/risk levels can be determined according to this structure) printed from 1.1171/1.12, in light of the region’s confluence, serves as an ideal trigger for buyer intent.
Today’s data points: EUR CPI Flash Estimate y/y; EUR Core CPI Flash Estimate y/y; US Core Retail Sales m/m; US Retail Sales m/m; US ISM Manufacturing PMI.
GBP/USD:
Weekly gain/loss: -1.29%
Weekly close: 1.3034
Weekly perspective:
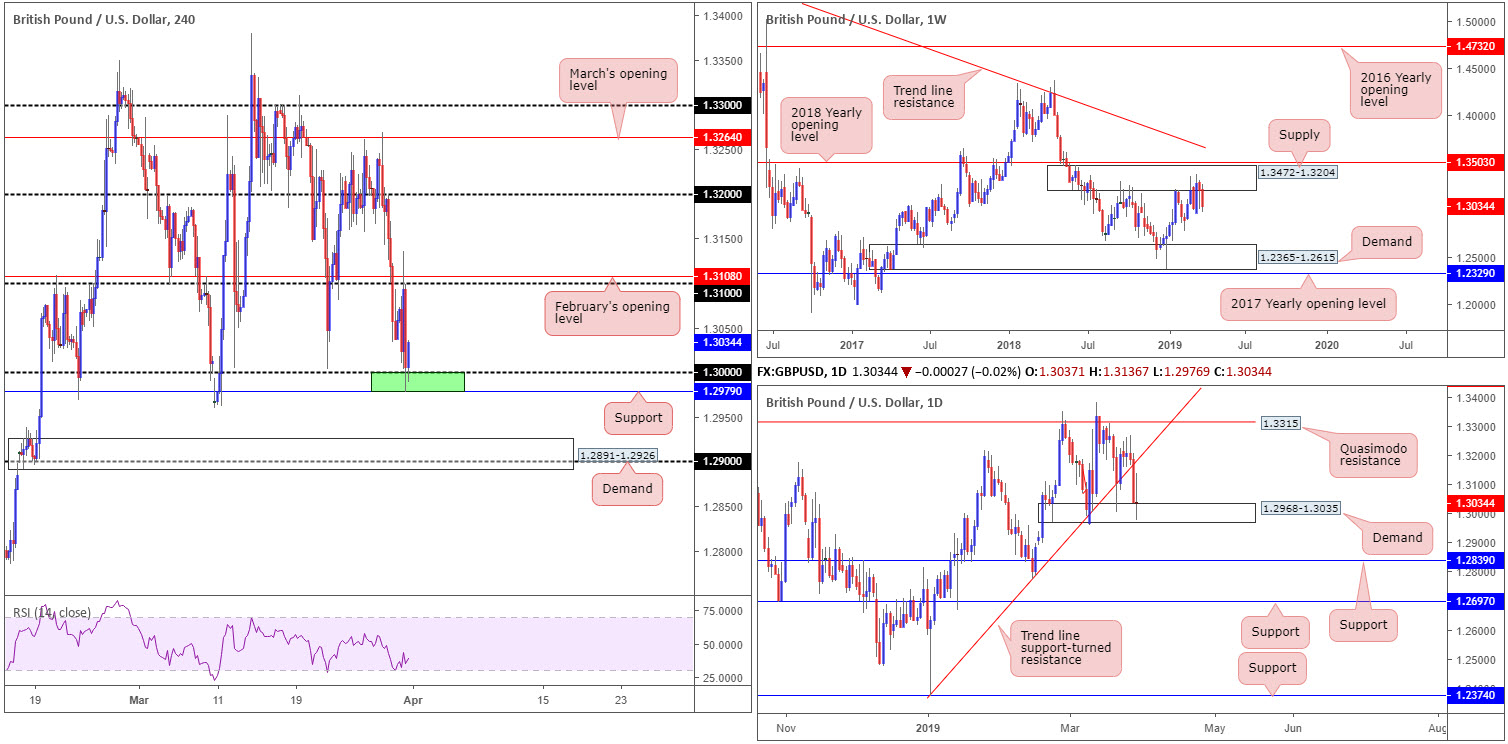
Garnishing the weekly chart is supply drawn from 1.3472-1.3204. Since the end of February this has been home to many traders as price flips between gains/losses. According to structure, last week’s bout of selling should not have come as a surprise, with the next obvious downside target not realised on this timeframe until demand at 1.2365-1.2615.
Daily perspective:
Closer analysis of the daily timeframe, nevertheless, has the pair shaking hands with the top edge of demand at 1.2968-1.3035, following Thursday’s strong break of trend line support (extended from the low 1.2373). Failure to hold at the said demand this week has nearby support at 1.2839 to target.
H4 perspective:
Cable fell sharply Friday after the House of Commons rejected PM Theresa May’s EU Withdrawal Agreement for a third time, unlocking a new stage in the Brexit saga but layering further uncertainty onto the economy and markets in the process. UK MPs voted by a margin of 58 (344 vs. 286) to reject May’s Withdrawal Agreement.
Highs of 1.3135 were observed in London’s morning segment, though price action failed to sustain gains above its 1.31 handle. The unit aggressively pencilled in a sharp U-turn and concluded the day whipsawing through the key figure 1.30 into neighbouring support fixed at 1.2979. 1.32 is seen as viable resistance on this timeframe, whereas continued selling could eventually drag the candles towards demand plotted at 1.2891-1.2926 and merging 1.29 handle.
Areas of consideration:
For folks who read Friday’s briefing you may recall the piece underscoring potential buying from between 1.2979 (the H4 support mentioned above) and key figure 1.30 on the H4 timeframe (green), as the zone resides within the walls of the current daily demand zone underlined above at 1.2968-1.3035. Well done to any of our readers who managed to secure profits into the weekend from here.
In light of the political turmoil in the UK at the moment and the fact we’re trading from weekly supply, traders are urged to reduce risk to breakeven as soon as logically possible. In the event further buying arises, 1.32 sits nicely as the next upside target.
Today’s data points: UK Manufacturing PMI; US Core Retail Sales m/m; US Retail Sales m/m; US ISM Manufacturing PMI.
AUD/USD:
Weekly gain/loss: +0.23%
Weekly close: 0.7095
Weekly perspective:
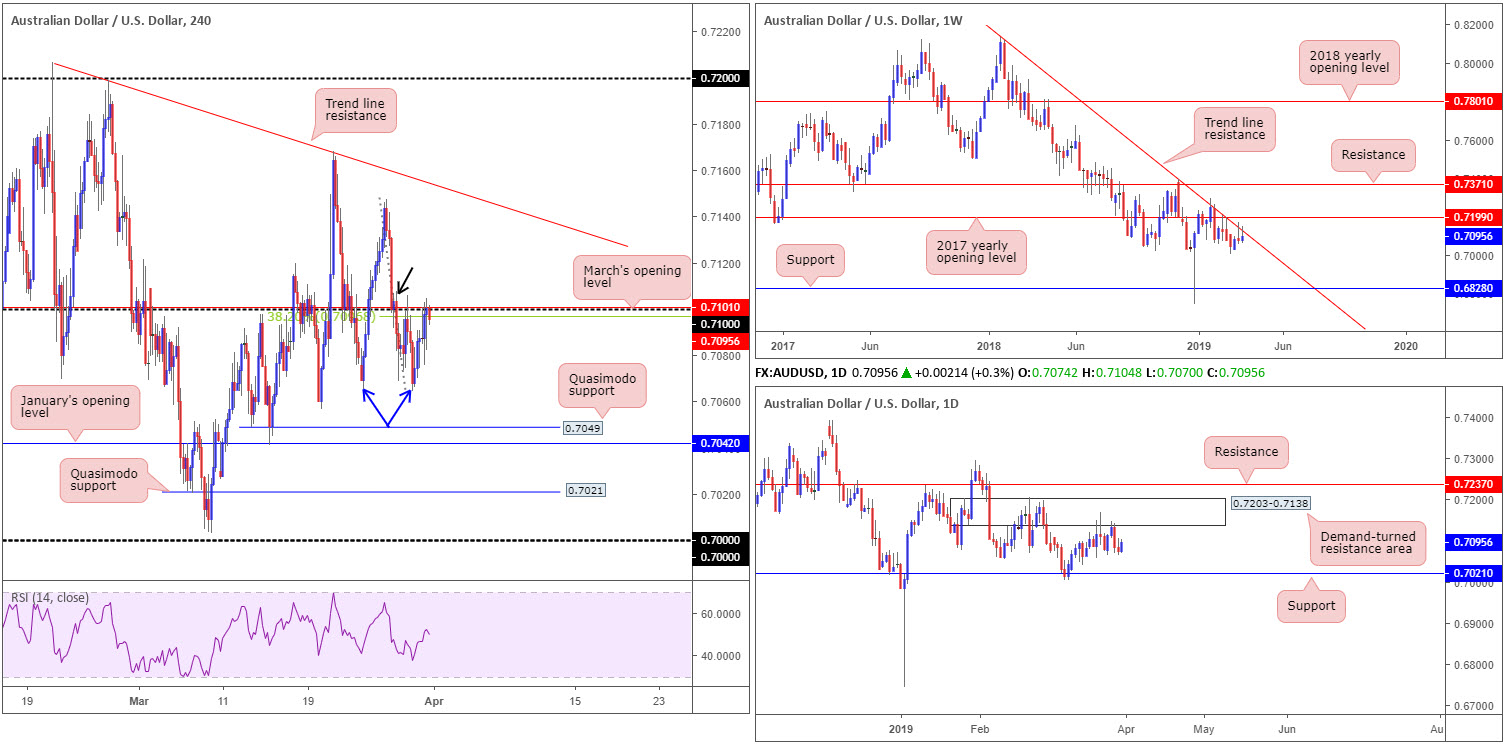
By way of two back-to-back bearish pin-bar patterns, the weekly candles remain kissing the underside of a long-standing trend line resistance (etched from the high 0.8135). The market could eventually observe additional selling take shape from here as downside appears reasonably free until connecting with support coming in at 0.6828.
Daily perspective:
Following a modest rebound off support at 0.7021 early March, the pair, since March 20, has been clinging to the underside of a demand-turned resistance area at 0.7203-0.7138. A push higher from here may land the unit at resistance drawn from 0.7237.
H4 perspective:
Friday’s sessions saw the H4 candles make a run towards 0.71, following Thursday’s break of a local low at 0.7065 (blue arrows). 0.71, as you can probably see, also fuses closely with March’s opening level at 0.7101, a 38.2% Fibonacci resistance value at 0.7097 and a small supply zone at 0.7107-0.7098 (black arrow).
Movement above 0.71 this week exposes the 0.7147 March 26 high, shadowed closely by trend line resistance (etched from the high 0.7206). A rejection from 0.71, on the other hand, likely has lows around 0.7066 in sight, followed by Quasimodo support at 0.7049 and then January’s opening level at 0.7042.
Areas of consideration:
In light of recent moves out of the higher timeframes, and the H4 candles testing the underside of 0.71, this shines the spotlight on possible shorting opportunities this week.
Traders have the choice of entering short at 0.71ish today and placing stop-loss orders above the nearby supply mentioned above at 0.7107. Traders looking to add a little more confirmation to the mix, nonetheless, may opt to wait for a H4 bearish candlestick signal to emerge before pressing the sell button (entry and risk levels can be decided according to the pattern’s rules of engagement).
Today’s data points: Chinese Manufacturing PMI and Non-Manufacturing PMI; Caixin Manufacturing PMI; US Core Retail Sales m/m; US Retail Sales m/m; US ISM Manufacturing PMI.
USD/JPY:
Outlook unchanged.
Weekly gain/loss: +0.86%
Weekly close: 110.85
Weekly perspective:
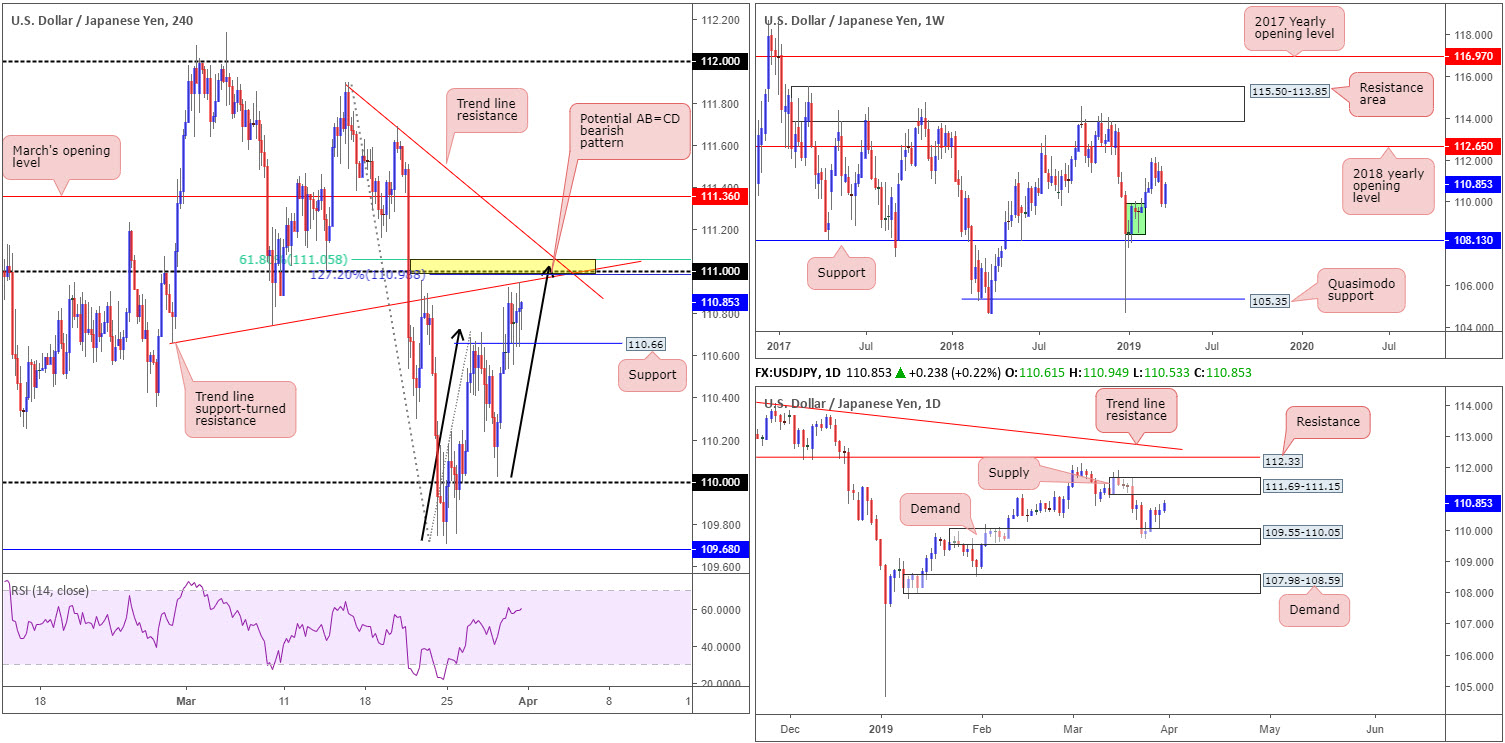
A better-than-expected response from demand marked in green at 108.49/109.74 witnessed the market reclaim a large portion of prior weekly losses. While this has likely enticed breakout traders into the market, support at 108.13 remains the more appealing level for buyers on this timeframe. By and of itself, the aforesaid demand area achieved very little in terms of breaking anything significant to the left.
Essentially, this could mean we may be in for a push lower in the weeks to come.
Daily perspective:
Closer analysis on the daily timeframe guides the spotlight towards an area of supply this week at 111.69-111.15, following recent buying emerging from the top edge of nearby demand carved at 109.55-110.05.
In terms of structure, the aforesaid supply is considered local on this scale, therefore, traders are urged to pencil in the possibility of a move beyond here this week towards resistance at 112.33 and neighbouring trend line resistance (extended from the high 114.23).
H4 perspective:
A reasonably buoyant dollar, as well as a recovering US 10-year Treasury yield and US equities exploring higher ground, reinforced the USD/JPY market Friday. As is evident from the chart, the pair ended the day testing the underside of a trend line support-turned resistance (drawn from the low 110.66). This – coupled with the 111 handle, a merging AB=CD 127.2% bearish pattern at 110.98 (black arrows), another trend line resistance (from the high 111.90) and a 61.8% Fibonacci resistance at 111.05 – has ‘sell zone’ plastered all over it. What’s also notable from a technical perspective is the lower edge of a daily supply seen overhead at 111.69-111.15.
Areas of consideration:
Keeping it simple, the 111 handle remains, according to our markings, a high-probability sell zone with a healthy dose of nearby H4 and daily confluence.
Entry at 111.00 with a stop-loss order set above the current H4 trend line resistance is an option, though some traders may prefer waiting for additional confirmation which will likely offer different entry and exit parameters. Ultimately, the first take-profit area, as of current price, can be seen around local support on the H4 timeframe at 110.66.
Today’s data points: US Core Retail Sales m/m; US Retail Sales m/m; US ISM Manufacturing PMI.
USD/CAD:
Weekly gain/loss: -0.60%
Weekly close: 1.3346
Weekly perspective:
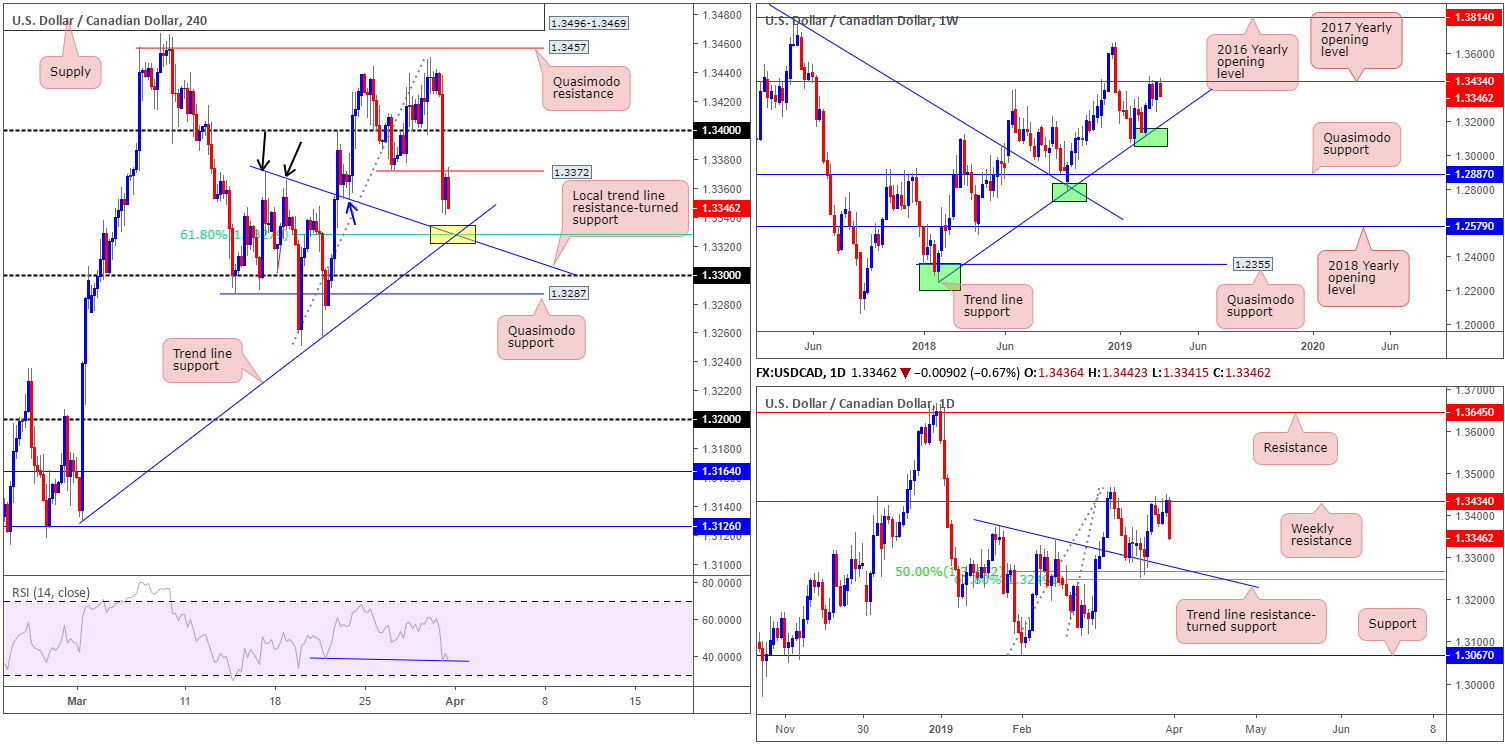
In recent weeks, the USD/CAD engaged with notable resistance at 1.3434 (the 2017 yearly opening level) following a dominant push higher from trend line support (taken from the low 1.2247). Should price action run through 1.3434 this week, nevertheless, keep tabs on the 1.3664 Dec 31 high, followed reasonably closely by the 2016 yearly opening level at 1.3814.
Daily perspective:
In terms of daily action, the selloff from the 2017 yearly opening level on the weekly timeframe at 1.3434 – just look at the strength of Friday’s near-full-bodied daily bearish candle – may generate additional selling this week, targeting a 50.0% support at 1.3267, merging closely with a 61.8% Fibonacci support at 1.3248 and a trend line resistance-turned support (extended from the high 1.3375).
H4 perspective:
Canadian GDP surpassed expectations Friday, expanding 0.3% in January. This, as expected, sent the Canadian dollar higher vs. its US peer. The USD/CAD market overthrew the 1.34 handle in strong fashion, bottoming a few points north of a trend line resistance-turned support (taken from the high 1.3371). What’s also noteworthy here is the fusing 61.8% Fibonacci support at 1.3327, trend line support (etched from the low 1.3130) and RSI divergence (blue line).
Areas of consideration:
The confluence merging around 1.3327 (see above in bold – yellow) on the H4 timeframe for a long is appealing, despite the area offering limited higher-timeframe convergence. In fact, buying from the said confluence entails buying into potential weekly selling. For that reason, traders are urged to consider waiting for additional confirmation to form before pulling the trigger (entry and risk levels can be determined according to this structure), targeting H4 resistance at 1.3372 as the initial take-profit zone.
Today’s data points: US Core Retail Sales m/m; US Retail Sales m/m; US ISM Manufacturing PMI; BoC Gov. Poloz Speaks.
USD/CHF:
Outlook unchanged.
Weekly gain/loss: +0.19%
Weekly close: 0.9951
Weekly perspective:
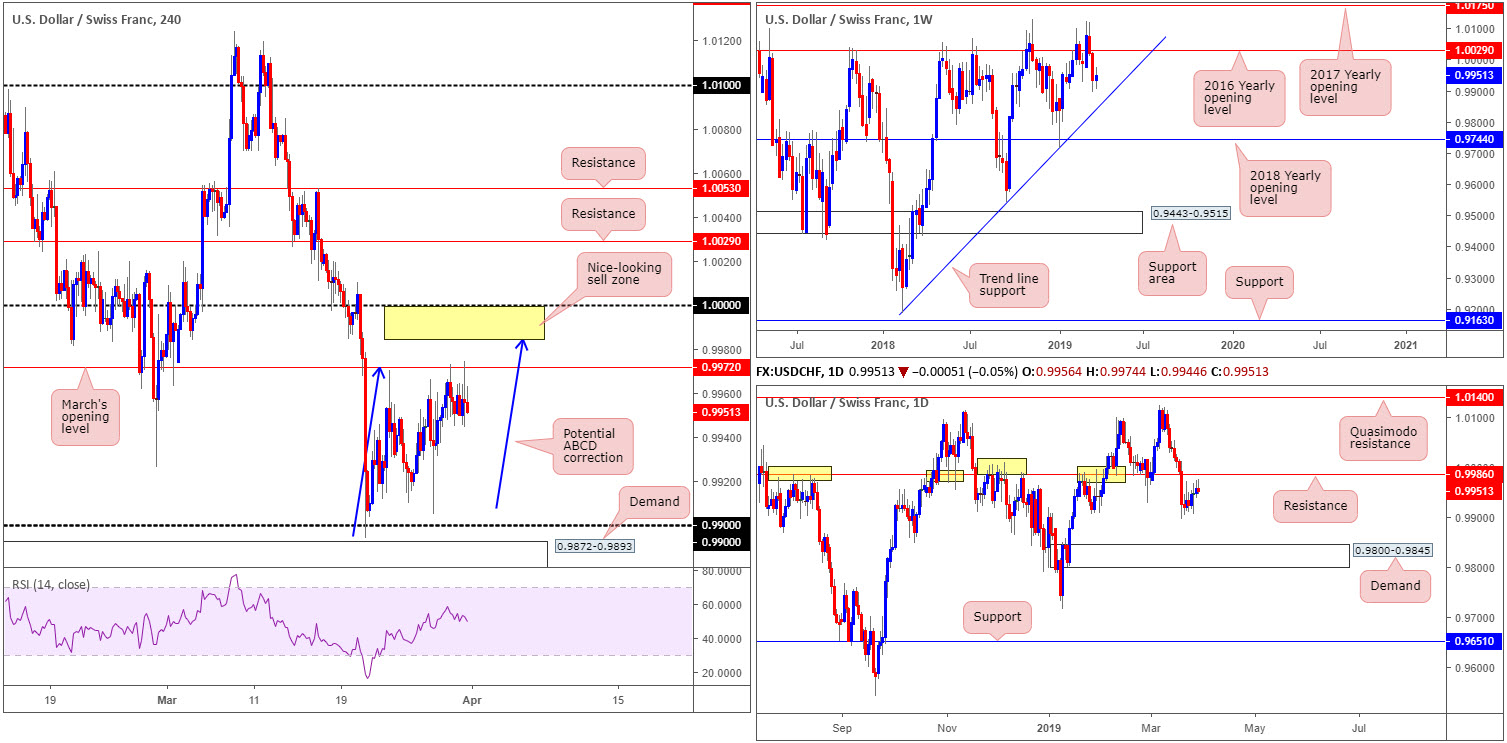
Following two weeks of strong losses beneath the 2016 yearly opening level at 1.0029, the USD/CHF half-heartedly attempted at a recovery last week, up less than 20 pips. Lower levels remain promising this week, with trend line support (extended from the low 0.9187) heading the hit list. Beyond here, the 2018 yearly opening level at 0.9744 is next in line.
Daily perspective:
Daily flow, aside from the 0.9905 Jan 28 low holding as temporary support, also demonstrates potential to charge as far south as demand plotted at 0.9800-0.9845. Note this area is positioned close by the aforementioned weekly trend line support.
Another possibility, of course, is a retest of nearby resistance coming in at 0.9986. By and of itself, this is a notable base with a healthy history dating as far back as November 2017.
H4 perspective:
Movement was somewhat subdued Friday as the market set in a measured response from the underside of March’s opening level at 0.9927. On the whole, though, the research team still believes downside is limited, given the 1.0000 (parity) key figure likely to act as a magnet to price.
In terms of support, the round number 0.99 is in sight, as is nearby demand plotted at 0.9872-0.9893. It might also interest some traders to note a potential bearish ABCD (blue arrows) correction pattern that’s seen terminating a few points south (0.9985) of 1.0000.
Areas of consideration:
The daily resistance mentioned above at 0.9986 remains of interest as a possible sell zone. Traders may also like the fact it merges, assuming H4 price pushes higher, with the ABCD bearish pattern mentioned above at 0.9985.
Between 1.0000 (parity) and 0.9985 (yellow), therefore, is a reasonably solid sell zone to have on the watchlist. As round numbers are prone to fakeouts, though, entering on additional confirmation is a point worth considering – entry and risk levels can then be determined according to your chosen confirmation method.
Today’s data points: US Core Retail Sales m/m; US Retail Sales m/m; US ISM Manufacturing PMI.
Dow Jones Industrial Average:
Weekly gain/loss: +1.64%
Weekly close: 25923
Weekly perspective:
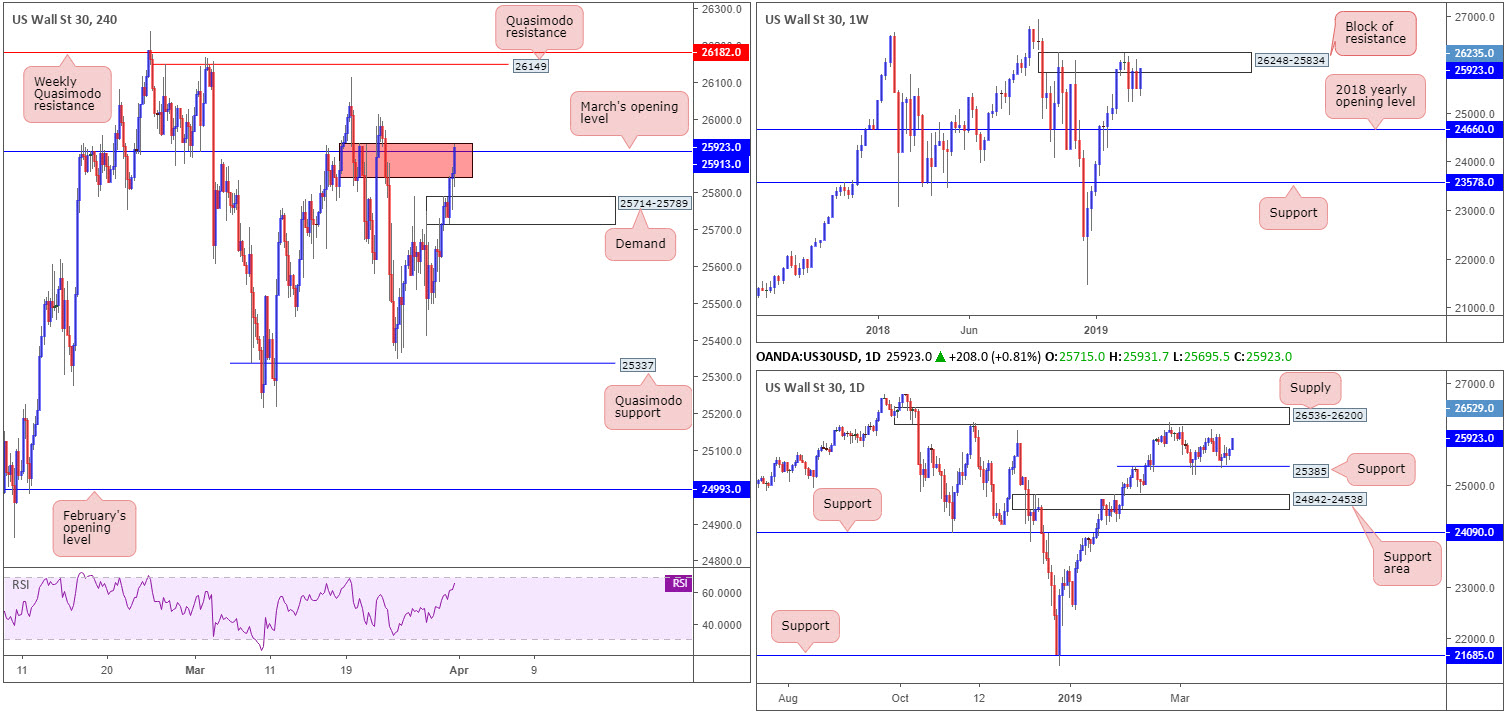
US equities concluded the final trading week of the first quarter on a strong note, up more than 400 points, or 1.64 percent. Closing not too far off its weekly high 25931 and erasing all of the prior week’s losses, the index is seen revisiting a block of resistance at 26248-25834, an area traders have called home since early February. Downside from this point could eventually see the index knocking on the door of its 2018 yearly opening level at 24660, whereas further buying has the all-time high 26939 to target.
Daily perspective:
Support at 25385 elbowed its way into the fight Monday and extended gains Tuesday. Wednesday witnessed the unit mildly pullback from session highs at 25749 and produce an indecision candle, though Thursday and Friday spun higher.
A push beneath 25385 will likely bring in a nearby daily support area seen at 24842-24538. Additional buying, on the contrary, may brush aside the 26114 March 19 high and shake hands with supply pictured at 26536-26200.
H4 perspective:
Boosted by optimism over the latest round of trade talks between the United States and China, the unit explored higher ground Friday. The talks, aimed at resolving a nearly nine-month trade dispute between the world’s two largest economies, were labelled ‘candid and constructive’ by Washington.
Friday concluded marginally overthrowing March’s opening level at 25913, though failed to clear an ignored supply zone marked in red at 25935-25842. A break above here, aside from minor tops seen around 26011 and 26114, could potentially aim for Quasimodo resistance at 26149, followed by the weekly Quasimodo resistance underlined above at 26182.
Areas of consideration:
The H4 Quasimodo resistance alongside its nearby weekly Quasimodo resistance at 26182/26149 is an area of interest this week for selling. Not only is the zone fixed within the current block of resistance on the weekly timeframe at 26248-25834, it’s positioned directly beneath the lower boundary of daily supply mentioned above at 26536-26200. Entry at 26149 with a stop-loss order plotted above the upper limit of the aforementioned daily supply will, for most traders, be too large of a stop. To help overcome this, traders are urged to watch H4 action once 26182/26149 is in play. A H4 bearish candlestick pattern emerging from here would, given the overall picture, be a worthwhile sell (entry/risk can then be determined according to the candlestick’s rules of engagement).
Today’s data points: US Core Retail Sales m/m; US Retail Sales m/m; US ISM Manufacturing PMI.
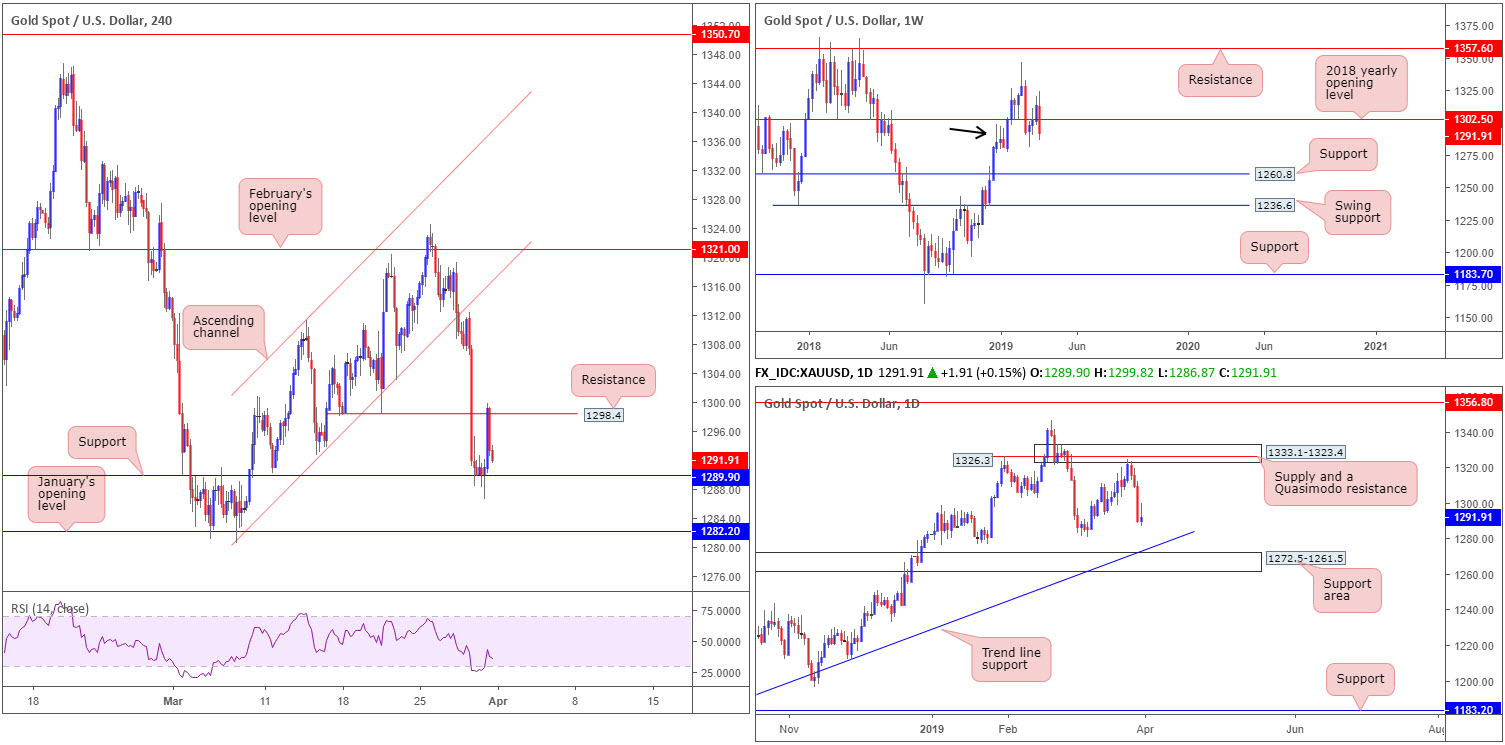
XAU/USD (GOLD):
Weekly gain/loss: -1.62%
Weekly close: 1291.9
Weekly perspective:
The broader picture reveals the yellow metal recently snapped back beneath its 2018 yearly opening level at 1302.5, by way of a strong bearish engulfing candle. Although viewed by some as a bearish cue to potentially push lower this week, it is worth pencilling in demand (black arrow) at 1276.9-1295.8. A break south of this area has support at 1260.8 to target.
Daily perspective:
Supply at 1333.1-1323.4, which happens to hold a Quasimodo resistance within at 1326.3, nudged its way into the limelight in the early stages of last week. Selling from here, as you can see, produced three consecutive near-full-bodied bearish candles.
The point of support to be aware of on this scale is the 1281.0 March 7 low, followed by a support area coming in at 1272.5-1261.5 and merging trend line support (taken from the low 1160.3).
H4 perspective:
A modest recovery observed in US Treasury yields at the later stages of last week, as well as a robust dollar into the close, weighed on traditional safe-haven markets.
The H4 candles met reasonably strong buying from local support priced in at 1289.9 Friday, though failed to overthrow double-bottom support-turned resistance at 1298.4. In view of this and taking into account the bigger picture, January’s opening level at 1282.2 is likely favoured as the next support on this timeframe this week.
Areas of consideration:
As the yellow metal recently re-entered the jaws of weekly demand at 1276.9-1295.8, albeit on the back of strong selling, a bounce from January’s opening level on the H4 timeframe at 1282.2 and merging support seen at the 1281.0 March 7 low (daily timeframe) could be an option today/early week. An added bonus would be H4 price chalking up a candlestick signal off 1281.0/1282.2, consequently identifying buyer intent and also serving as a base to determine entry and risk levels. In regards to an initial take-profit target, 1289.9 (will be resistance at this point) is a potential candidate.
The accuracy, completeness and timeliness of the information contained on this site cannot be guaranteed. IC Markets does not warranty, guarantee or make any representations, or assume any liability with regard to financial results based on the use of the information in the site.
News, views, opinions, recommendations and other information obtained from sources outside of www.icmarkets.com.au, used in this site are believed to be reliable, but we cannot guarantee their accuracy or completeness. All such information is subject to change at any time without notice. IC Markets assumes no responsibility for the content of any linked site. The fact that such links may exist does not indicate approval or endorsement of any material contained on any linked site.
IC Markets is not liable for any harm caused by the transmission, through accessing the services or information on this site, of a computer virus, or other computer code or programming device that might be used to access, delete, damage, disable, disrupt or otherwise impede in any manner, the operation of the site or of any user’s software, hardware, data or property.