
Key risk events today:
China GDP q/y; Fed Chair Powell and ECB President Lagarde Speaks; BoC Business Outlook Survey.
(Previous analysis as well as outside sources – italics).
EUR/USD:
Weekly gain/loss: -0.98%
Weekly close: 1.1713
Weekly perspective:
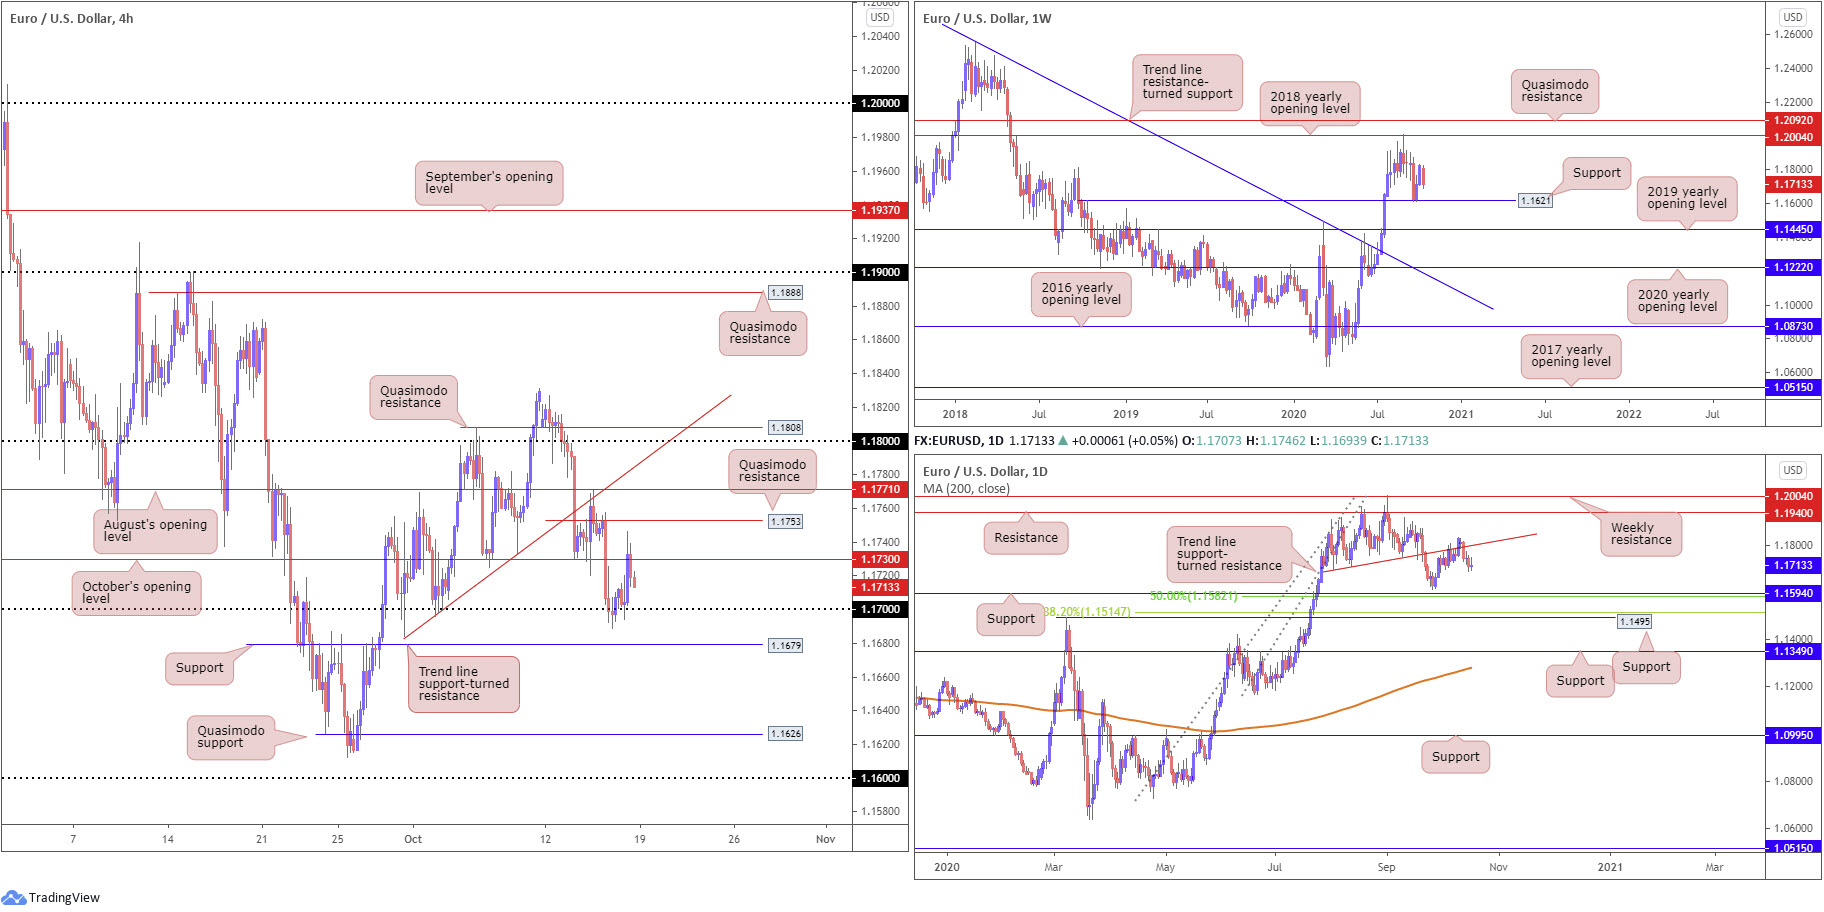
Since ousting trend line resistance (mid-July), taken from the high at 1.2555, EUR/USD has outlined an upside bias.
Yet, after shaking hands with the 2018 yearly opening value at 1.2004 late August, buyers stepped aside. This saw minor support from 1.1621, set above the 2019 yearly opening value at 1.1445, make an appearance in recent weeks, with many likely interpreting this as a dip-buying signal.
Despite last week’s 110-pip decline, traders are likely to monitor 1.1621 and 1.2004 closely this week.
Daily perspective:
Trend line support-turned resistance, etched from the low 1.1695, proved to be an effective ceiling last week. Additional moves to the downside this week offer support (a prior Quasimodo resistance level) at 1.1594 (and a 50.0% retracement ratio at 1.1582), whereas resistance rests at 1.1940 should decisive buying surface.
It should also be pointed out the support level at 1.1594 shares a close relationship with weekly support underscored above at 1.1621.
H4 perspective:
The 1.17 handle, as you can see, withstood a number of downside attempts heading into the second half of last week, with Friday eventually advancing to October’s opening value at 1.1730 (highs missed a neighbouring Quasimodo resistance base at 1.1753 by a hair).
Beyond 1.1753 this week, traders’ crosshairs are likely fixed on August’s opening value from 1.1771 and the 1.18 handle (accompanied by a Quasimodo resistance at 1.1808 and a trend line support-turned resistance, extended from the low 1.1684). South of 1.17, on the other hand, support resides at 1.1679, followed by Quasimodo support plotted at 1.1626 and the 1.16 level.
Areas of consideration:
Significant levels of interest this week fall in at the 1.18 and 1.16 levels.
1.18 is appealing due to it sharing space with the daily trend line resistance, as well as converging with a H4 trend line resistance and Quasimodo resistance.
1.16 is also attractive given its position between daily support at 1.1594 and weekly support at 1.1621.
H4 support and resistance levels between 1.18/1.16 are considered lower timeframe levels, meaning intraday strategies will likely focus on these areas this week.
GBP/USD:
Weekly gain/loss: -0.98%
Weekly close: 1.2914
Weekly perspective:
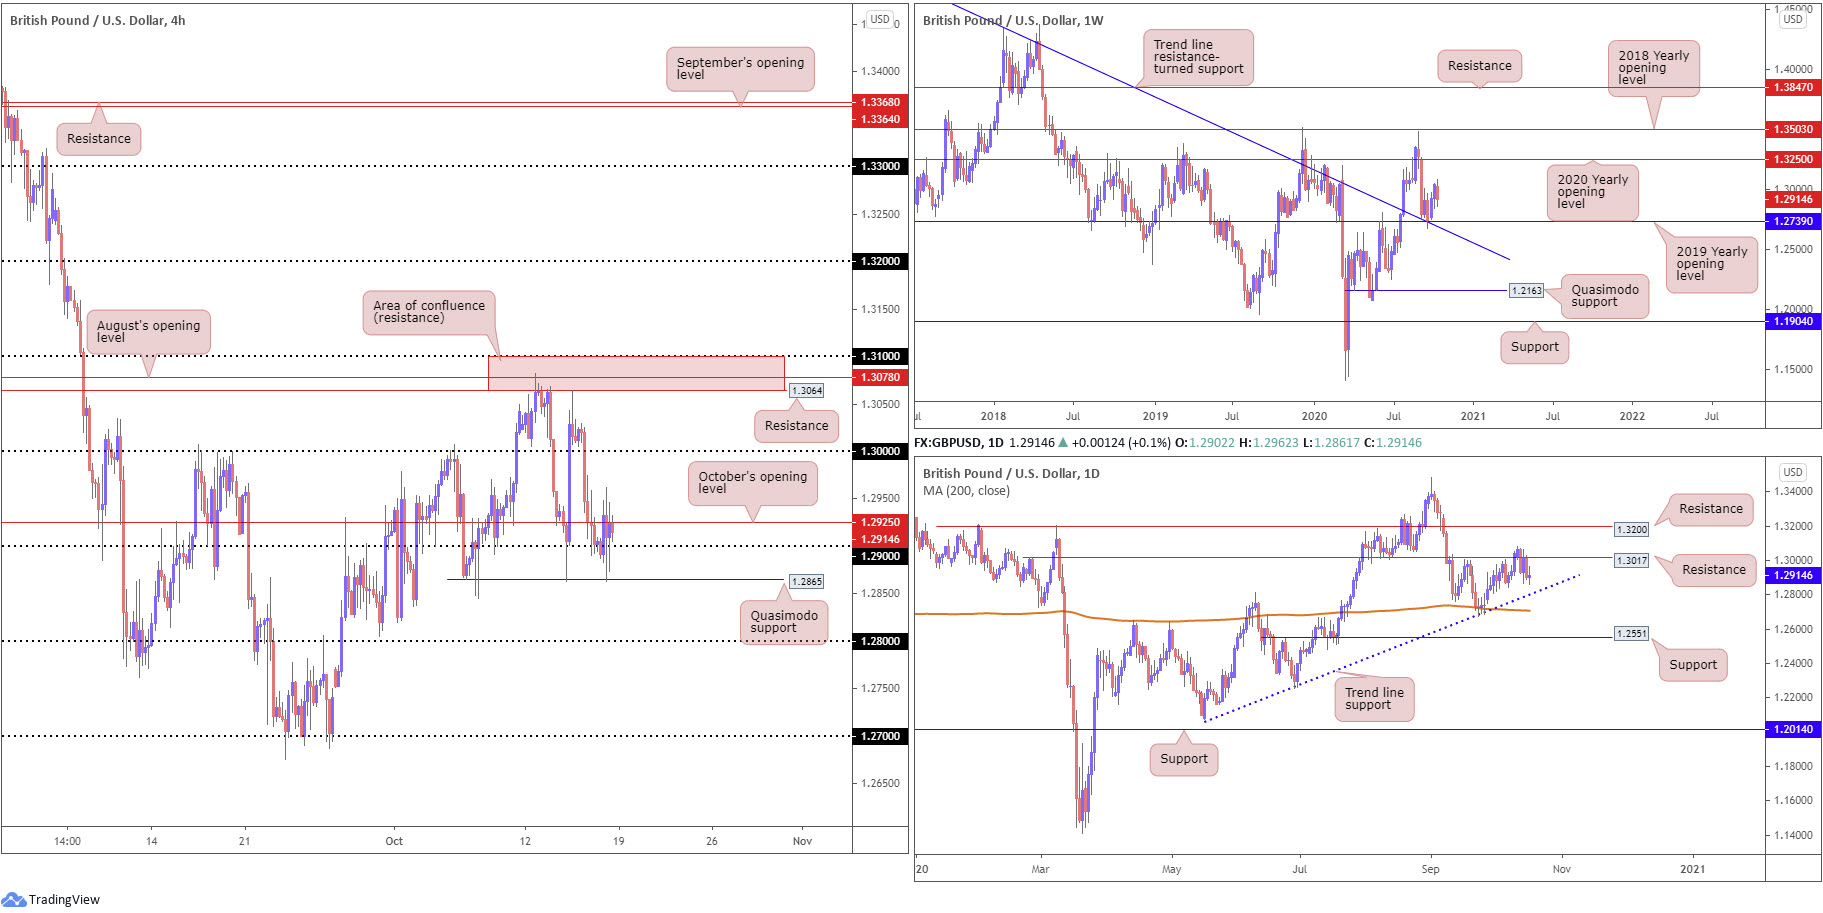
GBP/USD, as you can see, recently recoiled from support at 1.2739 (a 2019 yearly opening value), a level blending with trend line resistance-turned support, extended from the high 1.5930. It is worth pointing out the aforementioned trend line was engulfed in late July this year, announcing an uptrend could be on the cards.
The rebound from 1.2739, therefore, was possibly viewed as a dip-buying opportunity, targeting the 2020 yearly opening value at 1.3250.
Should 1.2739 fail, nonetheless, the 1.2251 low (June 29) is in sight, shadowed by Quasimodo support from 1.2163.
Daily perspective:
1.3017 gifted the market with almost pip-perfect support and resistance since we kicked off August. Last week, although marginally peeking above the level, saw 1.3017 deliver resistance, leading candle action to within walking distance of trend line support, taken from the low 1.2075.
Interestingly, below the current trend line, a 200-day SMA (orange – 1.2707) merges closely with weekly support addressed above at 1.2739 (2019 yearly opening value). Above 1.3017 on the daily timeframe, however, resistance is set at 1.3200, 50 pips under weekly resistance (2020 yearly opening value at 1.3250).
H4 perspective:
Following Thursday’s precipitous decline from 1.31/1.3064 resistance (red – composed of the 1.31 handle, resistance from 1.3064 and August’s opening value at 1.3078), movement that overthrew the key 1.30 figure, Friday witnessed buyers and sellers battle for position around the 1.29 neighbourhood, aided by October’s opening value at 1.2925 and a Quasimodo support at 1.2865.
The next downside target lies at the 1.28 handle; breaking 1.2925 shows limited resistance until 1.30.
Areas of consideration this week:
1.28 on the H4, having seen the psychological base connect with daily trend line support.
1.27 on the H4, given the level merges closely with the 200-day SMA and weekly support at 1.2739 (2019 yearly opening value).
1.31 on the H4, a level that forms part of the H4 resistance zone between 1.31/1.3064.
AUD/USD:
Weekly gain/loss: -2.26%
Weekly close: 0.7076
Weekly perspective:
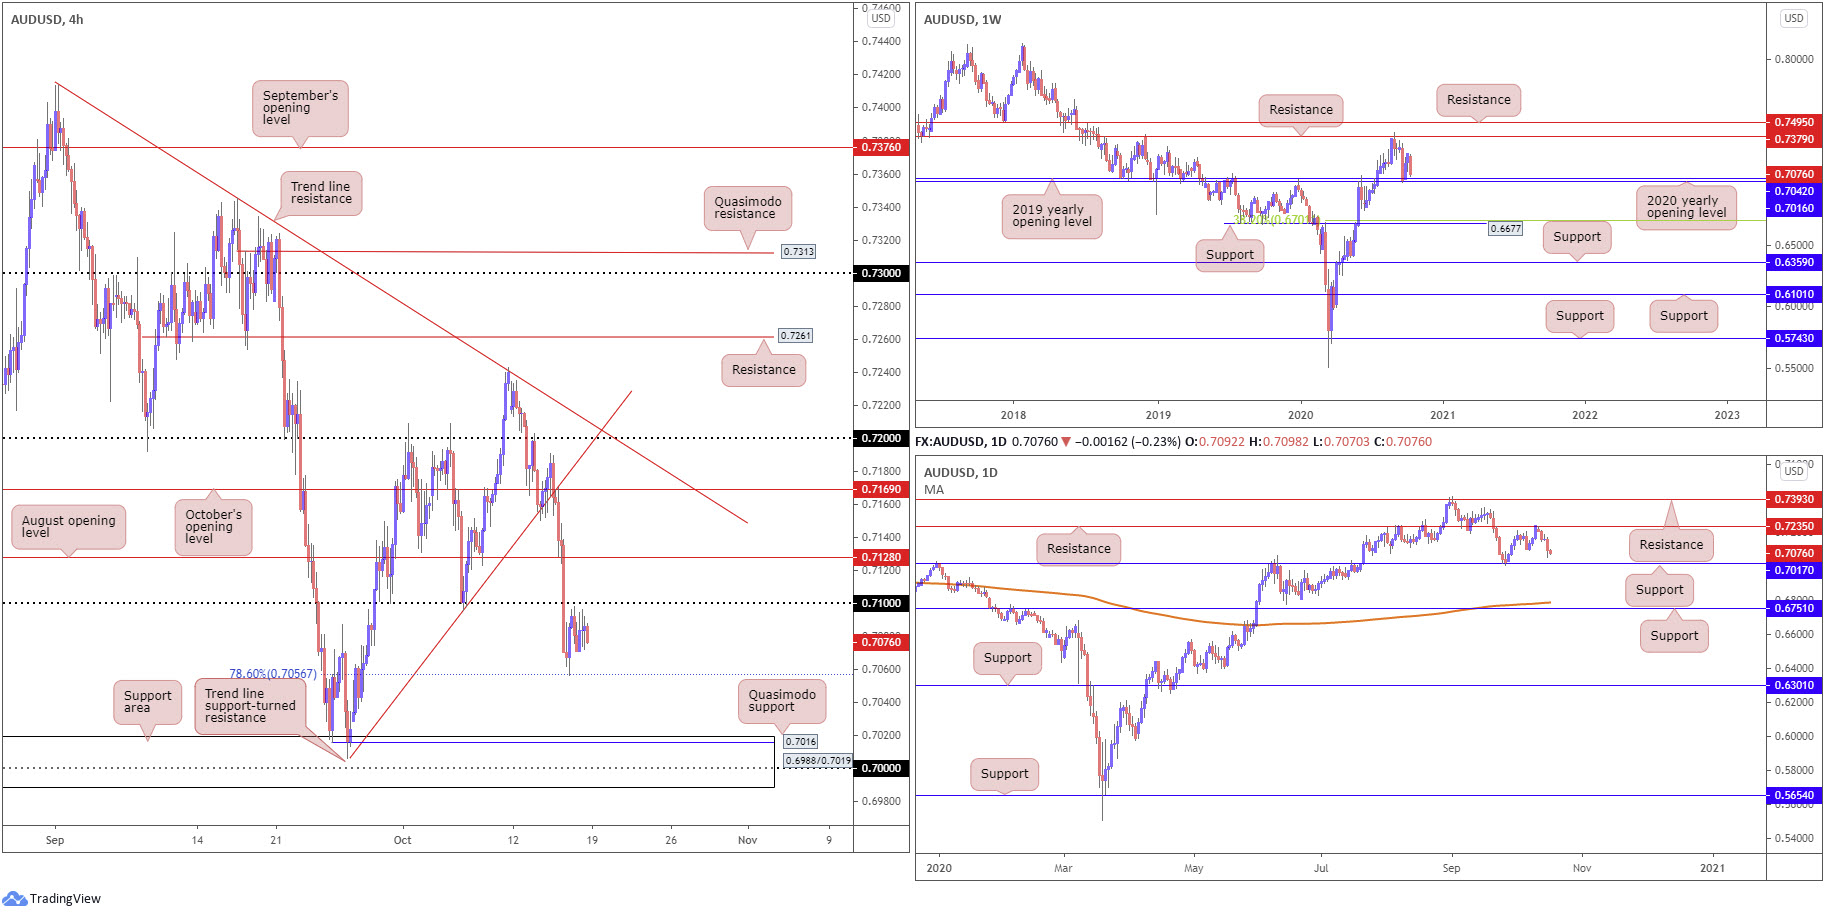
In spite of last week’s 160-pip correction, buyers still have a hand in this fight, according to the weekly timeframe’s technical structure.
Buyers recently pencilled in a strong presence off the 2020 (0.7016) and 2019 (0.7042) yearly opening values, with resistance at 0.7379 calling for attention should an advance materialise this week. It might also be worth noting the trend in this market remains to the upside.
Failure to maintain position off 0.7016/0.7042 shifts focus towards support plotted at 0.6677, and a corresponding 38.2% Fibonacci retracement ratio at 0.6701.
Daily perspective:
As the week fired up, resistance at 0.7235 capped bullish attempts and ultimately set the tone for the week.
Price action concluded within striking distance of support at 0.7017, with a break here exposing the 200-day SMA (orange – 0.6788) and another layer of support from 0.6751.
H4 perspective:
After tunnelling through a number of key supports Thursday, the 78.6% Fibonacci retracement ratio at 0.7056 offered some much-needed respite, which extended into Friday’s session.
Current action is now poised to retest the underside of the 0.71 handle (with a break pointing technical eyes towards August’s opening value at 0.7128), while beyond 0.7056 positions a support area at 0.6988/0.7019 in the mix, a zone holding the key figure 0.70 within and also a Quasimodo support level at 0.7016.
Areas of consideration:
The H4 support area at 0.6988/0.7019 shines bright this week, bolstered by strong confluence (0.70 handle, H4 Quasimodo support at 0.7016, weekly support from 0.7016 and daily support priced in at 0.7017).
H4 resistances (including 0.71) seen at 0.7128 (August’s opening value), 0.7169 (October’s opening value) and 0.72 lack higher timeframe confluence.
With weekly and daily price showing room to trade lower, retesting 0.71 as resistance on the H4 timeframe could have sellers make a show, ultimately targeting the H4 support zone at 0.6988/0.7019 which is a point of strong bullish confluence.
USD/JPY:
Weekly gain/loss: -0.21%
Weekly close: 105.37
Weekly perspective:
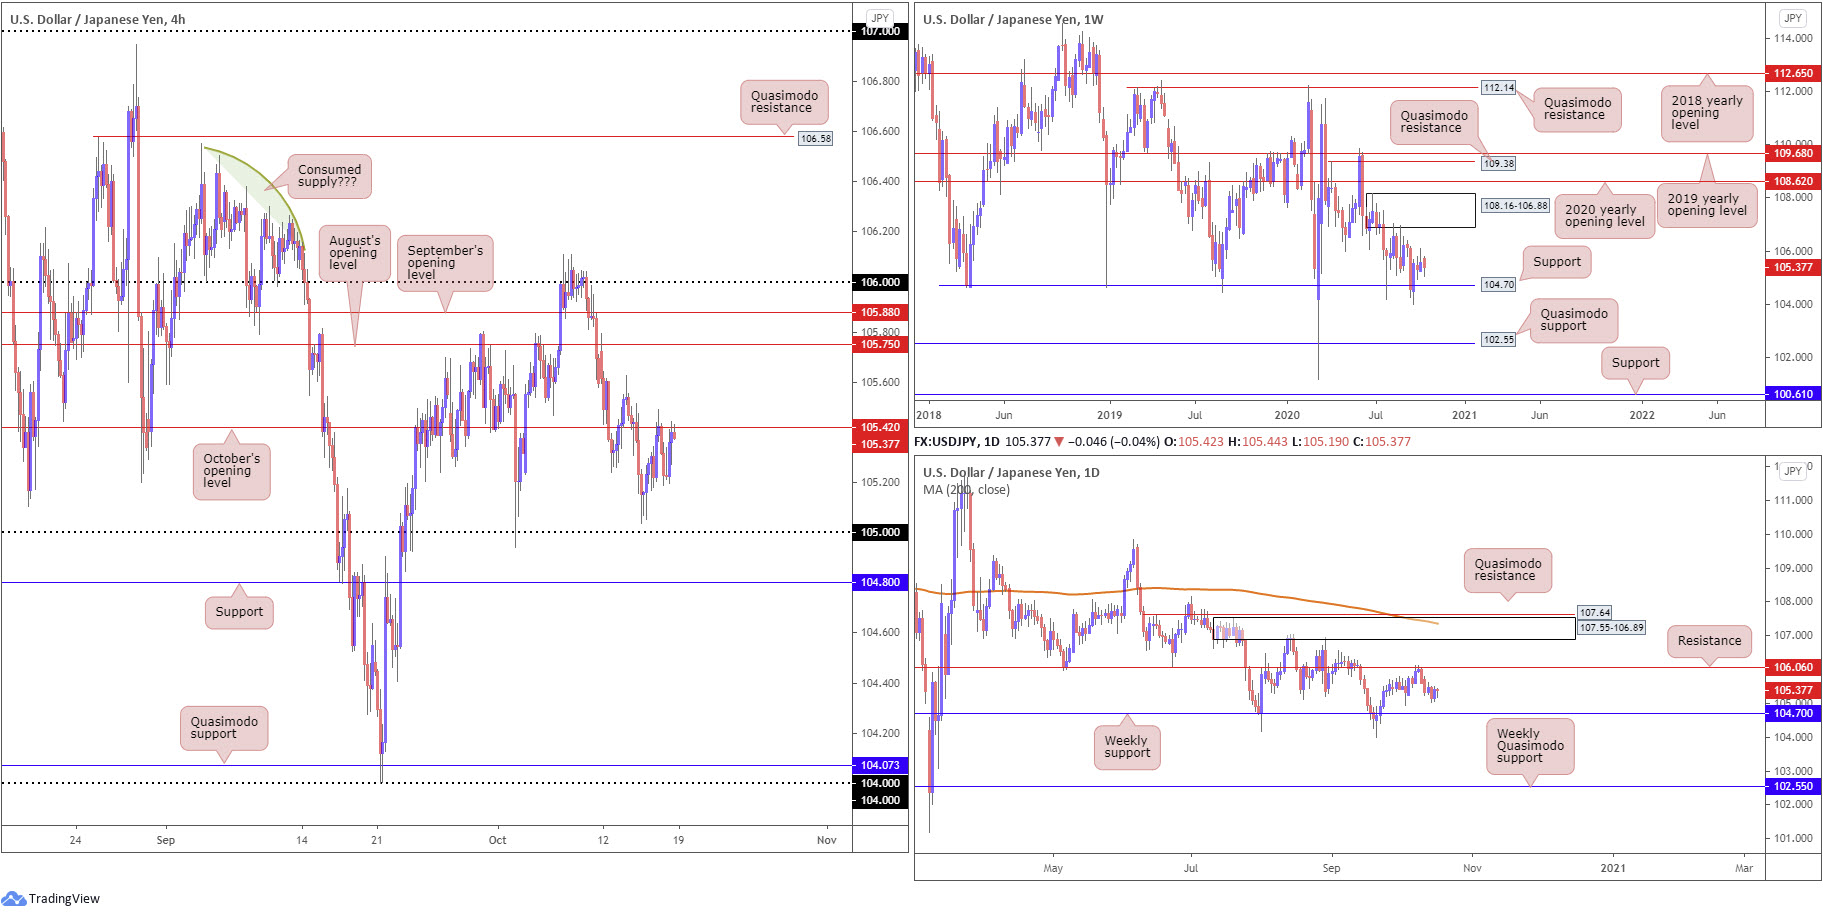
Over the past three weeks, USD/JPY highlighted a somewhat stable attitude, rocking between 106.10/104.94. July and September, however, rebounded from support at 104.70, with the month of August capped by supply at 108.16-106.88.
Quasimodo support at 102.55 offers a feasible target beyond current support in the event we turn south, while removing supply draws the 2020 yearly opening value at 108.62 into the fight.
Daily perspective:
Aside from Monday’s near-full-bodied bearish candle, daily action spent the week fluctuating between gains/losses at 105.62/105.03.
Prominent areas to be aware of on the daily chart this week are resistance drawn from 106.06 and the weekly support level at 104.70.
If resistance at 106.06 gives way, supply at 107.55-106.89, an area housed within the lower boundary of weekly supply underlined above at 108.16-106.88, is seen. Of note, the daily area also benefits from nearby Quasimodo resistance at 107.64 and the 200-day SMA (orange – 107.36).
H4 perspective:
Leaving the 105 handle behind on Wednesday (sited just ahead of support at 104.80), we can see the H4 candles spent the remainder of the week trying to muster enough strength to oust October’s opening value at 105.42. As noted in Friday’s technical briefing, should follow-through buying unfold, August and September’s opening values are seen as the next possible resistance at 105.75 and 105.88, respectively.
Areas of consideration:
A decisive H4 close above 105.42 highlights 105.88/75 as potential upside targets for buyers (followed by the 106 handle). Note this level also forms a bond with daily resistance at 106.06, therefore this could be a location active sellers have on the radar this week. Conservative buyers seeking long positions north of 105.42, however, may seek a 105.42 retest as support (preferably in the shape of a H4 bullish candlestick formation) before committing to a bullish theme.
104.80 H4 support is also interesting this week, pinned just 10 pips ahead of the weekly support level addressed above at 104.70.
USD/CAD:
Weekly gain/loss: +0.51%
Weekly close: 1.3183
Weekly perspective:
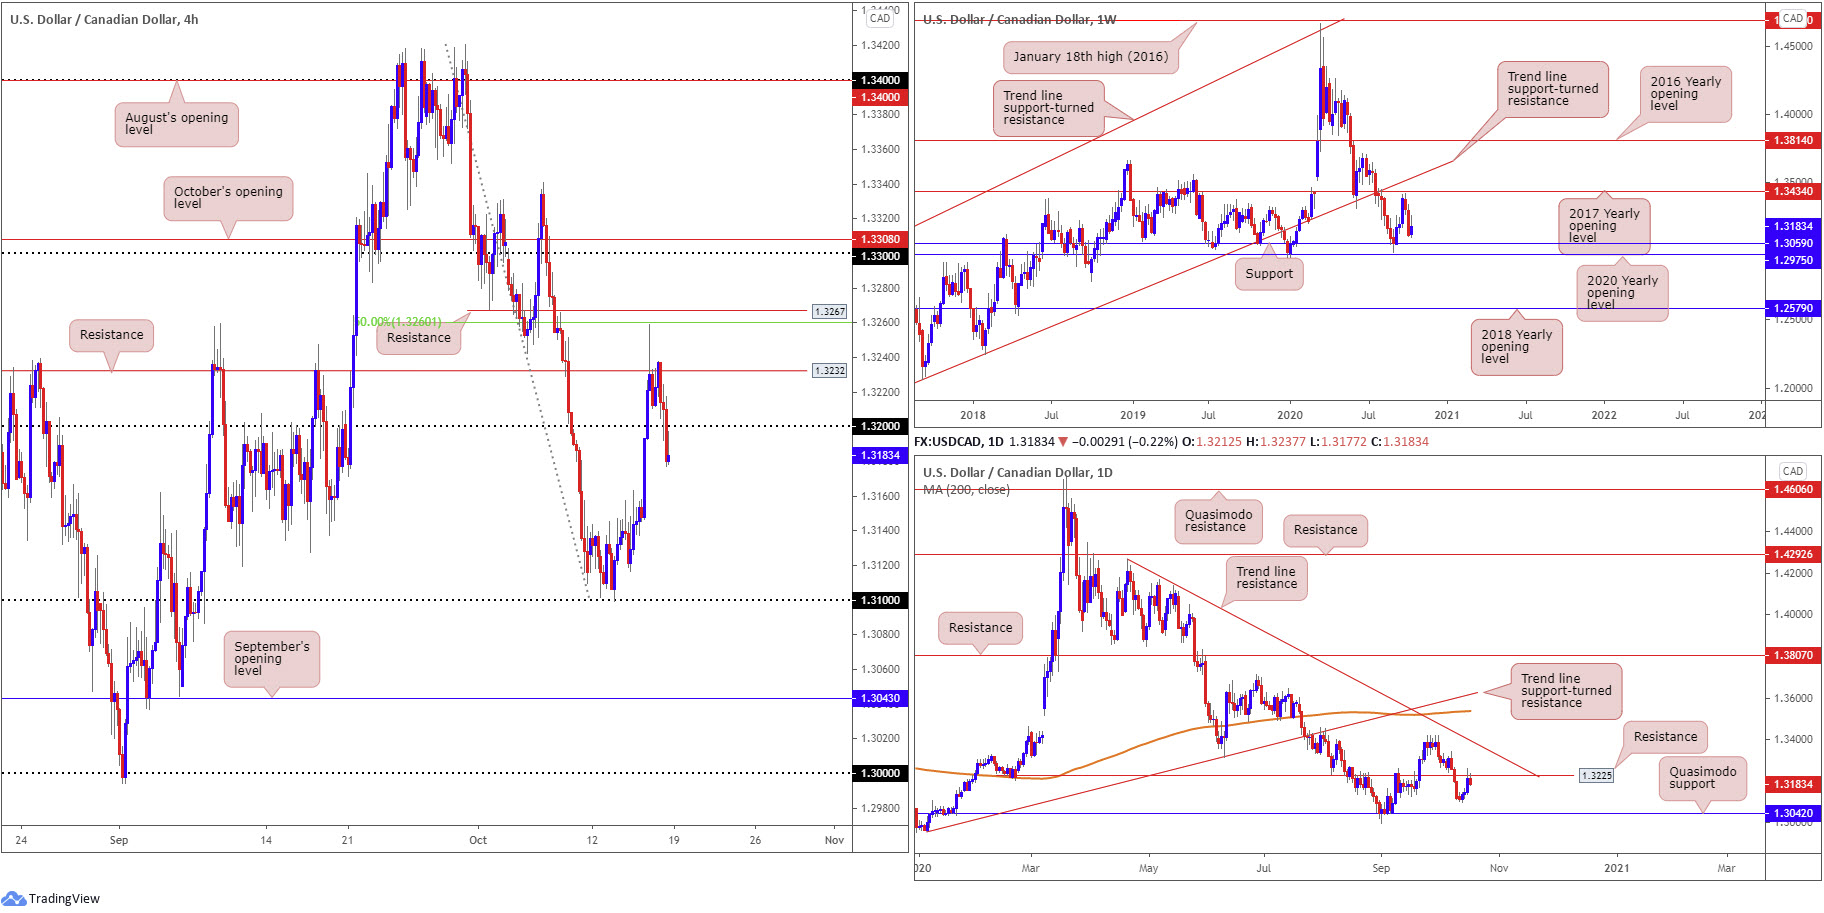
Following a two-week decline south of the 2017 yearly opening value at 1.3434, price movement discovered a floor ahead of support at 1.3059 in recent dealings (arranged above the 2020 yearly opening value at 1.2975).
Daily perspective:
Resistance at 1.3225, as highlighted in Friday’s technical briefing, nudged its way into the spotlight Thursday and held ground Friday. Should the Canadian dollar remain on the winning side of the table this week, revisiting last Tuesday’s lows at 1.3099 may be seen, with follow-through selling to potentially draw in Quasimodo support coming in at 1.3042.
A continuation to the upside this week, nevertheless, could lead candle action to trend line resistance, taken from the high 1.4265.
H4 perspective:
For those who read Friday’s technical report you may recall the following points (italics):
H4, after shaking hands with the 1.31 handle earlier in the week, demolished 1.32 resistance on Thursday and charged into resistance at 1.3232 (missing the 50.0% retracement ratio at 1.3260 by a point, sited just south of another layer of resistance at 1.3267). Note that not only does the latter merge closely with daily resistance, price action on the H4 established a shooting star candlestick pattern (bearish signal).
A H4 close south of 1.32 today, knowing we’re coming from daily resistance at 1.3225 (and H4 resistance at 1.3232), could motivate a bearish presence to target 1.31. Should 1.32 prove stubborn, nonetheless, H4 resistance at 1.3267 might make an appearance.
Areas of consideration:
With H4 action finishing the week beneath the 1.32 handle, enthusiastic breakout sellers might have already committed ahead of the close. Conservative sellers, on the other hand, are likely to wait and see where we open this week, likely eyeballing a 1.32 retest that establishes a H4 bearish candlestick signal.
As both weekly and daily timeframes exhibit scope to move as far south as 1.3059 (weekly timeframe), the 1.31 handle offers a logical (initial) downside target for H4 sellers under 1.32.
USD/CHF:
Weekly gain/loss: +0.59%
Weekly close: 0.9145
Weekly perspective:
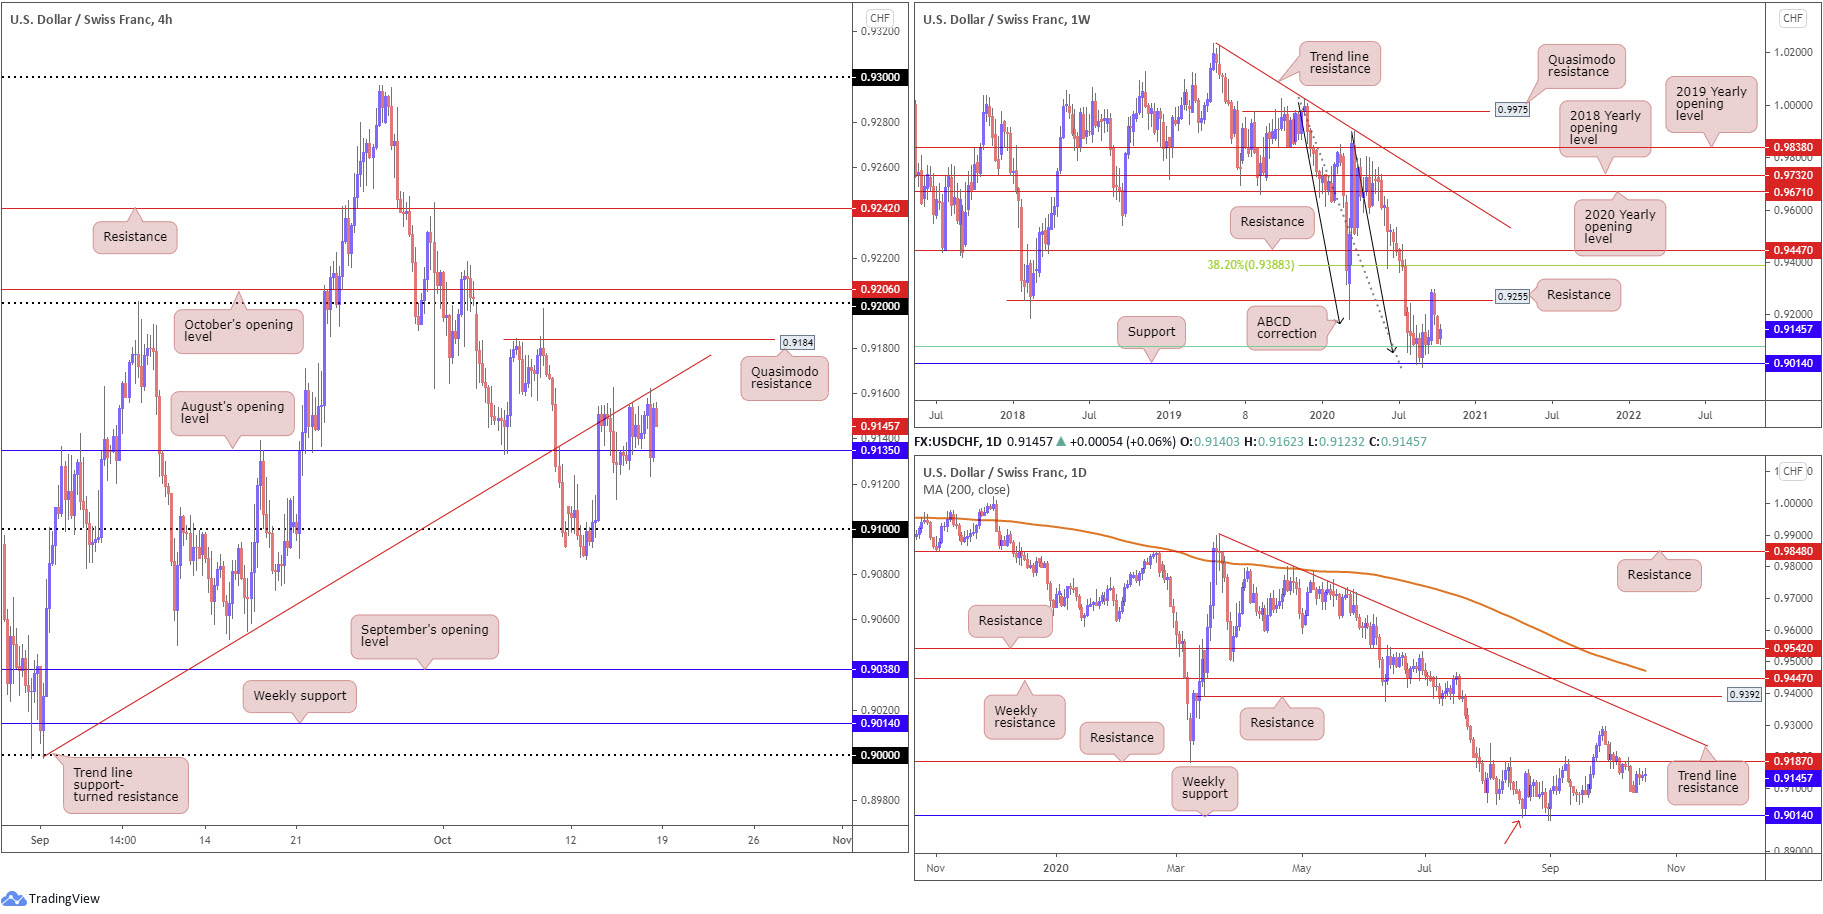
As noted in recent updates, the closing stages of September had price retest resistance at 0.9255 (a previous Quasimodo support level), movement, which as you can see, prompted two back-to-back near-full-bodied bearish candles early October. As a result, support at 0.9014, as well as ABCD support at 0.9051 (black arrows) and a long-term 61.8% Fibonacci retracement ratio at 0.9080 (green line – taken from 0.8300 [January 12 2015]), is turf that may be retested this week.
It is also worth noting USD/CHF has traded lower since topping in April 2019.
Daily perspective:
Mid-week onwards saw upside momentum decelerate 30 or so pips ahead of resistance from 0.9187. This is an impressive level, structurally speaking, having seen the base produce healthy support in March and resistance in August through September.
Conquering the said resistance this week shines the spotlight on trend line resistance, extended from the high 0.9901, whereas a rotation to the downside potentially throws weekly support mentioned above at 0.9014 into the mix. What’s interesting is weekly support on the daily chart also represents a Quasimodo support (red arrow – left shoulder).
H4 perspective:
Since Wednesday, buyers and sellers have been wrestling for position between trend line support-turned resistance, from the low 0.8998, and August’s opening value at 0.9135. To the upside, Quasimodo resistance at 0.9184 is in sight, followed by the 0.92 handle and October’s opening value at 0.9206, while space under 0.9135 shows room to target the 0.91 handle.
Areas of consideration:
October’s opening value at 0.9206 on the H4, the 0.92 handle and daily resistance at 0.9187 forms an area of resistance to be mindful of should we reach this far north this week.
The combination of the 61.8% Fibonacci retracement ratio at 0.9080 on the weekly timeframe and the 0.91 handle on the H4 could prove interesting support this week.
Beyond 0.9080, September’s opening value at 0.9038 and the weekly ABCD support at 0.9051 also forms tight (support) confluence.
Dow Jones Industrial Average:
Weekly gain/loss: -0.41%
Weekly close: 28550
Weekly perspective:
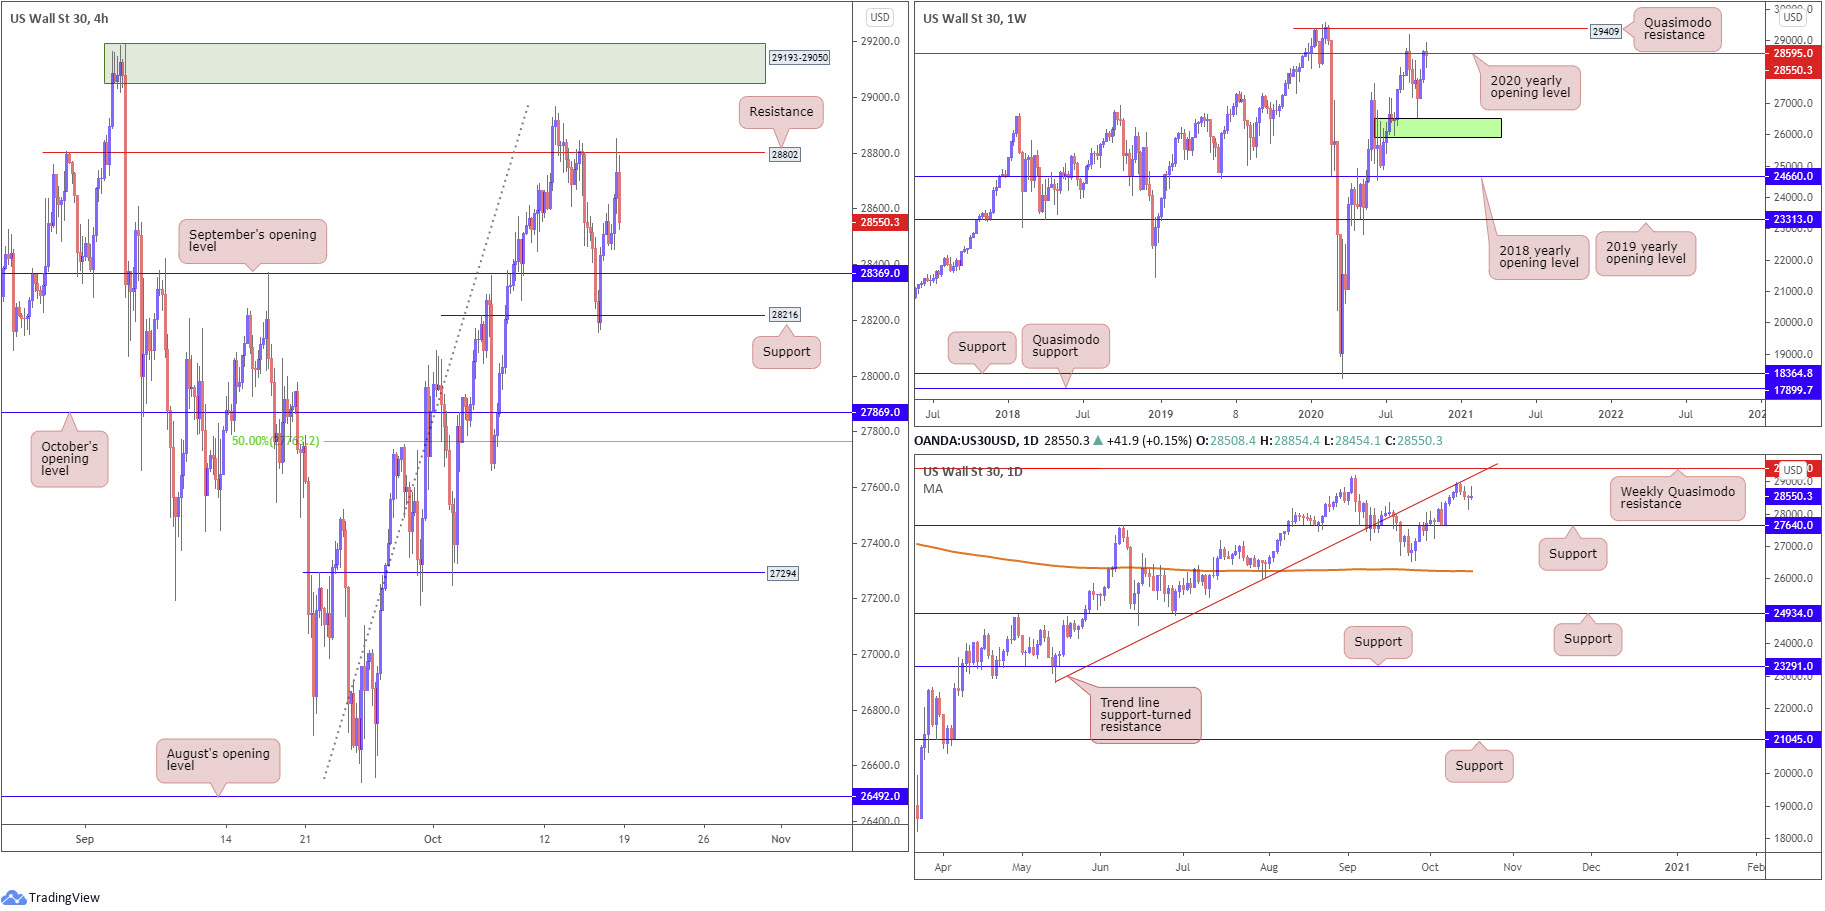
The animated spike to lows at 26541 on September 24, action that missed demand (green) at 25916-26523 by a hair, sparked heavy buying the following two weeks and landed longer-term flow back around the 2020 yearly opening value at 28595.
Last week offered a muted stance, ranging between 28976/28155 and establishing an indecision candle (though given we’re at resistance this may also be considered a reversal warning).
Quasimodo resistance at 29409 is seen as the next potential hurdle before we’re clear to attack all-time peaks at 29595 set in early February.
Daily perspective:
Traders, basing analysis off the daily timeframe, will note we weakened from trend line support-turned resistance, extended from the low 22803, at the beginning of the week.
Bearish eyeballs likely have support at 27640 pinned on the watchlist this week, while bullish players perhaps have the weekly Quasimodo resistance discussed above at 29409 in view.
With respect to daily candlestick analysis, Thursday generated a hammer candlestick pattern (bullish signal) and Friday replied with a shooting star formation (bearish signal).
H4 perspective:
The Dow Jones Industrial Average finished Friday snapping a three-day bearish phase, while the broader market concluded mostly lower. Friday saw the Dow add 112.11 points, or 0.39%, the S&P 500 ended flat while the Nasdaq traded lower by 42.31 points, or 0.36%.
The technical landscape on the H4 timeframe watched Thursday pencil in a strong comeback off support at 28216 (a prior Quasimodo resistance level). Momentum derived from the aforesaid level demolished September’s opening value at 28369 to cross swords with resistance at 28802 into the closing stages of Friday, which, as you can see, produced a sizeable bearish reaction.
Higher, traders may also acknowledge supply (green) around 29193-29050, while burrowing south of 28216 this week directs focus to October’s opening value at 27869.
Areas of consideration:
The weekly resistance level at 28595 (2020 yearly opening value) is positioned between H4 support at 28369 (September’s opening value) and H4 resistance at 28802.
Other considerations this week are as follows:
Daily support priced at 27640, positioned just under the 50.0% retracement ratio on the H4 at 27763 and nearby October’s opening value at 27869, delivers confluence some traders may find of use this week.
The weekly Quasimodo resistance at 29409 converging with daily trend line resistance (22803) offers interesting bearish confluence. Though selling from this zone could prove challenging, given the strong uptrend we’re in right now.
XAU/USD (GOLD):
Weekly gain/loss: -1.62%
Weekly close: $1,899
Weekly perspective:
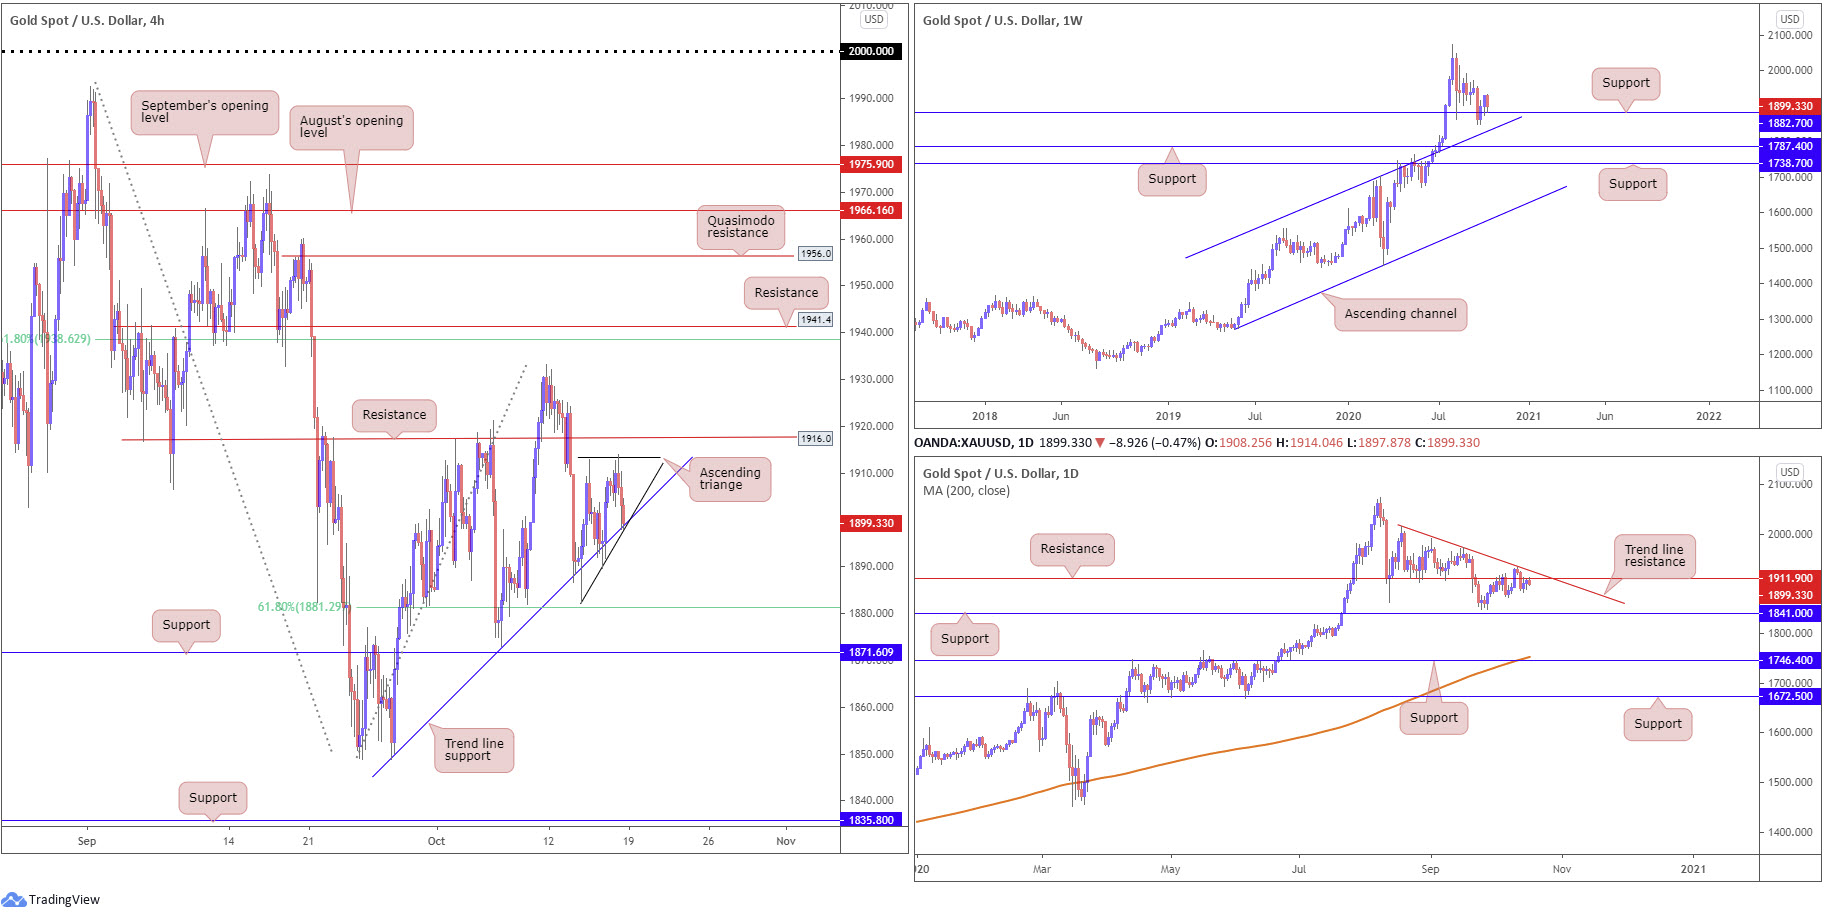
Despite an active push to lows at $1,848, a move that left nearby channel resistance-turned support, taken from the high $1,703, unchallenged, price swiftly reclaimed position above support at $1,882. While the trend (higher since 2016) favours a bullish scenario here, the lack of buying interest seen from mid-August implies a dip to the aforementioned channel support could develop this week.
Traders are also urged to pencil in supports at $1,787 and $1,738 in the event buyers fail to make an appearance.
Daily perspective:
The daily timeframe offers an interesting outlook.
Since we crossed into October, buyers and sellers have been squaring off around the underside of resistance at $1,911, a level fusing closely with a trend line resistance, taken from the high $2,015.
The above could imply further downside is on the table (additional selling from this area may take the precious metal as far south as support at $1,841). However, recent selling from the $1,911 region has so far been uninspiring, suggesting buyers might be looking to change gears this week and push higher from the weekly support level mentioned above at $1,882.
H4 perspective:
Mildly snapping a two-day bullish phase on Friday, price formed what appears to be an ascending triangle pattern ($1,882/$1,912) off trend line support, taken from the low $1,848 (and a nearby 61.8% Fibonacci retracement ratio at $1,881). Directly overhead, we also see clear resistance around $1,916, with a break uncovering the $1,933 October 11 peak, followed by H4 resistance at $1,941 and a 61.8% Fibonacci retracement ratio at $1,938.
Areas of consideration:
With the trend on gold higher since 2016, and daily action suggesting buyers could take out $1,911 (and trend line resistance), weekly buyers might make a stand off support at $1,882 this week.
Traders may interpret the above chart structure as a cue to begin pursuing bullish themes should we break through H4 resistance at $1,916.
The accuracy, completeness and timeliness of the information contained on this site cannot be guaranteed. IC Markets does not warranty, guarantee or make any representations, or assume any liability regarding financial results based on the use of the information in the site.
News, views, opinions, recommendations and other information obtained from sources outside of www.icmarkets.com.au, used in this site are believed to be reliable, but we cannot guarantee their accuracy or completeness. All such information is subject to change at any time without notice. IC Markets assumes no responsibility for the content of any linked site.
The fact that such links may exist does not indicate approval or endorsement of any material contained on any linked site. IC Markets is not liable for any harm caused by the transmission, through accessing the services or information on this site, of a computer virus, or other computer code or programming device that might be used to access, delete, damage, disable, disrupt or otherwise impede in any manner, the operation of the site or of any user’s software, hardware, data or property.