
Key risk events today:
Limited.
EUR/USD:
Weekly gain/loss: -0.97%
Weekly close: 1.1089
Weekly perspective:
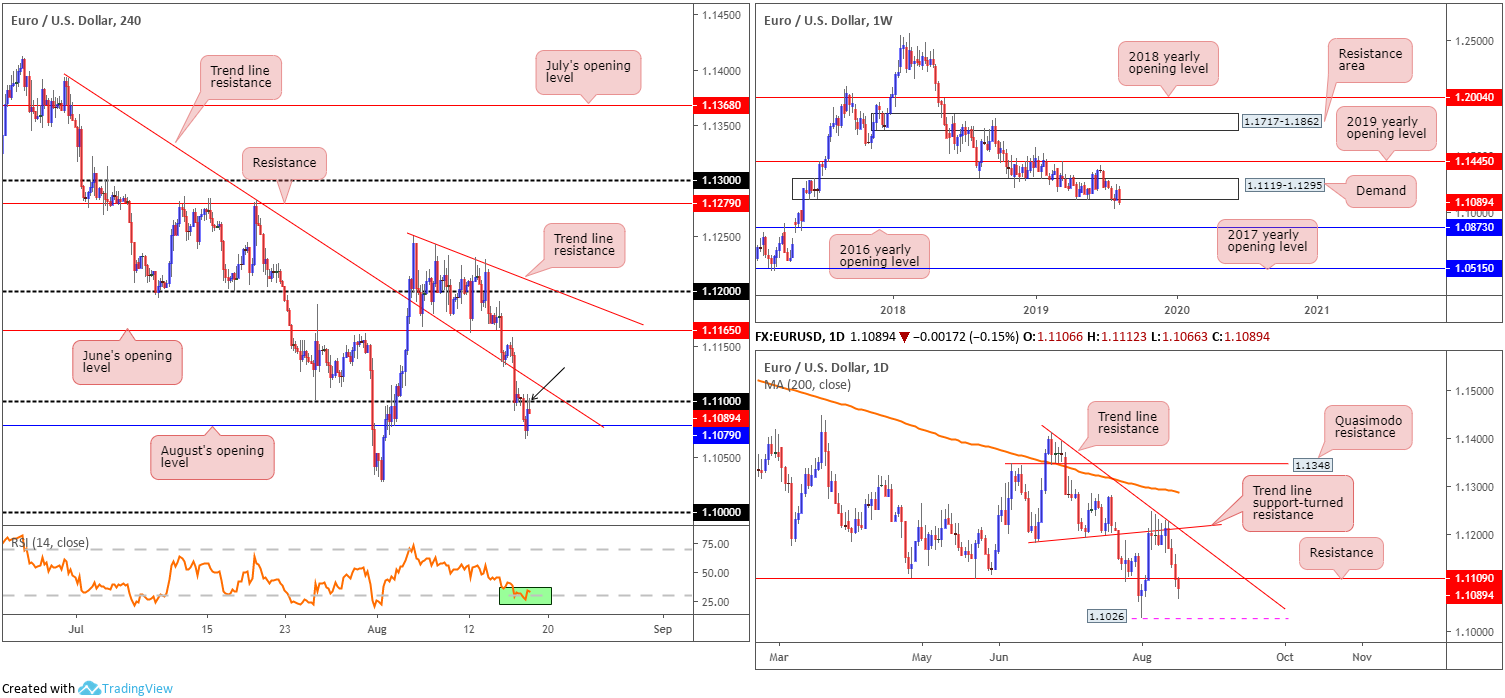
Long-standing demand at 1.1119-1.1295 remains in a fragile position, as sellers governed a large portion of the action last week and erased any attempts to salvage the said demand.
Continued selling could eventually witness the unit knock on the 2016 yearly opening level’s door at 1.0873, which housed strong historical significance as support/resistance since the beginning of 2016. In addition to this, traders may want to acknowledge the long-term trend remains facing a southerly bearing since topping in early 2018.
Daily perspective:
Early trade found thin air above a local trend line support-turned resistance (taken from the low 1.1181), as the euro concluded the week as the worst performing currency, selling off 4 out of the last 5 trading days against the US dollar.
In the shape of four reasonably dominant bearish closes, the market wrapped up the week sub support at 1.1109 (now acting resistance) and potentially set the stage for further selling this week towards 1.1026 (the 2019 low), followed by demand (not visible on the screen) at 1.0851-1.0950.
H4 perspective:
Europe’s single currency remained on the defensive Friday, settling 0.15% lower vs. the buck. The 1.11 handle gave way in the early hours of London, consequently clearing the pathway south to August’s opening level at 1.1079. While a mild recovery is in motion from 1.1079 (despite a visible breach of the level), upside attempts will likely be hampered by 1.11 now serving as resistance. Note Friday’s closing candle concluded by way of a shooting star formation (black arrow) off the underside of 1.11 (considered a bearish signal). It might also interest traders to note a trend line resistance (extended from the high 1.1392) is visible just north of 1.11.
Beyond 1.1079, traders’ crosshairs are likely fixed on the 1.1026 figure (highlighted above on the daily timeframe), closely followed by the key figure 1.10.
Areas of consideration:
The striking takeaway from the top-down analysis reveals the pair’s vulnerability. Weekly price appears poised to overthrow the last remaining buyers at demand drawn from 1.1119-1.1295, and support on the daily timeframe at 1.1109 was engulfed Friday. The nearest support structure on the higher timeframes can be found on the daily timeframe (according to our technical drawings) at 1.1026.
With the H4 candles closing in the form of a shooting star pattern at 1.11, a downside move from here is likely on the cards. This, alongside the higher-timeframe picture suggesting lower levels and a portion of sell stops likely filled beneath August’s opening level at 1.1079 (H4) Friday, a sell is an option with a protective stop-loss order positioned above the H4 trend line resistance plotted nearby. As for downside targets, the research team notes 1.1026 as a logical starting point, followed by 1.10. However, reducing risk to breakeven upon a H4 close below 1.1079 is also certainly something to consider.
GBP/USD:
Weekly gain/loss: +0.99%
Weekly close: 1.2141
Weekly perspective:
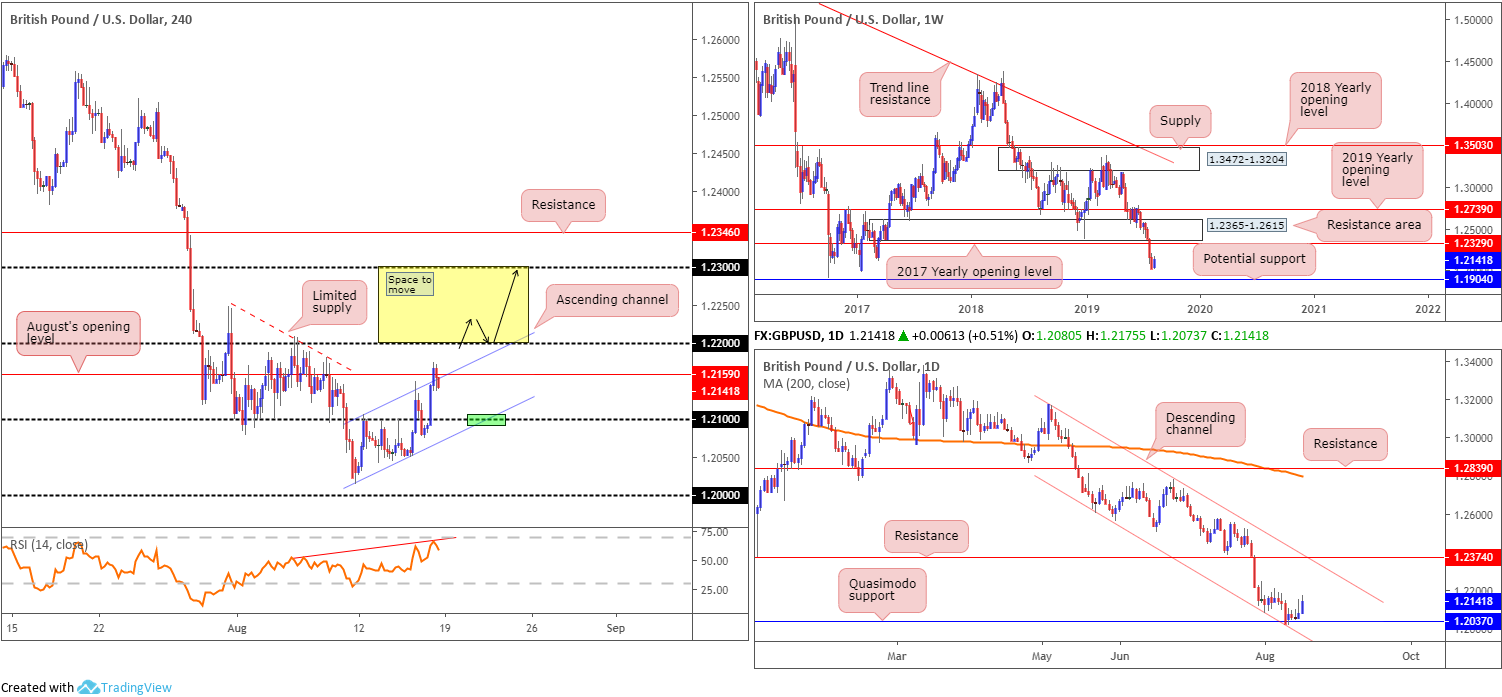
GBP/USD bulls went on the offensive last week, adding more than 115 points and snapping a four-week losing streak. For a currency that has been so beleaguered in recent months, this is a notable event. Further upside could have the unit shake hands with the 2017 yearly opening level at 1.2329 (resistance), set a couple of points south of a major resistance area at 1.2365-1.2615. Renewed selling interest, however, may lead to support entering the fold from 1.1904: a standout low clocked in early October 2016.
Daily perspective:
According to the daily timeframe, price found support off a Quasimodo formation coming in at 1.2037 in the early stages of last week. Another factor in favour of the pound was channel support merging with the said Quasimodo (pencilled in from the low 1.2605). Scope for additional upside this week is certainly plausible, with north of the page relatively free until reaching resistance at 1.2374, which happens to align with channel resistance (etched from the high 1.3176).
H4 perspective:
Sterling witnessed a sharp change in mood last week, fuelled by upbeat macroeconomic data. Hotter-than-expected UK retail sales helped boost morale Thursday, though most of GBP’s gains followed headlines that Labour Leader Corbyn stepped up his efforts to avoid a no-deal Brexit.
Technically speaking, August’s opening level at 1.2159, coupled with channel resistance taken from the high 1.2106, held the H4 candles lower into the close. The 1.21 handle maintains a strong position as the next viable support, serving well as support/resistance over the past couple of weeks. The research team also favours the point (green) channel support (extended from the low 1.2014) merges with the round number.
Above 1.2159, aside from 1.22 potentially offering resistance, limited supply is visible until 1.23. Therefore, a H4 close above 1.22 is certainly something to keep an eye out for.
Areas of consideration:
A H4 close above 1.22 delivers the opportunity to enter long this week, targeting 1.23 as the initial take-profit zone, closely followed by the 2017 yearly opening level on the weekly timeframe at 1.2329 and then H4 resistance at 1.2346. Depending on risk appetite, traders have the option of entering long on the breakout candle (with a protective stop-loss order positioned beneath the tail) or conservatively waiting for a possible retest motion to occur (black arrows) before pulling the trigger, preferably in the form of a H4 bullish candlestick signal (entry and risk can then be set according to this structure).
In the event we dip lower in early trade, nonetheless, the point 1.21/channel support merge on the H4 timeframe is also an area active buyers likely reside, with the first upside objective set at 1.2159. Owing to psychological numbers often falling victim to stop runs (fakeouts), though, traders are urged to consider waiting for additional candlestick confirmation before committing funds.
AUD/USD:
Weekly gain/loss: -0.15%
Weekly close: 0.6774
Weekly perspective:
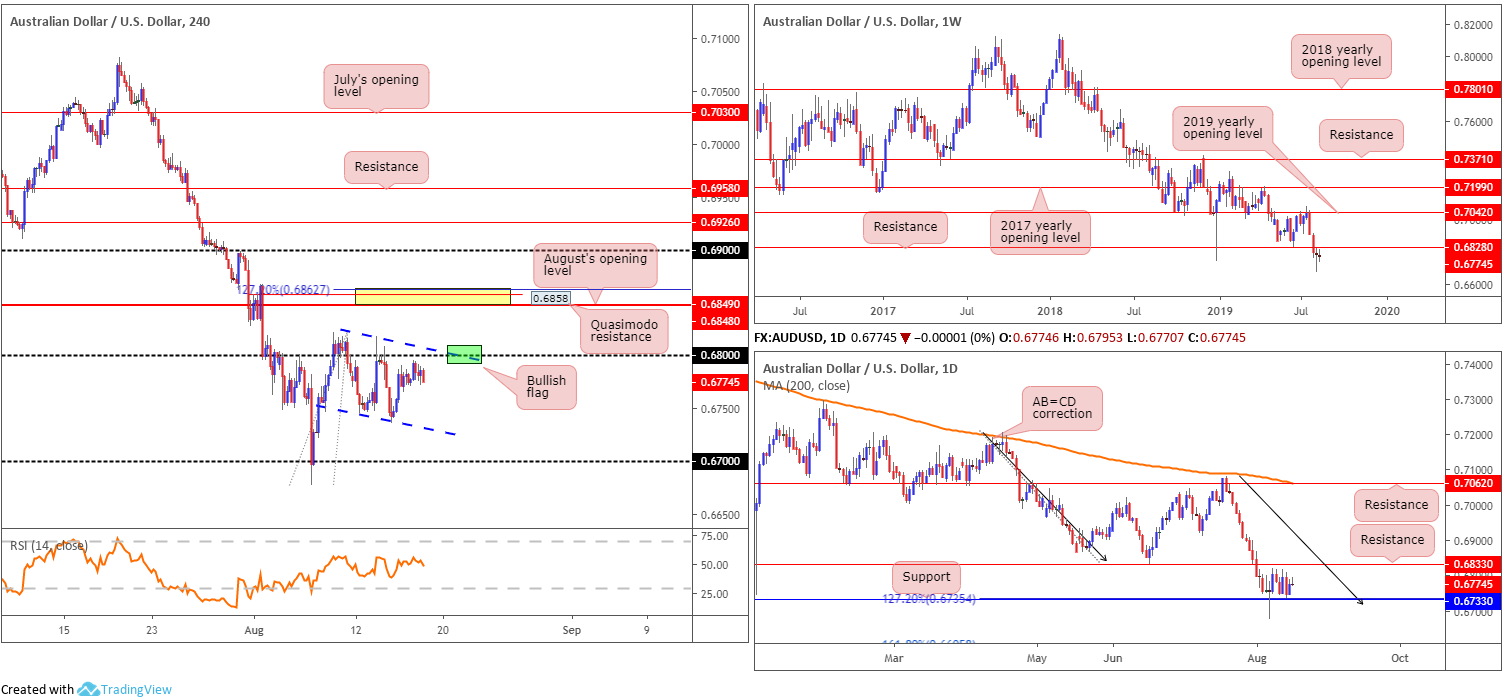
The end of July witnessed price slip beneath notable support at 0.6828, now a serving resistance. The following two weeks were colourless, however, organised as back-to-back indecision candles.
The long-term downtrend, intact since the beginning of 2018, remains unbroken, with further selling likely on the cards as the next support is not visible until 0.6395 on this timeframe (not seen on the screen).
Daily perspective:
Since elbowing beneath weekly support mentioned above at 0.6828, support at 0.6733 on the daily timeframe, along with a 127.2% AB=CD (black arrows) formation at 0.6735, entered the fray and held things higher. Despite this, the pair remains deeply in bearish territory and may not have the firepower to cross swords with resistance at 0.6833 (June 18 low).
H4 perspective:
Unable to sustain gains beyond 0.68 since August 9, the H4 candles have been compressing within a bullish flag formation (0.6817/0.6745). Flags typically slope in the opposite direction from the trend, though in this case, we do not have that but may still form part of a correction. Beyond 0.68, a tight area of resistance (yellow) resides between a 127.2% Fibonacci ext. point at 0.6862, a Quasimodo resistance at 0.6858 and August’s opening level at 0.6848.
In terms of data, the Australian dollar failed to exploit optimistic employment amid concerns over a prolonged US-China trade conflict. In addition to this, the US dollar index recovered strongly, settling 98.00+ into the close and consequently weighing on the commodity-linked currency.
Areas of consideration:
Although the target for the bullish flag configuration is likely to come in much higher, do not make the mistake of overlooking 0.6862/0.6848 this week. Further to this, though, between 0.68 and the aforesaid H4 resistance zone, traders must contend with not only daily resistance at 0.6833, but also weekly resistance at 0.6828.
On account of the above, the research team feel longs above the current H4 flag formation/0.68 are chancy. Excessive resistance from all three timeframes analysed will likely hamper any upside attempt. With this in mind, two sell zones are in view this week:
- The point the upper limit of the H4 channel flag merges with 0.68 may prompt a selloff (green). With higher-timeframe structure positioned nearby, which could promote a fakeout above 0.68, waiting for additional candlestick confirmation to form before entering a trade is recommended (entry and risk parameters can be set according to the selected candlestick formation).
- The yellow H4 area of resistance between 0.6827/0.6848. Granted, while this zone is a touch above higher timeframe-resistance, a fakeout above these levels to the said H4 zone is a strong possibility this week. Entry at 0.6848 is, therefore, valid, with a tight protective stop-loss order plotted above 0.6862, though if you prefer waiting for additional confirmation, a bearish candlestick pattern would suffice.
USD/JPY:
Weekly gain/loss: +0.62%
Weekly close: 106.33
Weekly perspective:
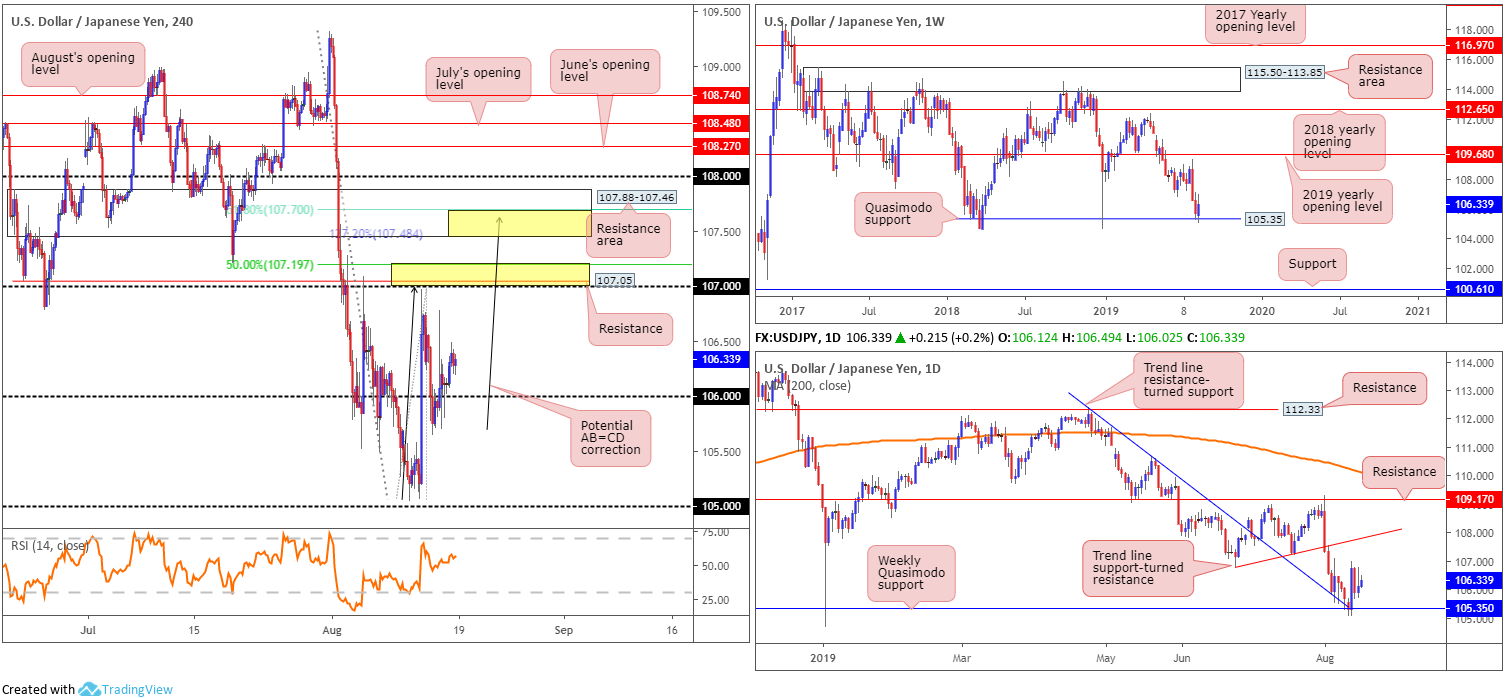
Quasimodo support at 105.35 – a level that already proved its worth by holding the unit higher at the beginning of the year – contained losses last week, encouraging a run higher that snapped a two-week losing streak. Outside of this base, limited support is evident until 100.61, whereas a push north has the 2019 yearly opening level at 109.68 to target.
Daily perspective:
In tandem with the weekly Quasimodo support highlighted above, daily trend line resistance-turned support (extended from the high 112.40) also entered the mix last week. The convergence of these two higher-timeframe levels witnessed a strong recovery play take shape Tuesday last week. This foundation supports further buying, according to the technical studies, at least until we reach trend line support-turned resistance (etched from the low 106.78).
H4 perspective:
Friday’s session saw the buck settle a shade higher against the Japanese yen, establishing a floor above 106. Overhead, resistance resides at 107.19/107, comprised of a 50.0% retracement value at 107.19, a resistance level at 107.05 and the round number 107 (lower yellow zone). Above here, we also have another area of resistance formed at 107.88-107.46, with specific emphasis on the 107.70/107.48 region (upper yellow zone), comprised of a 61.8% Fibonacci retracement value at 107.70 and an AB=CD (black arrows) 127.2% Fibonacci extension at 107.48.
Areas of consideration:
While the lower yellow H4 zone at 107.19/107 could contain price action this week, the research team feels the area holding the ‘juice’ in this market is 107.88-107.46, given it merges closely with the daily trend line support-turned resistance. A short from the upper yellow zone held within at 107.70/107.48, therefore, is an ideal location to seek shorting opportunities this week, should we press this high.
USD/CAD:
Weekly gain/loss: +0.36%
Weekly close: 1.3262
Weekly perspective:
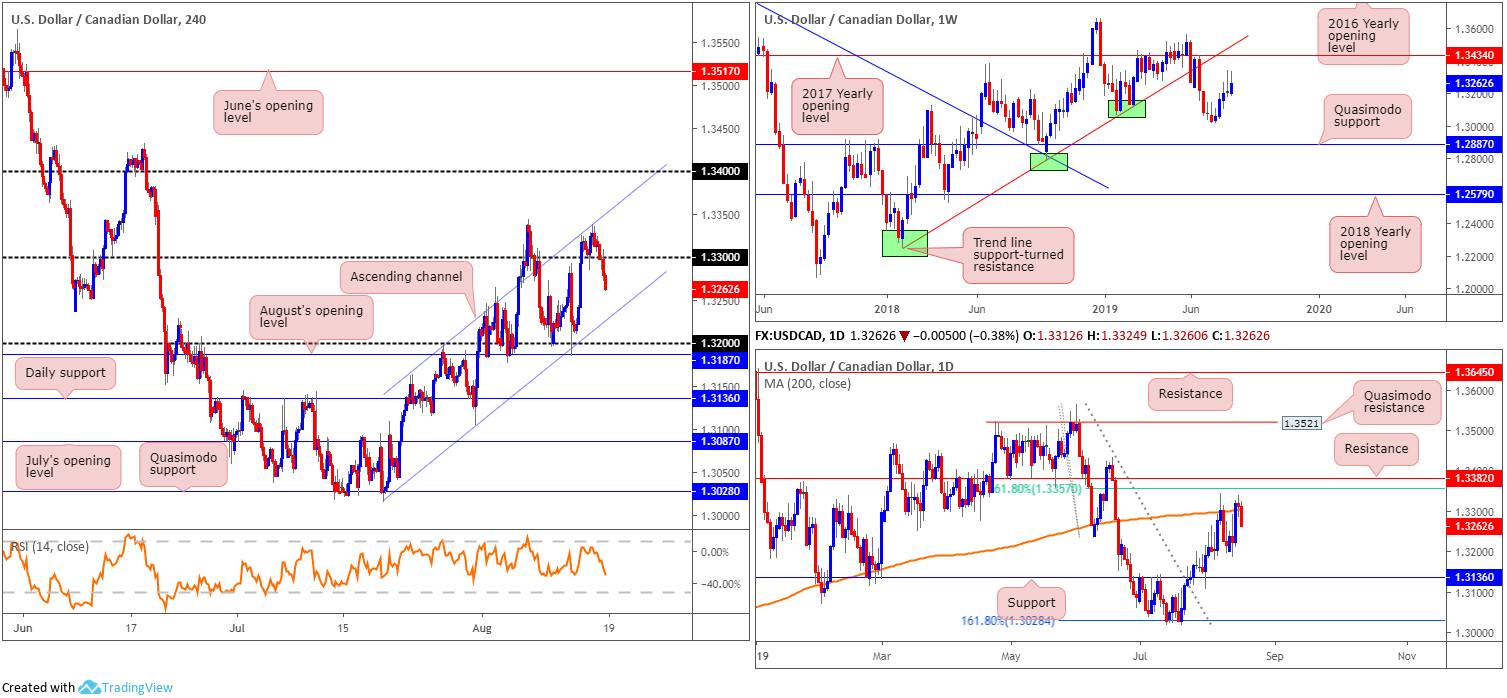
Since bottoming at 1.3018 in the form of an inverted hammer pattern, the USD/CAD has been steadily grinding higher. Last week’s movement, as evident from the chart, clocked highs of 1.3339, though failed to breakout of the prior week’s range.
Continued buying from this point has the 2017 yearly opening level at 1.3434 in sight, closely shadowed by trend line support-turned resistance etched from the low 1.2247. In the event we turn lower, however, traders’ crosshairs will likely be fixed on the 1.3016 July 15 low, followed by Quasimodo support at 1.2887.
Daily perspective:
A closer reading of price action on the daily timeframe reveals the 200-day SMA (currently circulating around 1.3300) remains in motion as resistance, capping upside Friday in the shape of a strong bearish candle. Areas to keep eyes on this week fall in at resistance drawn from 1.3382 and a closely converging 61.8% resistance at 1.3357. In terms of support, 1.3136 is in view as the next downside target.
H4 perspective:
Across the page on the H4 timeframe, the candles remain compressing within the limits of an ascending channel formation (1.3015/1.3199), with Friday selling off from its upper boundary and reclaiming 1.33 to the downside. This exposes channel support, which could hold ground, despite containing little higher-timeframe confluence. Below here, 1.32 resides as the next support, closely trailed by August’s opening level at 1.3187.
Areas of consideration:
Weekly price could swing either way this week, though additional upside is the more likely route. Contrary to this, daily activity is struggling to overthrow its 200-day SMA at 1.33 and may call for a run to support at 1.3136. Focus on the H4 timeframe has channel support in sight, with a break exposing 1.32.
Keep tabs on the H4 channel support and 1.32 handle this week for signs of buying. A long from here, although against daily structure, appears in-line with weekly flow and is, therefore, worthy of consideration. Conservative traders concerned by daily resistance, however, can simply wait and see if a H4 bullish candlestick signal develops before making a decision (entry/risk parameters can be set according to this structure).
USD/CHF:
Weekly gain/loss: +0.57%
Weekly close: 0.9779
Weekly perspective:
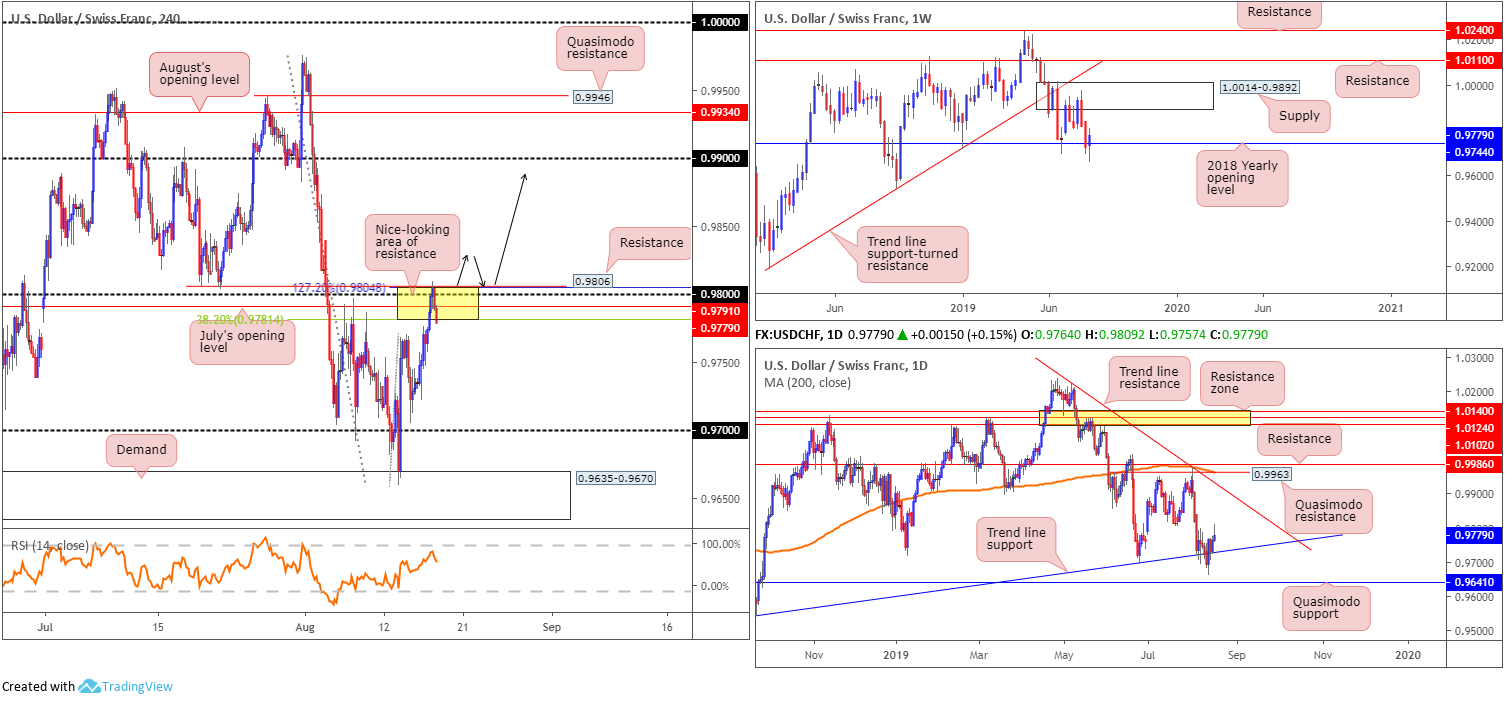
Despite clocking fresh YTD lows at 0.9659 last week, the US dollar salvaged a portion of lost ground vs. the Swiss franc and hurled the 2018 yearly opening level at 0.9744 back into the fight as support. Continued bidding from this angle has supply at 1.0014-0.9892 to contend with, whereas a push lower could introduce the 0.9542 September 17 low as support.
Daily perspective:
Trend line support pitched from the low 0.9542 maintained its position last week, undeterred by the test of YTD lows highlighted above at 0.9659 that came within close proximity of testing Quasimodo support at 0.9641. The next upside objective present on this scale can be found at trend line resistance taken from the high 1.0226, closely shadowed by another layer of resistance between 0.9986/0.6693 (comprised of resistance at 0.9986, the 200-day SMA [orange] and Quasimodo resistance at 0.9963).
H4 perspective:
A brief recap of Friday’s session on the H4 timeframe witnessed the USD/CHF strike highs of 0.9809, bolstered by broad-based USD bidding. Recent buying cast light on a particularly interesting area of resistance (yellow) between 0.9806/0.9781. Comprised of a Quasimodo support-turned resistance at 0.9806, a 127.2% Fibonacci ext. point at 0.9804, a round number 0.98, July’s opening level at 0.9791 and a 38.2% Fibonacci ratio at 0.9781, this area boasts a healthy chance of holding price action lower today/this week, targeting a possible run back to 0.97.
While the H4 resistance area at 0.9806/0.9781 encompasses appealing confluence, selling this area faces directional limitation on the higher timeframes. Both weekly and daily timeframes exhibit scope to explore higher ground this week, targeting weekly supply at 1.0014-0.9892 which fuses closely with daily trend line resistance (etched from the high 1.0226).
Areas of consideration:
Selling 0.9806/0.9781 on the H4 timeframe remains a possibility today, despite lacking higher-timeframe involvement. A sell at current price, with a protective stop-loss order positioned above Friday’s high 0.9809, has an initial take-profit target set at around 0.9734, around the daily trend line support mentioned above, followed closely by the 0.97 handle on the H4 timeframe.
Should we push above 0.9806/0.9781, as the higher-timeframes suggest, entering long is an option (either on the back of the breakout candle or on a retest play [black arrows]) with an initial upside target set at 0.9892 (the underside of weekly supply), followed by the 0.99 handle on the H4 timeframe.
Dow Jones Industrial Average:
Weekly gain/loss: -1.45%
Weekly close: 25909
Weekly perspective:
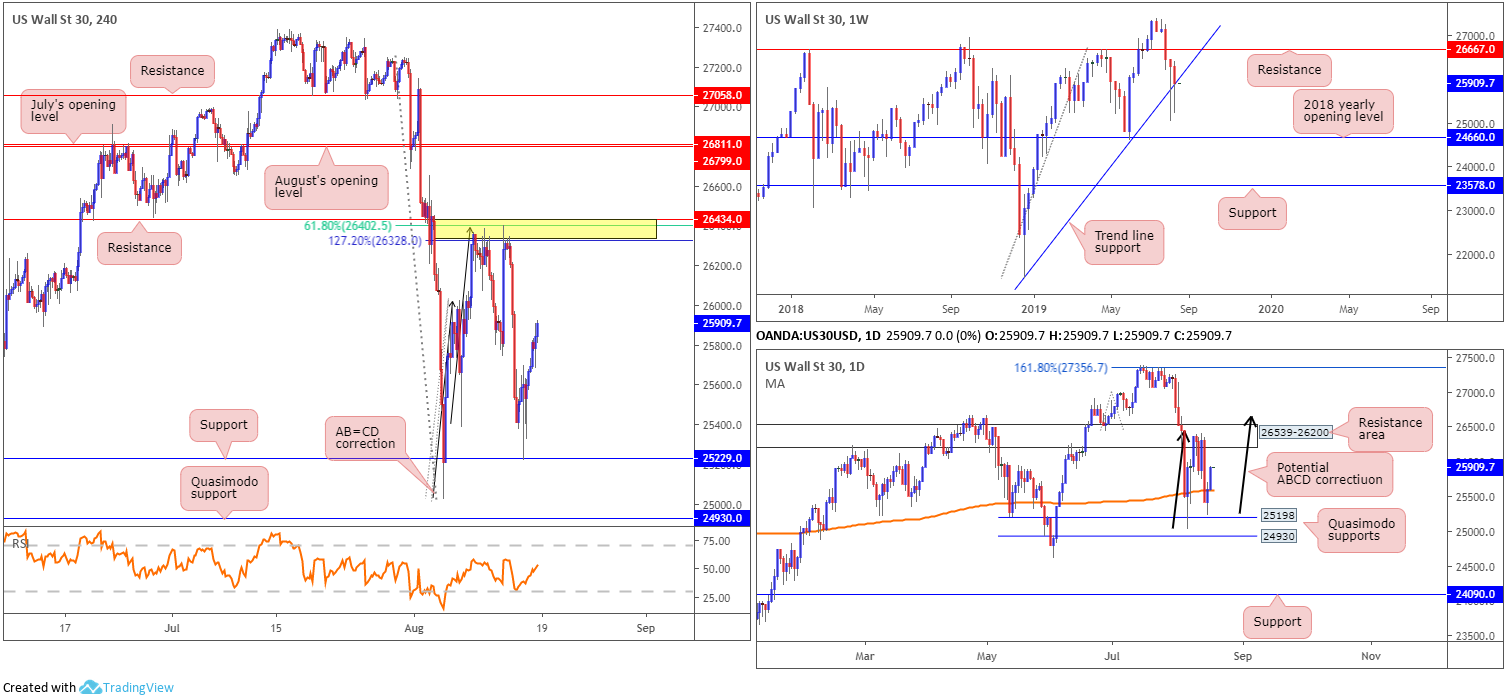
The Dow Jones Industrial Average wrapped up the week in negative territory, down more than 380 points and extended losses for a third straight week. Interestingly, though, long-term trend line support (pencilled in from the low 21452) remains intact. A move higher from here has resistance at 26667 in view, whereas a break southbound could sink to depths not visited since early June 2019 at the 2018 yearly opening level drawn from 24660.
Daily perspective:
Price action on the daily timeframe is currently bounded by a Quasimodo support coming in at 25198 and a resistance area forged at 26539-26200. What’s notable from a technical perspective is the said resistance zone is sited just south of weekly resistance underlined above at 26667, which happens to fuse closely with a daily ABCD correction (black arrows).
H4 perspective:
US equities bounced back from Wednesday’s 800-point selloff, having been rattled since Monday by growing US/China trade animosity and simmering geopolitical tensions, with two consecutive sessions of gains. The Dow Jones Industrial Average added 306.62 points, or 1.20%; the S&P 500 also added 41.08 points, or 1.44% and the Nasdaq advanced 119.22 points, or 1.59%.
For those who read previous reports you may recall the research team highlighted a potential sell at a resistance zone (yellow) coming from 26434/26328. Between resistance at 26434, a 127.2% AB=CD (black arrows) correction point at 26328 and a 61.8% Fibonacci retracement value at 26402, this zone held price action lower at the beginning of the week and on Wednesday. The reports also stated a converging daily resistance area entered the mix at 26539-26200. Well done to any of our readers who managed to sell 26434/26328 and hold until H4 support at 25229. The risk/reward was sensational!
Areas of consideration:
Longer term, traders are urged to keep tabs on weekly resistance at 26667 this week for a possible short entry, owing to it converging closely with a daily ABCD correction. Given this is a countertrend trade, however, reducing risk to breakeven following a weekly close beneath the current weekly trend line support is recommended.
Medium term (H4), we’re currently trading in no man’s land between the resistance zone (yellow) at 26434/26328 and support at 25229. As such, keep eyes on these barriers also this week for signs of rejection/weakening.
XAU/USD (GOLD):
Weekly gain/loss: +1.07%
Weekly close: 1513.2
Weekly perspective:
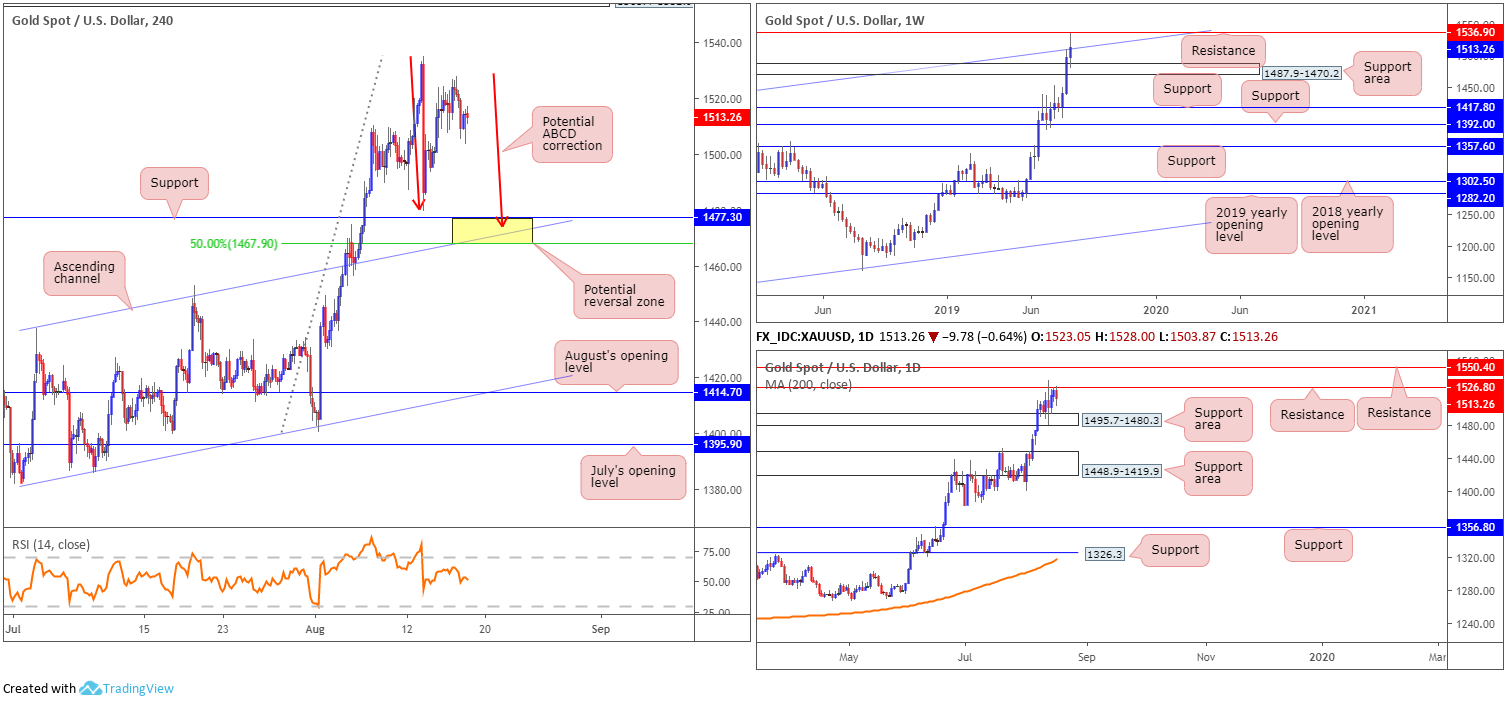
Bullion retained a strong bullish tone in recent trade, adding more than $16 in value and clocking a multi-year high of 1535.0. Technicians may also want to acknowledge the yellow metal used the support area at 1487.9-1470.2 as a foothold and came within striking distance of connecting with long-term resistance at 1536.9, though closed the week out marginally above channel resistance (taken from the high 1375.1).
Daily perspective:
Long-term support-turned resistance at 1526.8 made an appearance last week, and held ground into the close, despite coming from a support area notched up at 1495.7-1480.3 (glued to the top edge of the weekly support area mentioned above at 1487.9-1470.2). In the event further buying materialises, resistance at 1550.4 is next in the firing range.
H4 perspective:
Thursday/Friday entered a somewhat subdued phase last week, likely weighed on by healthy USD bidding. With respect to structure on the H4 scale this week, the research team notes 1467.9/1477.3 may be worthy of consideration (yellow).
Comprised of a potential ABCD correction at 1473.8 (red arrows), a channel resistance-turned support extended from the high 1437.7 and a 50.0% retracement ratio at 1467.9, 1467.9/1477.3 stands a good chance of holding price action higher if tested. In addition, it might also be worth noting the H4 support area is sited around the lower edge of the weekly support area at 1487.9-1470.2, though is positioned outside of the borders of the daily support area at 1495.7-1480.3.
Areas of consideration:
Entry at 1477.3 is an option, with a protective stop-loss order placed at 1465.2. Traders wanting to add a little more confirmation may opt to wait and see if H4 price chalks up a candlestick signal before committing funds to the market. That way, buyer intent is visible, as well as having a base (the candlestick structure) to set entry and risk levels.
Above recent tops, fresh supply drawn from April 2013 at 1568.4-1552.9 is also worth pencilling in, although not visible on the screen as of current price.
The accuracy, completeness and timeliness of the information contained on this site cannot be guaranteed. IC Markets does not warranty, guarantee or make any representations, or assume any liability regarding financial results based on the use of the information in the site.
News, views, opinions, recommendations and other information obtained from sources outside of www.icmarkets.com.au, used in this site are believed to be reliable, but we cannot guarantee their accuracy or completeness. All such information is subject to change at any time without notice. IC Markets assumes no responsibility for the content of any linked site.
The fact that such links may exist does not indicate approval or endorsement of any material contained on any linked site. IC Markets is not liable for any harm caused by the transmission, through accessing the services or information on this site, of a computer virus, or other computer code or programming device that might be used to access, delete, damage, disable, disrupt or otherwise impede in any manner, the operation of the site or of any user’s software, hardware, data or property.


