
EUR/USD:
Weekly gain/loss: -1.15%
Weekly close: 1.1231
Weekly perspective:
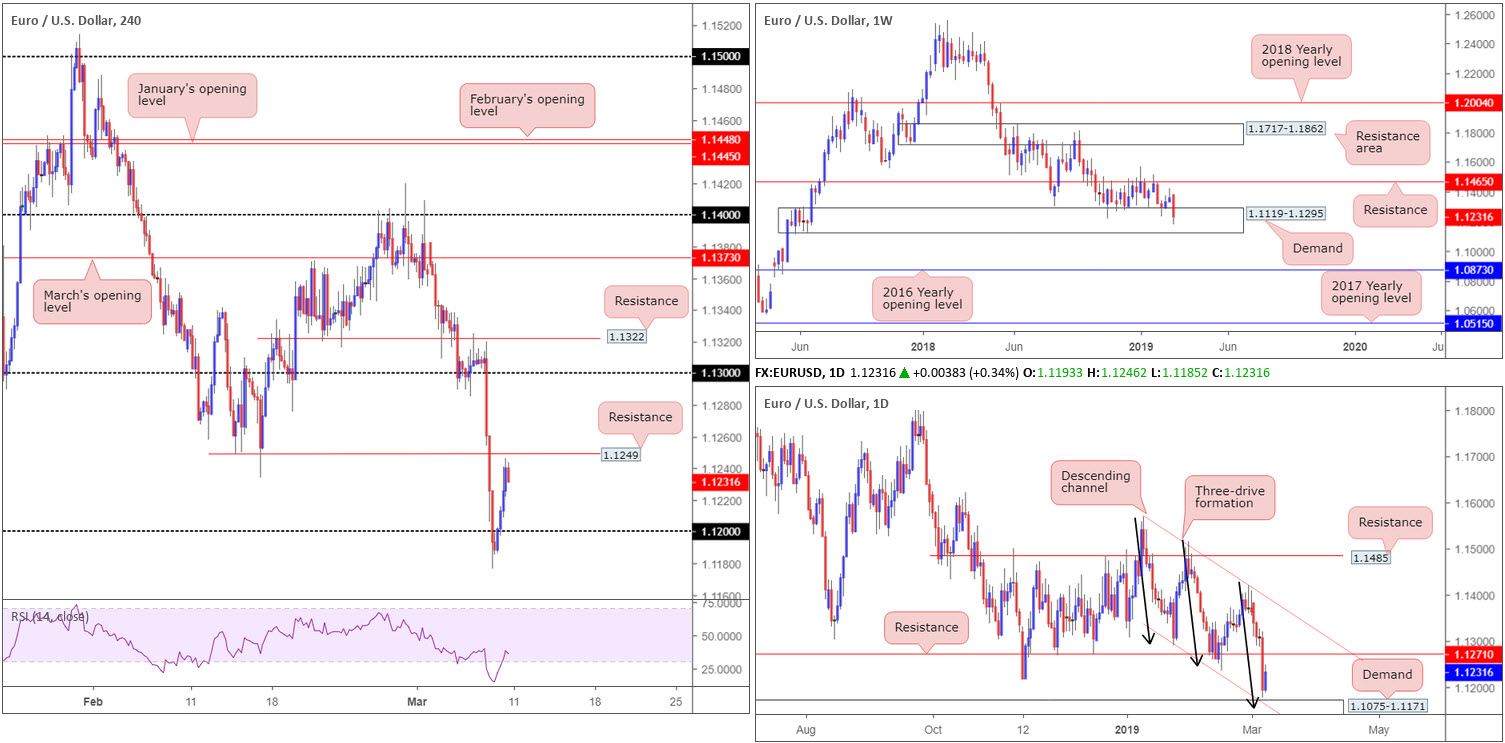
Heading into the week’s close, the single currency shed more than 1.00% vs. its US counterpart. This, as is evident from the weekly timeframe, forced price action deep into demand plotted at 1.1119-1.1295.
Overall, the trend continues to face a southerly direction on this timeframe, with the possibility of a subsequent lower low forming in the future. The next area of interest beyond the current demand falls in around the 2016 yearly opening level priced in at 1.0873.
Daily perspective:
In conjunction with the current weekly demand area, the daily timeframe also has demand nearby at 1.1075-1.1171, merging closely with channel support (extended from the low 1.1289) and a bullish three-drive formation (black arrows) at 1.1151 (taken from the high 1.1569).
Price action turned north just ahead of the aforementioned demand area Friday, and on course to shake hands with neighbouring resistance coming in at 1.1271.
H4 perspective:
Total non-farm payroll employment was little changed in February (+20,000 – the fewest in more than a year), after increasing by 311,000 in January, the US Bureau of Labour Statistics reported Friday. The US unemployment rate also declined to 3.8%, beating expectations of 3.9%, and US average hourly earnings ticked higher at 0.4% vs. expected 0.3%.
The release weighed on an already waning greenback, simultaneously lifting the euro higher. Earlier in the day, following a stop run sub 1.12 late Thursday, the H4 candles reclaimed 1.12+ status and concluded the day mildly paring losses just south of resistance at 1.1249 (a Quasimodo support-turned resistance level). The ignored Quasimodo levels tend to produce a response, though in cases where higher-timeframe levels lurk close by, as is the case here with daily resistance mentioned above at 1.1271, a fakeout above the level is possible.
Areas of consideration:
Although weekly price trades within demand at 1.1119-1.1295, a response is likely to be seen from 1.1271/1.1249 today/early week (a 22-pip range comprised of noted H4 and daily resistance levels), targeting the 1.12 handle as initial downside support.
Traders interested in shorts from 1.1271/1.1249 have two options: either enter on a limit sell order with a stop-loss order tucked a couple of points above the zone, or let price come into the area and enter on additional confirming price action. This could be as simple as a H4 bearish candlestick signal (entry/stop parameters can be based on the pattern’s structure).
Today’s data points: US Core Retail Sales m/m; US Retail Sales m/m.
GBP/USD:
Weekly gain/loss: -1.45%
Weekly close: 1.3012
Weekly perspective:
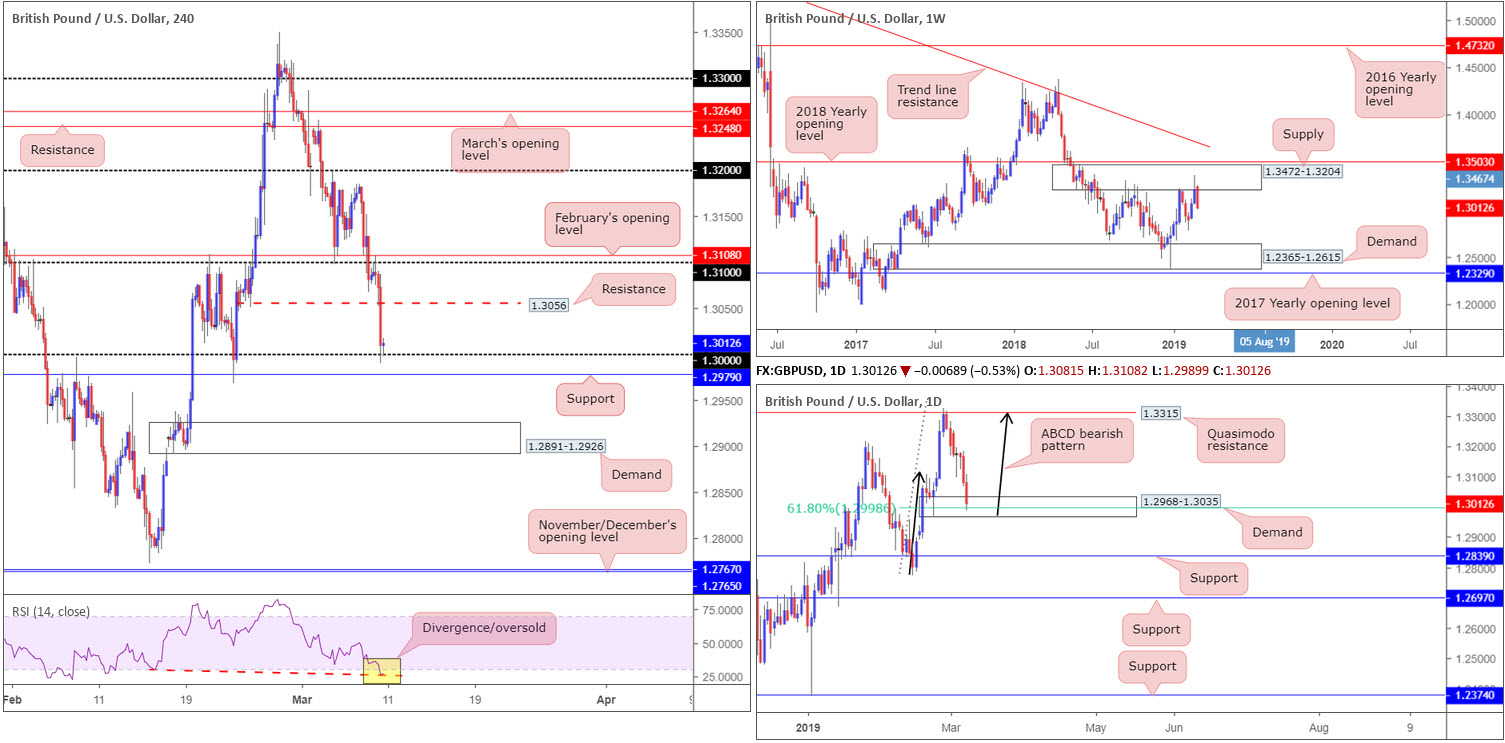
Shattering a two-week bullish phase, the British pound ceded ground to its US peer last week as substantial selling emerged from supply at 1.3472-1.3204. Eroding all prior week gains and ending the session down nearly 200 points, the next area of support on this timeframe this week can be seen around the 1.2772 Feb 11 weekly low, closely shadowed by a demand area at 1.2365-1.2615.
Daily perspective:
A closer assessment of the daily timeframe has price action crossing swords with demand at 1.2968-1.3035, which happens to hold a 61.8% Fibonacci value within at 1.2998 – considered the second take-profit target off the ABCD bearish pattern (black arrows)/Quasimodo resistance at 1.3315. In view of this, traders are urged to prepare for the prospect of an upside attempt developing today/early week. Continued selling, on the other hand, has support fixed at 1.2839 in sight.
H4 perspective:
Cable plumbed new depths for the week, testing familiar support at key figure 1.30. Despite the US dollar exploring lower ground following the latest round of US employment figures, Brexit headlines weighed on the British pound.
What gives 1.30 extra credibility as support, aside from the fact it is a widely watched number in this market, is its relationship with the daily timeframe (trading within demand), and H4 action pinning additional support nearby at 1.2979 along with the RSI indicator displaying a divergence/oversold reading. In the event we do pull lower this week, though, as suggested by the weekly timeframe, it might be worth pencilling in H4 demand at 1.2891-1.2926.
Areas of consideration:
Although weekly sellers respond from supply at 1.3472-1.3204, a correction higher could be on the cards today/early week. The combination of the key round number 1.30 on the H4 and daily demand is, according to our technical studies, sufficient enough to entice buyers into the fold – those looking to liquidate last week’s shorts and those interested in buying this pair on the back of current structure.
For traders confident in a bounce emerging from the current daily demand this week may consider entering long at the open, with stop-loss orders positioned beneath 1.2968: the lower edge of daily demand, consequently offering a 1:1 ratio (risk/reward) to H4 resistance at 1.3056: the next upside target.
For traders concerned about the weekly timeframe’s position, the alternative is to wait for additional price action confirmation to form before pulling the trigger.
Today’s data points: MPC Member Haskel Speaks; US Core Retail Sales m/m; US Retail Sales m/m.
AUD/USD:
Weekly gain/loss: -0.47%
Weekly close: 0.7043
Weekly perspective:
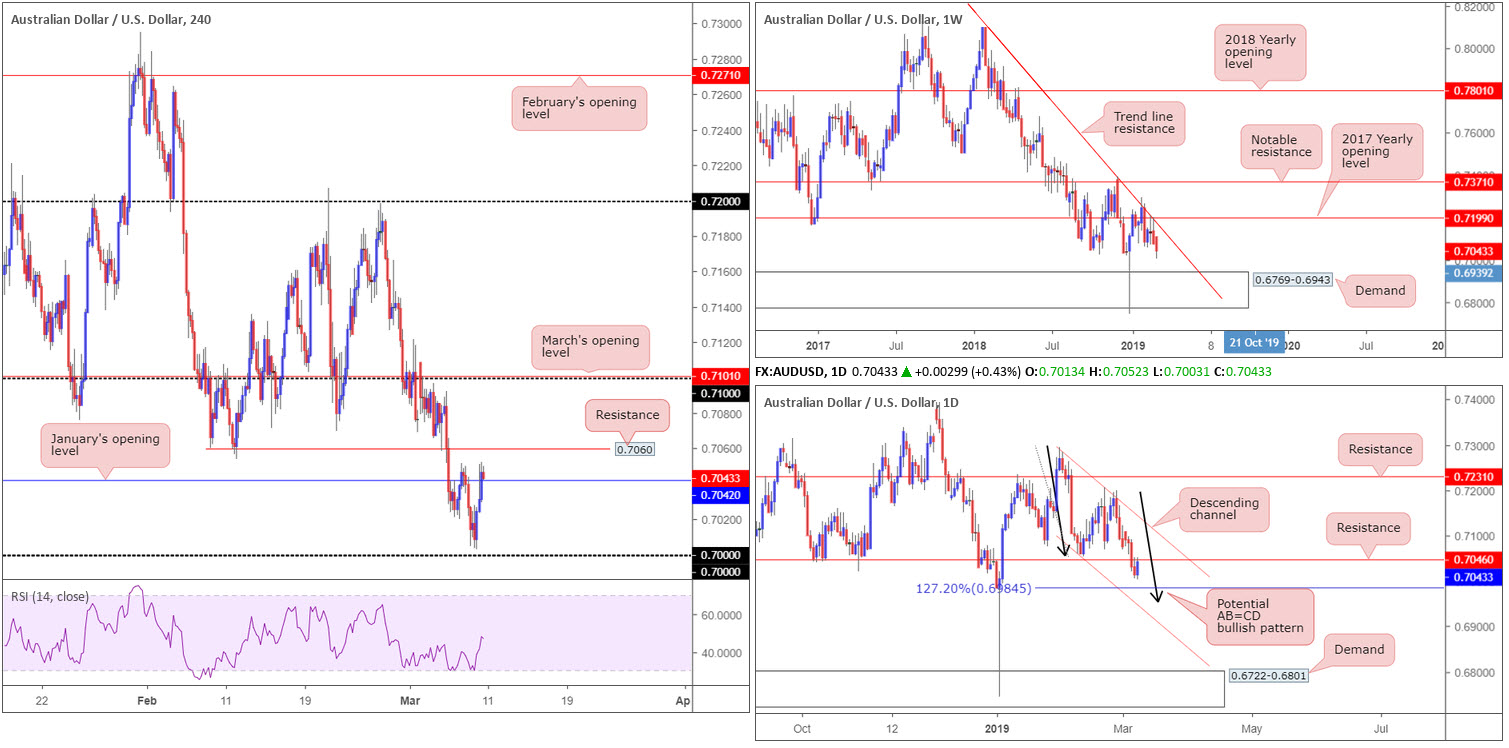
Following a reasonably strong response from the underside of the 2017 yearly opening level at 0.7199 (and merging trend line resistance [taken from the 2018 yearly high of 0.8135]) the week prior, last week’s flows extended the pair’s downside presence. Focus on this timeframe has, therefore, shifted to large demand coming in at 0.6769-0.6943.
Daily perspective:
Daily action remains compressing within a descending channel (0.7295/0.7060) and has an AB=CD (black arrows) 127.2% bullish completion point at 0.6984 in view as its next downside base.
Friday’s advance, however, in the shape of a near-full-bodied bullish candle, nudged price action into the underside of resistance at 0.7046. As a result, in order for the aforesaid AB=CD pattern to complete, the current resistance barrier really has to hold.
H4 perspective:
Leaving the key figure 0.70 unopposed Friday, the Australian dollar rose higher and wrapped up the week closing north of January’s opening level at 0.7042. The US dollar dipped its toes into negative territory, weighed on by disappointing non-farm payrolls (20k vs. 180k expected).
With daily resistance recently entering the battle ground Friday at 0.7046 and weekly action portending further selling, entering long on the back of H4 closing above January’s opening level is chancy. In fact, it’s hard to imagine the H4 candles overthrowing nearby resistance at 0.7060 (this is a Quasimodo support-turned resistance level).
Areas of consideration:
Although impossible to rule out fresh upside attempts at the current daily resistance, shorts from the H4 resistance mentioned above at 0.7060 is of interest. The combination of this level representing an ignored Quasimodo support (high-probability trading levels) and higher timeframes suggesting lower levels, a test of 0.7060 followed by a H4 close below 0.7042 is possibly in store.
A H4 close beneath 0.7042 after tagging in sellers from 0.7060 is a high-probability sell signal (stops can be positioned above the candle’s wick), according to our readings, targeting the 0.70 round number.
With the key figure 0.70 being a widely watched barrier, and having noted a daily 127.2% Fibonacci ext. point fixed 15 pips beneath the level at 0.6984, a correction out of this range is also a possible play to keep eyeballs on this week. To avoid being whipsawed out of a trade from 0.70 (fakeouts are common viewing around psychological levels), traders are urged to consider waiting for additional forms of confirmation before pulling the trigger. This could be anything from a H4 bullish candlestick signal (entry/risk can be defined according to this structure), to drilling down to the lower timeframes and trading a resistance-turned support setup.
Today’s data points: US Core Retail Sales m/m; US Retail Sales m/m.
USD/JPY:
Weekly gain/loss: -0.66%
Weekly close: 111.15
Weekly perspective:
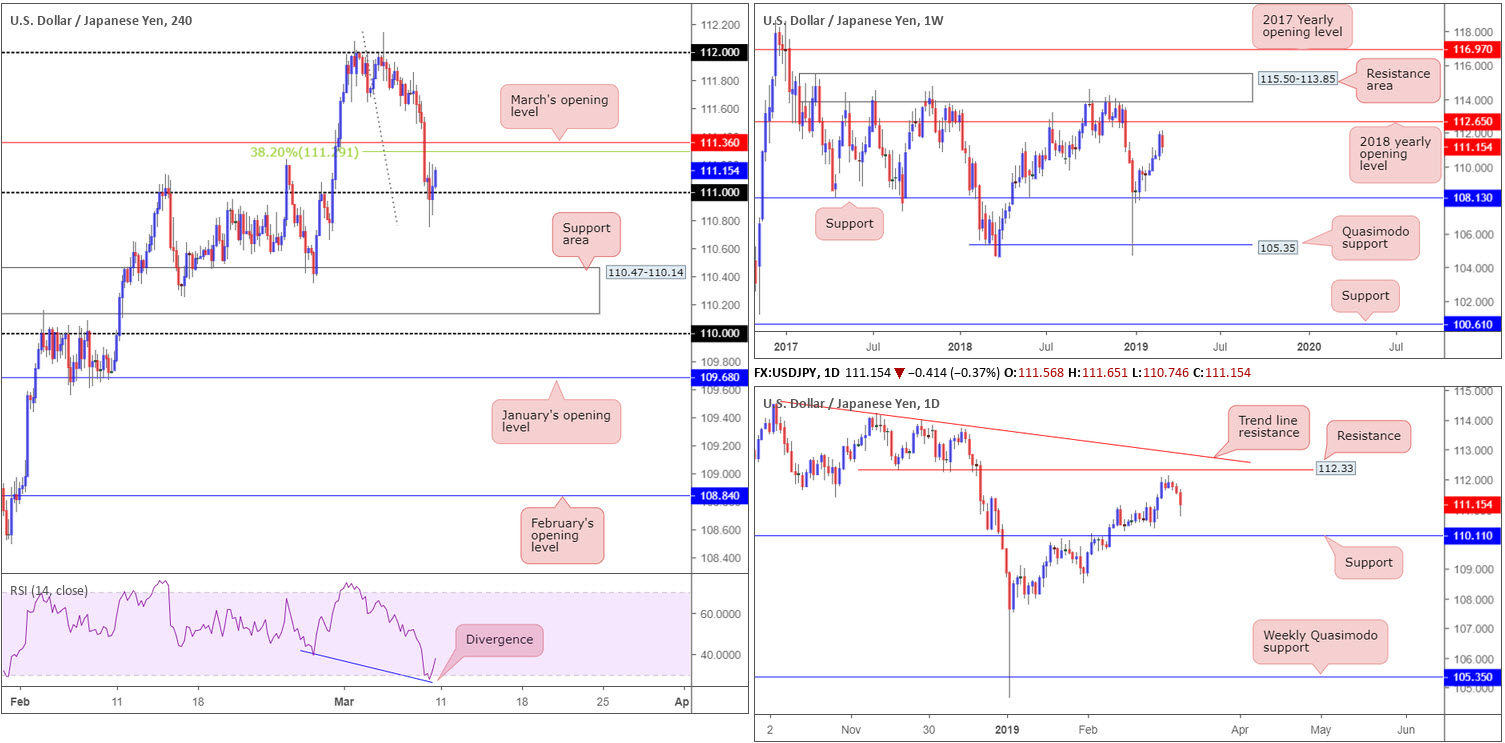
USD/JPY bulls lost interest last week, consequently fading fresh 2019 highs of 112.13 and breaking a four-week bullish run. In terms of structure, pivotal resistance at 112.65 (the 2018 yearly opening level) is seen on the weekly timeframe, demonstrating this market still has room to advance this week despite recent selling.
Daily perspective:
Since bottoming at 104.65 at the beginning of the year, the daily candles have printed a series of higher highs and higher lows. Friday’s selling is, therefore, likely to find support early week and continue higher, drawing in resistance plotted at 112.33, followed by trend line resistance extended from the high 114.23.
H4 perspective:
A quick recap of Friday’s session on the H4 timeframe reveals the pair erased nearly 40 pips in a matter of minutes following disappointing non-farm payrolls out of the US. In spite of this, the candles reclaimed 111+ status and closed the week by way of a reasonably strong bullish candle. It might also be of interest to some traders to note the RSI indicator is displaying a nice-looking divergence reading (blue line).
To the upside today, traders are likely honed in on March’s opening level at 111.36 and merging 38.2% Fibonacci resistance at 111.29. A break of these barriers, and we’re likely headed for another test of 112.
Areas of consideration:
According to the higher timeframes, the pendulum appears to be swinging towards more of an advance this week, with daily resistance at 112.33 in place as the first upside objective.
Unfortunately, a long on the H4, even with Friday’s candle closing strongly, is difficult given March’s opening level at 111.36. The alternative is to wait and see if the H4 candles have enough clout to conquer 111.36. In the event a H4 close above this level is seen, longs, either on the breakout candle or on a retest (preferably in the shape of a H4 bullish candle as this provides traders clear entry and risk levels to work with), are an option, targeting 112 as the initial take-profit zone.
Today’s data points: US Core Retail Sales m/m; US Retail Sales m/m.
USD/CAD:
Weekly gain/loss: +0.90%
Weekly close: 1.3415
Weekly perspective:
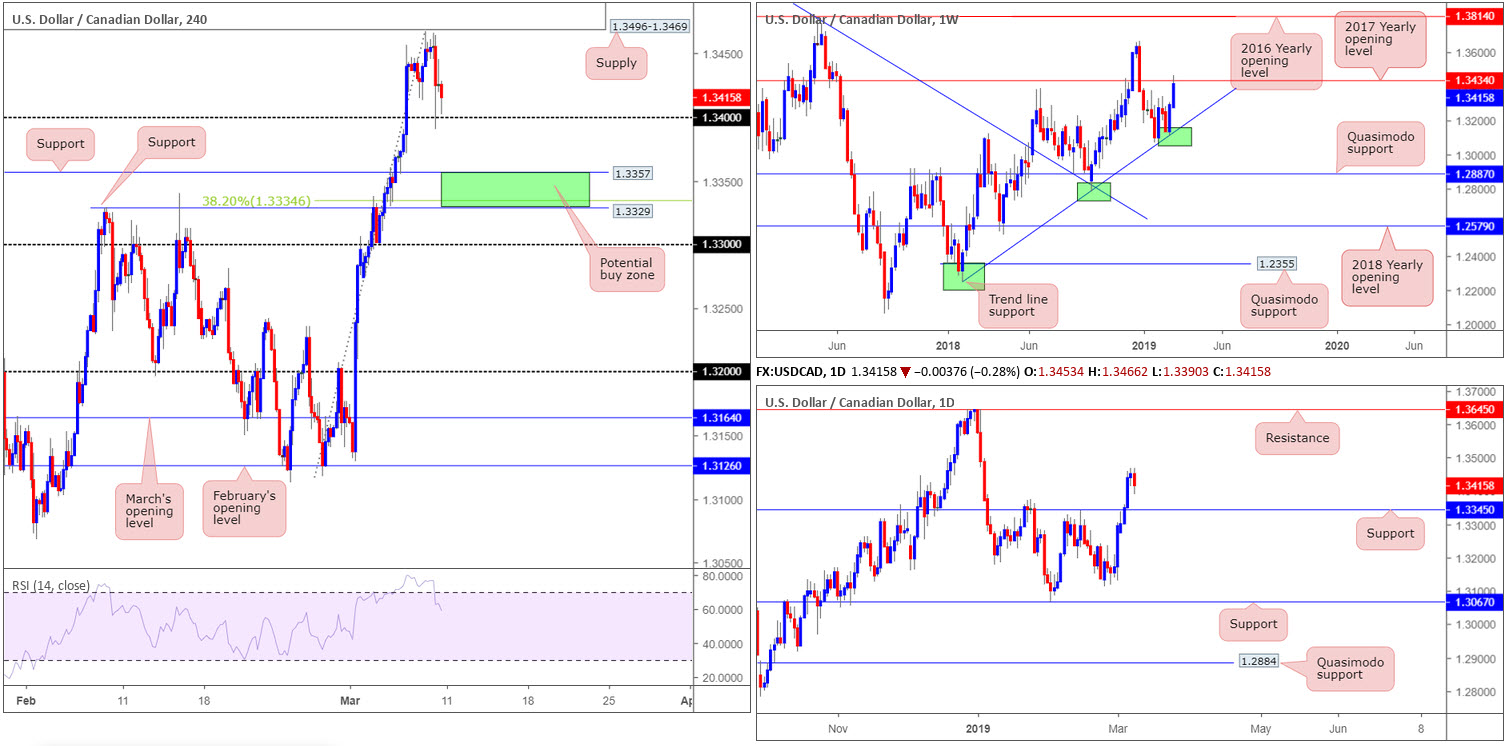
Following two back-to-back consecutive weeks of gains off trend line support (etched from the low 1.2247), the USD/CAD finds itself at a crossroads as price shook hands with the underside of the 2017 yearly opening level at 1.3434 last week. Continued buying this week may call for a test of the 1.3664 Dec 31 high, followed reasonably closely by the 2016 yearly opening level at 1.3814.
Daily perspective:
On the other side of the ledger, the daily candles exhibit scope to press higher this week. Wednesday witnessed a strong close take shape above resistance at 1.3345 (now acting support), theoretically paving the way as far north as resistance at 1.3645 – essentially the 1.3664 Dec 31 high highlighted on the weekly timeframe.
Before reaching 1.3645, though, a retest of 1.3345 as support is also a realistic scenario.
H4 perspective:
According to Statistics Canada Friday, employment grew for a second consecutive month, up 56,000 in February, driven by gains in full-time work. The unemployment rate was unchanged at 5.8% as the number of people searching for work held steady. This, coupled with total non-farm payroll employment out of the US offering little change in February (+20,000 – the fewest in more than a year), saw the USD/CAD drop lower and challenge its 1.34 handle.
Entering long from 1.34 is enticing for many traders, in view of the uptrend this market is in right now. Structurally, nonetheless, weekly sellers from 1.3434 may pose a problem, along with the fact daily price could drop lower to retest 1.3345.
Areas of consideration:
The zone marked in green on the H4 timeframe between support at 1.3329 and support at 1.3357 is of interest this week for possible buying. Aside from housing a 38.2% Fibonacci support at 1.3334, its connection to daily structure: support at 1.3345 is appealing. The only grumble here, of course, is weekly action threatening to overthrow the zone. For that reason, it is worth waiting for additional confirmation to form out of 1.3329/1.3357 before pulling the trigger. This could be using Bollinger bands on the lower timeframes or even using a H4 bullish candlestick signal to suggest buyer intent, its trader dependent.
Traders who feel the buy zone is strong enough to withstand selling pressure by and of itself may want to enter a limit buy order at 1.3345: the daily support, with a stop-loss order tightly tucked beneath 1.3329: the lower edge of the H4 zone. Should the setup work, the risk/reward from here to 1.34 (the next upside target on the H4 timeframe) would be around 1:3.
Today’s data points: US Core Retail Sales m/m; US Retail Sales m/m.
USD/CHF:
Weekly gain/loss: +0.88%
Weekly close: 1.0077
Weekly perspective:
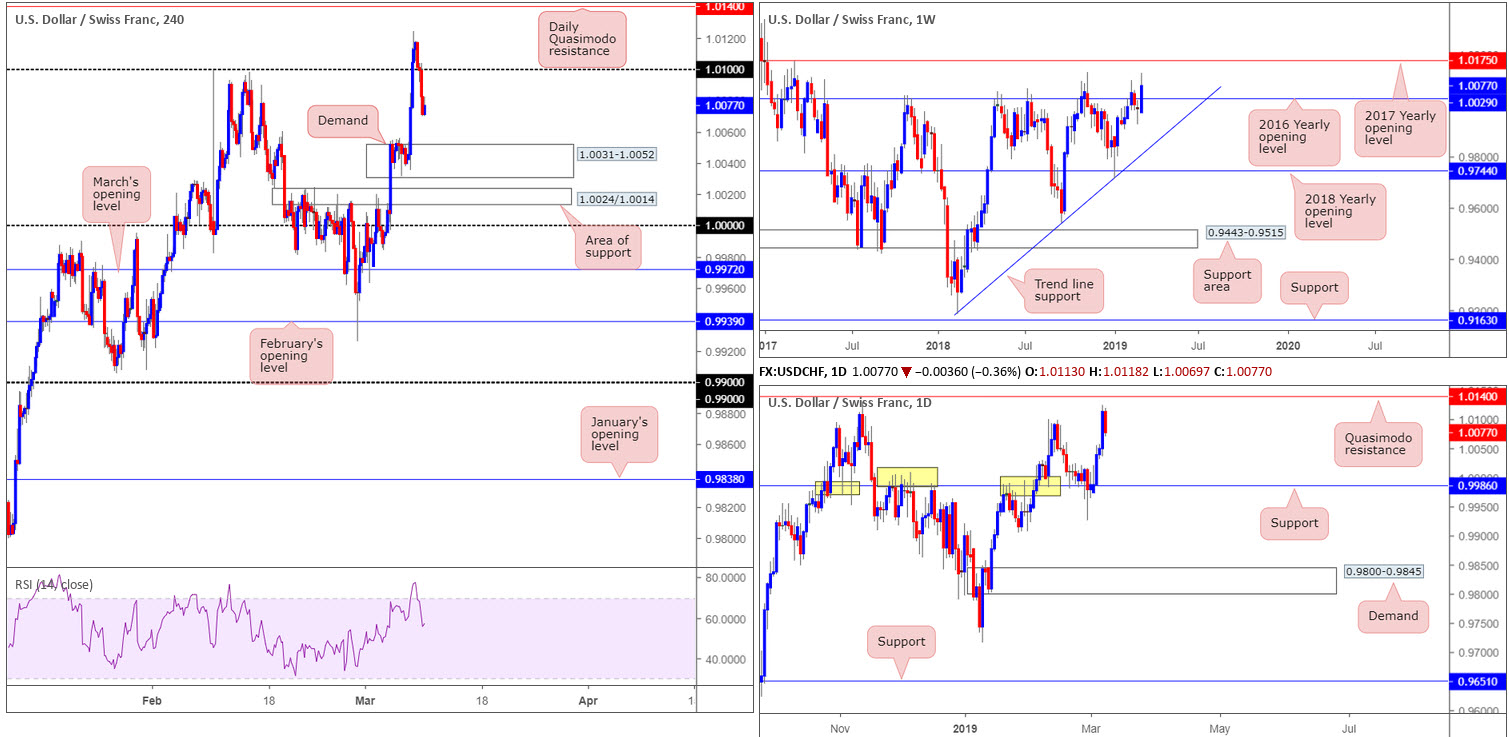
The US dollar wrapped up the week in strong fashion vs. the Swiss franc, tallying 88 points in value. The move brushed above the 2016 yearly opening level at 1.0029, a level that capped upside action since May 2017, and has exposed the 2017 yearly opening level at 1.0175 as viable resistance this week.
In-line with structure, the market also denotes a clear uptrend. After bottoming around 0.9716 at the beginning of the year, this formed another lower low which, judging by the positioning of the market on this timeframe at the moment, is likely to score a subsequent higher high this week.
Daily perspective:
While weekly flow is seen eyeing 1.0175 this week, daily movement has Quasimodo resistance at 1.0140 in the frame as its next upside objective. It’s also worth noting the support level printed at 0.9986. Boasting strong historical significance, this barrier is certainly worth a place on the watch list this week.
H4 perspective:
Stop-loss orders above 1.01 were filled amid US trading Thursday, which led to a selloff from highs of 1.0124 Friday, reclaiming 1.01 to the downside. The move took fuel from lower-than-expected US non-farm payrolls and concluded the week scoring a session low at 1.0069.
Demand at 1.0031-1.0052 is the next obvious support on this timeframe, followed closely by an area of support priced in at 1.0024/1.0014 and then the key figure 1.0000 (parity).
Areas of consideration:
Seeing weekly price eyeing higher levels this week, along with daily price displaying room to press towards 1.0140, longs from either of the H4 barriers highlighted above are an option today/early week (note the 2016 yearly opening level on the weekly timeframe [support] at 1.0029 is plotted between the two areas of support).
As it’s impossible to know which area will react, if any, traders are urged to wait for confirming price action. A H4 bullish candlestick signal, for example, not only identifies buyer intent, it also provides entry and risk levels. In terms of the first take-profit target, though, the 1.01 handle is eyed.
Today’s data points: US Core Retail Sales m/m; US Retail Sales m/m.
Dow Jones Industrial Average:
Weekly gain/loss: -2.01%
Weekly close: 25519
Weekly perspective:
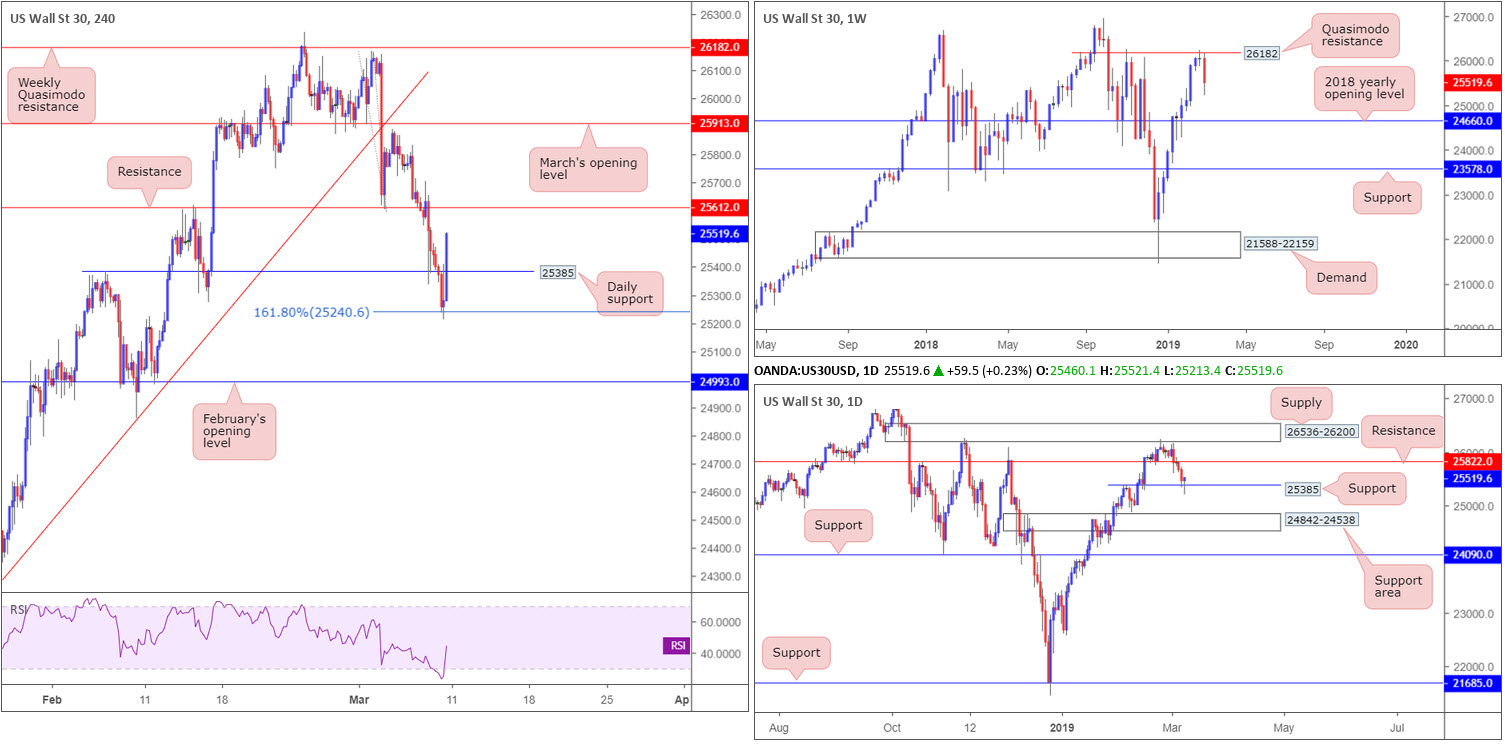
Upward momentum diminished over the course of last week, as the index embraced Quasimodo resistance at 26182. The week ended forming a strong bearish candle that could lead to further selling entering the fold, having seen room to move as far south as 24660: the 2018 yearly opening level.
Daily perspective:
Mild support at 25385, however, could pose problems for weekly sellers this week. The response from this angle came about in the form of a bullish pin-bar pattern, which may entice candlestick traders into the market early week and target resistance plotted at 25822. Beyond here, the buyers have supply at 26536-26200 in sight.
H4 perspective:
Disappointing US non-farm payrolls Friday struck a bearish tone in US equity markets, dragging the Dow Jones Industrial Average to lows of 25213. As you can see, though, the move was short lived as buyers defended a 161.8% Fibonacci ext. point at 25240, allowing the index to reclaim daily support at 25385 and form the daily bullish pin-bar pattern.
Despite daily buyers likely gearing up for a run north, nearby H4 resistance at 25612 is visible. In view of its recent history, a response from this angle is expected.
Areas of consideration:
In essence, we have weekly price eyeballing lower levels and daily flow indicating it may want to touch gloves with a nearby resistance level at 25822. In addition to this, H4 movement has neighbouring resistance at 25612 in the frame.
Irrespective of the direction selected, opposing structure is clear and, therefore, makes it a difficult market to trade today and possibly early week.
Today’s data points: US Core Retail Sales m/m; US Retail Sales m/m.
XAU/USD (GOLD):
Weekly gain/loss: +0.39%
Weekly close: 1298.0
Weekly perspective:
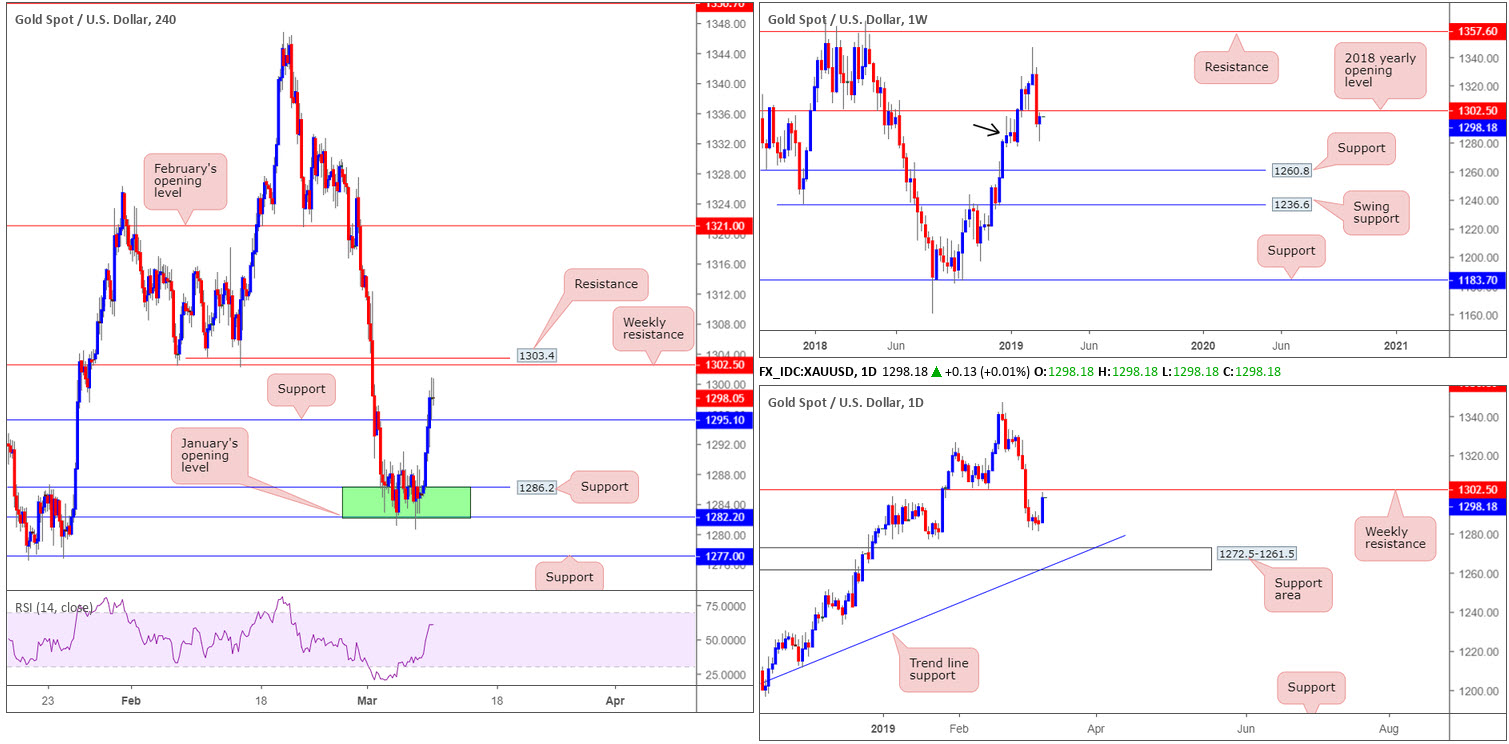
By way of a near-full-bodied bearish candle, bullion shed more than 2.50% two weeks ago. Leaving resistance at 1357.6 unopposed, the metal conquered the 2018 yearly opening level at 1302.5 in strong fashion. We do have some demand in motion around 1276.5-1298.5 (black arrow), which has attracted buyers and positioned price action within striking distance of 1302.5 as resistance this week.
Daily perspective:
Other than a support area positioned just south of the current weekly demand at 1272.5-1261.5 (merges with a trend line support extended from the low 1160.3), there’s not really much to add on this timeframe.
H4 perspective:
Since the beginning of last week, the research team was beating the drum for a possible advance from 1282.2/1286.2 (green area comprised of January’s opening level at 1282.2 and support at 1286.2). The interest in this zone largely stemmed from the weekly timeframe’s position within demand at 1276.5-1298.5.
As is evident from the chart, despite a tight consolidation forming throughout the week, bullion took off north from the said H4 zone, influenced by Friday’s less-than-expected US non-farm payrolls. The move firmly pushed through resistance at 1295.1 (now acting support), and now, as already highlighted above, has weekly resistance in the frame at 1302.5. Well done to any of our readers who managed to take advantage of recent buying.
Areas of consideration:
All three charts point to a possible retest of weekly resistance at 1302.5 this week, which given the clear lower low printed on the daily timeframe (breaking 1302.4), is likely to be defended this week. This level is also given extra emphasis on the H4 timeframe with nearby resistance at 1303.4 in sight – note this level is a Quasimodo support-turned resistance which are high-probability trading levels.
Traders could simply enter short at 1302.5 and place stops at a pre-defined distance above the entry and hope for the best, targeting H4 support at 1295.1 as the initial downside port. Those not comfortable with this have the choice of waiting for additional confirmation. A favourite among technicians is candlestick confirmation (entry and stop parameters can be decided according to the pattern).
The accuracy, completeness and timeliness of the information contained on this site cannot be guaranteed. IC Markets does not warranty, guarantee or make any representations, or assume any liability with regard to financial results based on the use of the information in the site.
News, views, opinions, recommendations and other information obtained from sources outside of www.icmarkets.com.au, used in this site are believed to be reliable, but we cannot guarantee their accuracy or completeness. All such information is subject to change at any time without notice. IC Markets assumes no responsibility for the content of any linked site. The fact that such links may exist does not indicate approval or endorsement of any material contained on any linked site.
IC Markets is not liable for any harm caused by the transmission, through accessing the services or information on this site, of a computer virus, or other computer code or programming device that might be used to access, delete, damage, disable, disrupt or otherwise impede in any manner, the operation of the site or of any user’s software, hardware, data or property


