
Key risk events:
China CPI y/y and PPI y/y; FOMC Member Bowman Speaks.
(Previous analysis as well as outside sources – italics).
EUR/USD:
Weekly gain/loss: -1.36%
Weekly close: 1.0943
Weekly perspective:
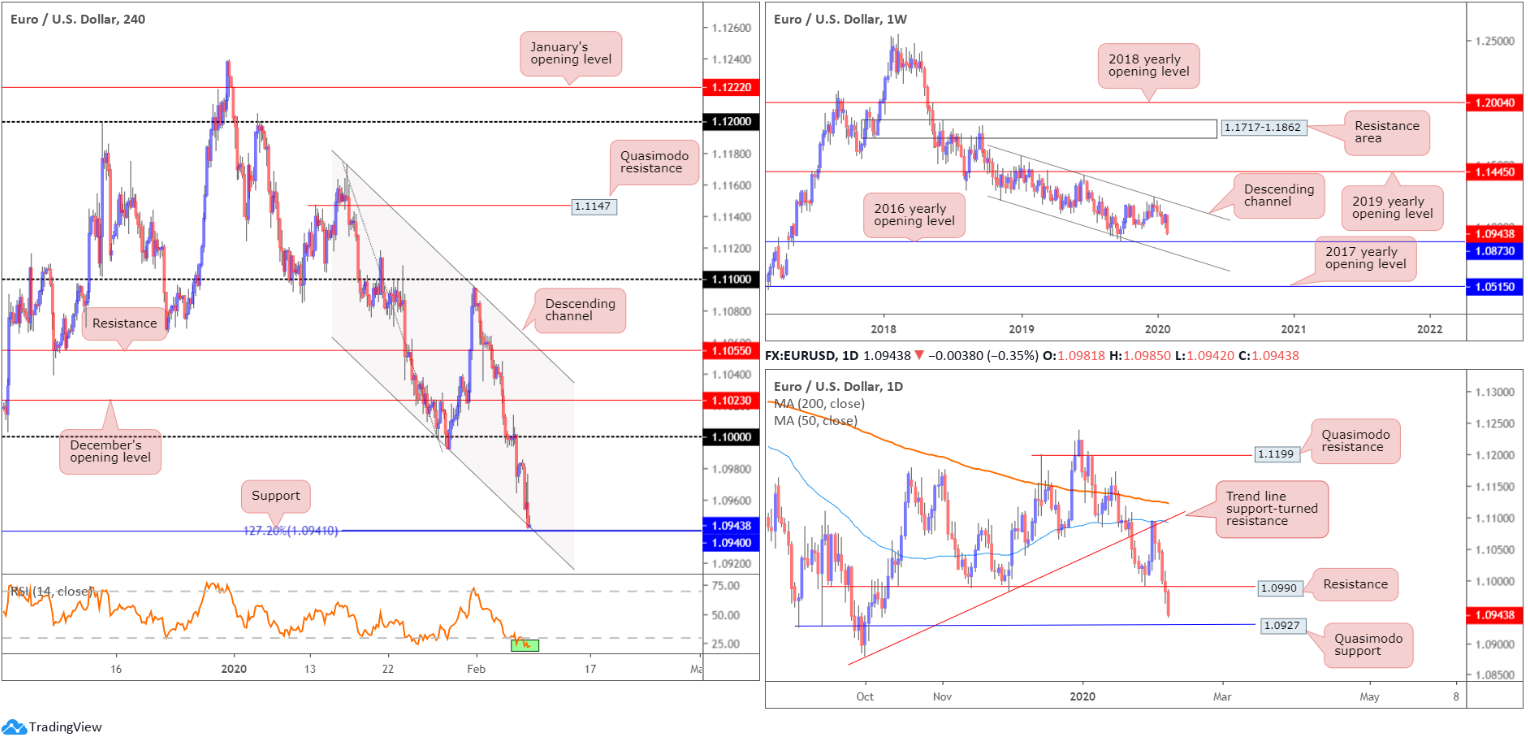
Despite a fleeting recovery to highs of 1.1095, EUR/USD witnessed a resurgence of selling last week, south of long-standing channel resistance, drawn from the high 1.1569. Downside targets rest at the 2016 yearly opening level from 1.0873 followed by channel support, taken from the low 1.1109.
Further supporting sellers is the primary trend, down since topping in early 2018, at 1.2555.
Daily perspective:
Thursday observed daily price swing through support at 1.0990 (now a serving resistance level), with Friday settling a few points north of Quasimodo support at 1.0927. This follows Monday’s decisive rejection from trend line support-turned resistance, extended from the low 1.0879, and 50-day SMA (blue – 1.1092).
Note the Quasimodo support’s low 1.0879 is stationed a handful of points ahead of the 2016 yearly opening level mentioned above on the weekly timeframe at 1.0873.
H4 perspective:
Total nonfarm payroll employment rose by 225,000 in January, and the unemployment rate was little changed at 3.6 percent, the US Bureau of Labour Statistics reported Friday. Notable job gains occurred in construction, in health care, and in transportation and warehousing.
The unemployment rate ticked higher to 3.6%, but for the right reason as the labour force participation rate increased 0.2 percentage points to 63.4%, matching its highest level since June 2013. Average hourly earnings rose 3.1% over a year ago to $28.44, ahead of estimates for 3% growth. That marked 18 consecutive months of wage gains above 3%, as the initially reported 2.9% for December was revised up to 3% (CNBC).
The impact of US jobs data guided price to lows of 1.0948, though swiftly pared losses and scored a high of 1.0976, before turning lower once more and testing channel support, pencilled in from the low 1.0992. The relative strength index (RSI) is also seen testing oversold waters (green), with support plotted nearby at 1.0940 as well as a 127.2% Fibonacci extension at 1.0941.
Areas of consideration:
While the H4 support combination is appealing for a bounce higher, daily support highlighted above in the form of a Quasimodo formation at 1.0927 lurks just south of the H4 supports. Therefore, a fakeout through the said H4 zone may be in store, tripping sell-stop liquidity and rebounding from the daily level.
Weekly support in the form of the 2016 yearly opening level at 1.0873 is also a noteworthy level to have noted this week. In fact, conservative traders long off the daily Quasimodo support are likely to use the weekly base to position stop-loss orders for long positions, equating to 54 points. The initial longer-term upside target rests around daily resistance at 1.0990.
GBP/USD:
Weekly gain/loss: -2.42%
Weekly close: 1.2882
Weekly perspective:
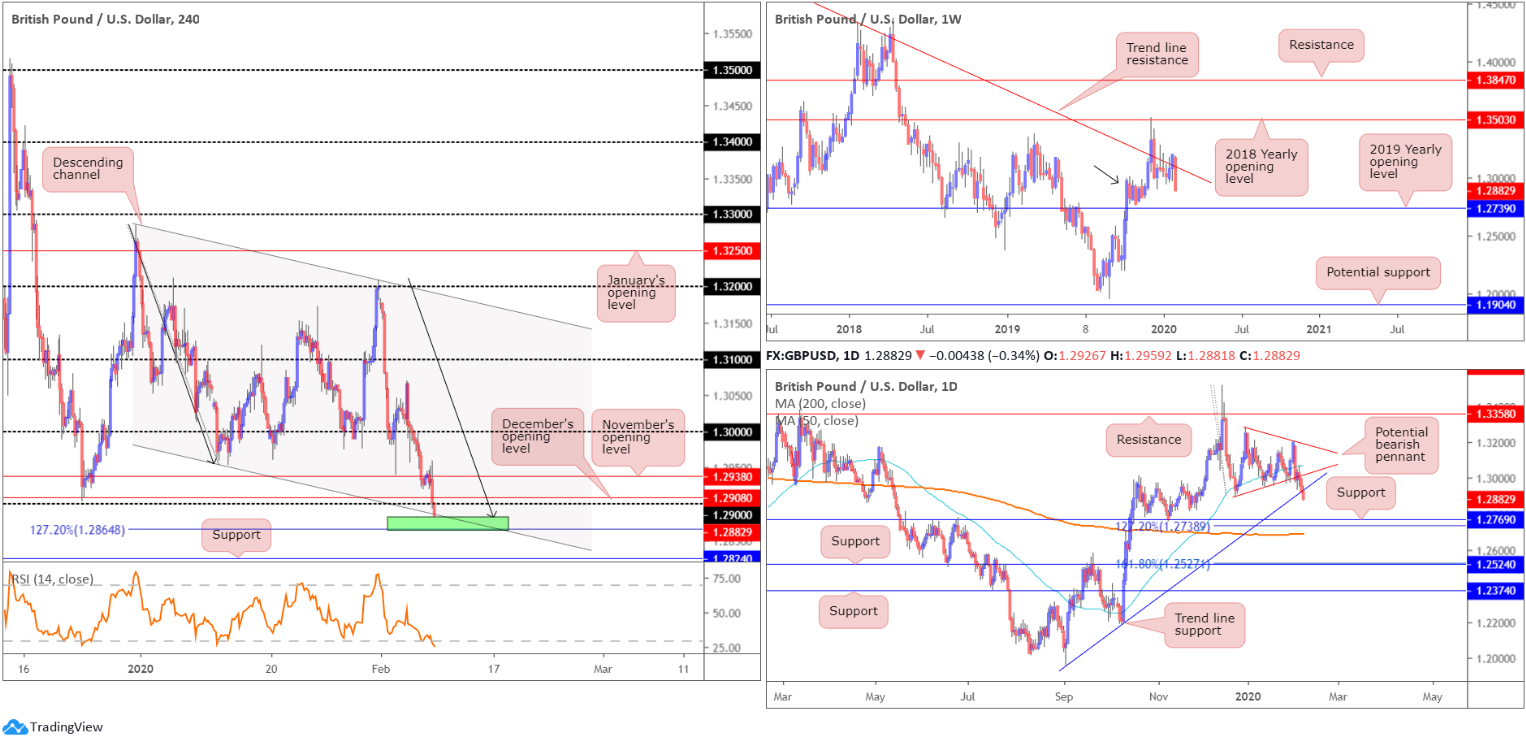
Shedding more than 300 points over the course of last week, price action trades beneath long-standing trend line resistance, pencilled in from the high 1.5930, though demand around the 1.2939 region is also still in motion (black arrow).
Continued downside this week may imply a break of the said demand, tripping sell stops and testing the 2019 yearly opening level at 1.2739.
Daily perspective:
Following Wednesday’s retest at the underside of the 50-day SMA (blue – 1.3069), the unit overthrew the lower edge of a bearish pennant pattern, extended from a high of 1.3284 and a low of 1.2904. In addition, Friday’s follow-through selling violated trend line support, taken from the low 1.1958, possibly setting the stage for a run to support fixed at 1.2769, a 127.2% Fibonacci extension at 1.2738 and the 200-day SMA (1.2690). Note the said SMA has been flattening since mid-October 2019.
H4 perspective:
The US dollar’s overall dominance and the return of Brexit angst witnessed GBP/USD tunnel through several notable technical supports Friday, including the post-UK election low 1.2904 and the 1.29 handle. Though buyers likely feel the squeeze, H4 structure reveals a potential reversal zone (green) between a bullish ABCD completion (black arrows) at 1.2880 and a 127.2% Fibonacci extension at 1.2864, along with the relative strength index (RSI) entering oversold terrain.
Areas of consideration:
Technically, according to the chart studies presented, this is a tricky market to read right now.
The weekly timeframe, although capped beneath trend line resistance, faces potential demand. The daily timeframe, nonetheless, recently punished the lower edge of a bearish pennant configuration and a trend line support, with room seen to move lower. This is a strong bearish cue, though may falter at weekly demand.
On the other hand, H4 price, while breaking beneath 1.29, traditionally a bearish cue, is crossing swords with a small, yet reasonably confluent, bullish reversal zone.
So, we have mixed signals on the weekly timeframe, a decisively bearish signal on the daily timeframe and H4 price testing a potential bullish reversal zone.
AUD/USD:
Weekly gain/loss: -0.22%
Weekly close: 0.6671
Weekly perspective:
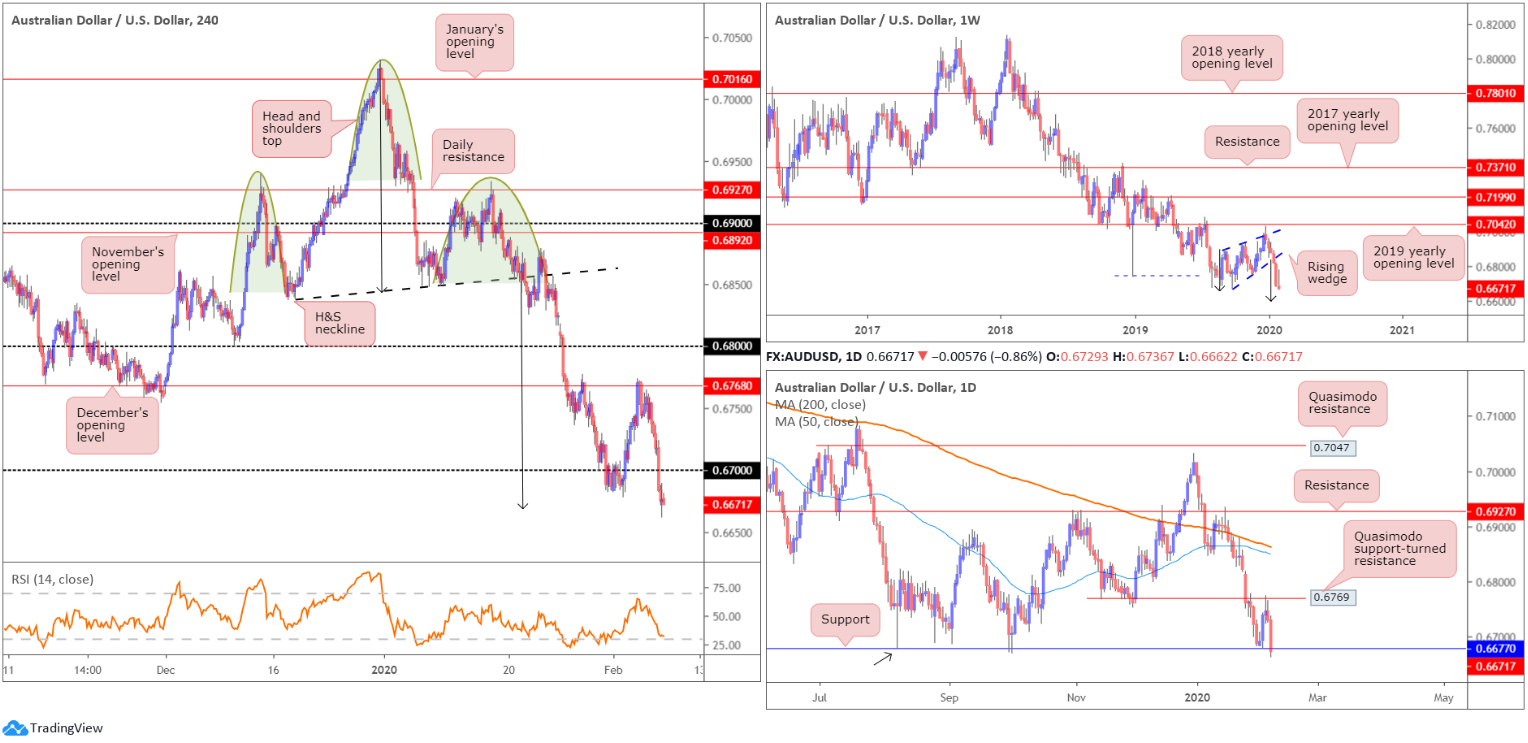
Since registering a bottom in late September at 0.6670 (2019), price carved out a rising wedge formation, typically considered a continuation pattern within a trending environment.
The past six weeks witnessed price decline back into the rising wedge and, thanks to recent selling, break and extend beyond the lower edge. With the primary downtrend having been in full force since topping at 0.8135, in early 2018, further downside is possible.
Assuming a close beneath the 0.6670 September 30th low, the rising wedge take-profit (black arrows – calculated by taking the height of the base and adding it the breakout point) is seen at 0.6599, followed by support at 0.6359 (not visible on the screen).
Daily perspective:
Price action on the daily timeframe settled at support from 0.6677, after respecting Quasimodo support-turned resistance at 0.6769 Wednesday. Note also that the current support level denotes a Quasimodo support base (black arrow).
The next support target beyond 0.6677, in the event of further selling, falls in around 0.6508 (not visible on the screen). Traders may also want to note both the 200/50-day SMAs continue to point south. The 200-day SMA has traded south since April 2018.
H4 perspective:
Despite posting a modest advance during the first half of the week, AUD/USD struggled to sustain gains above December’s opening level at 0.6768. Technical selling from 0.6768 and daily Quasimodo support-turned resistance at 0.6769, as well as the negative impact of the coronavirus outbreak and a dominant USD, saw the pair snap through 0.67 to lows at 0.6662, levels not seen since mid-March 2009.
Areas of consideration:
Well done to any readers who managed to hold shorts from the head and shoulders top in January; price finally hit the H&S take-profit target at 0.6668 (black arrows – calculated by taking the distance between the head and the neckline and adding it to the breakout point). Likewise, well done to those who managed a short from December’s opening level at 0.6768/daily Quasimodo resistance at 0.6769. This was a noted resistance combination to be aware of in previous analysis, largely due to the weekly timeframe portending further downside (see above italics).
AUD/USD may recover some this week, based off daily support mentioned above at 0.6677 and traders covering short positions. Despite this, though, further downside is still potentially on the cards as weekly price eyes completion of the rising wedge pattern around 0.6599, essentially the 0.66 handle on the H4 timeframe (not visible on the screen). Therefore, some traders may attempt shorts off the underside of 0.67 should a retest occur.
USD/JPY:
Weekly gain/loss: +1.29%
Weekly close: 109.75
Weekly perspective:
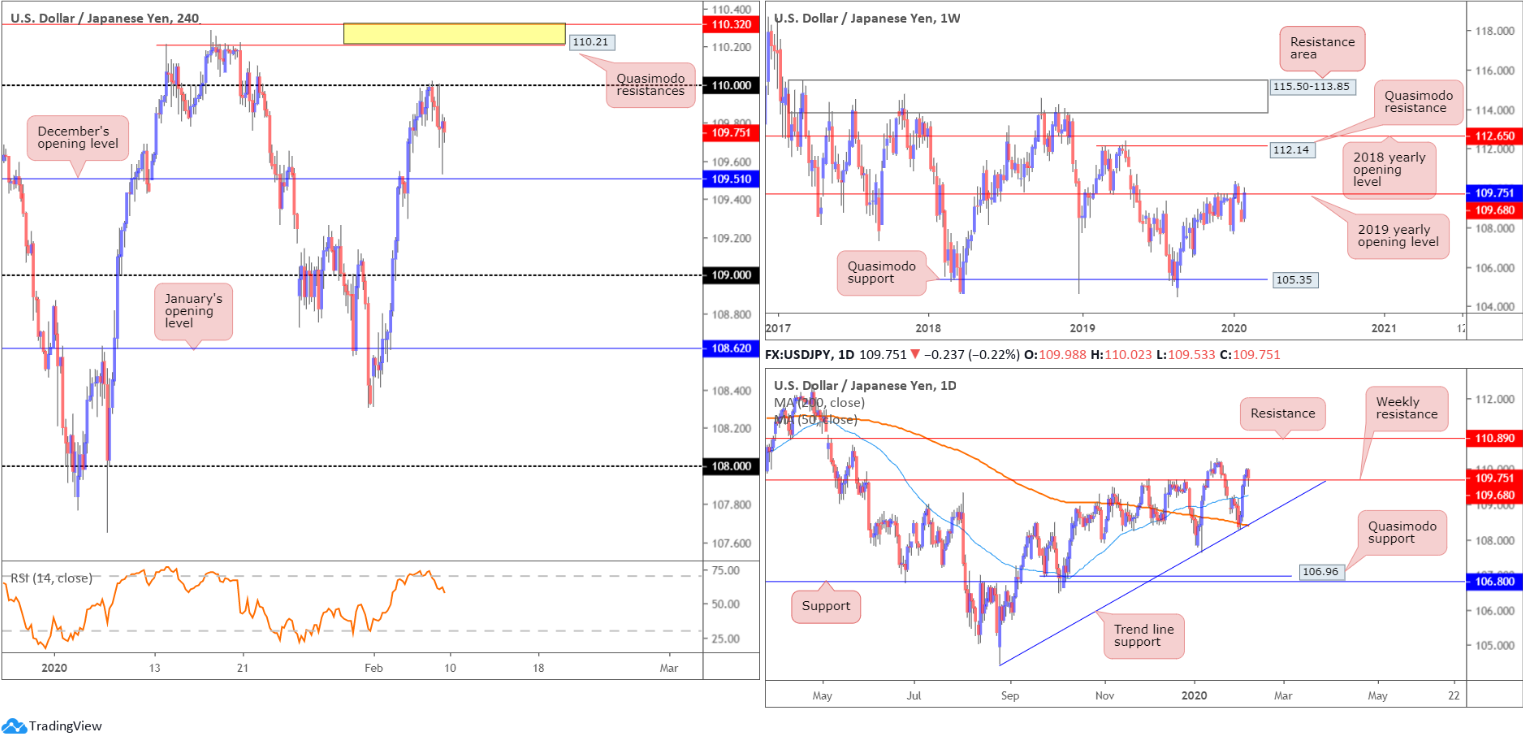
After scoring a weekly low of 108.31, USD/JPY bulls entered a bullish phase, consequently reconnecting with the 2019 yearly opening level at 109.68. A decisive push above the said barrier underlines a possible approach towards Quasimodo resistance at 112.14, closely followed by the 2018 yearly opening level at 112.65, over the coming weeks.
A rejection, however, could entice moves to the 107.65 January 6th low this week. Beneath the aforementioned low, limited support is evident until reaching the 106.48 September 30th low, followed by Quasimodo support coming in at 105.35.
Daily perspective:
A closer examination of price action on the daily timeframe reveals the unit discovered a floor of support at the beginning of the week off the 200-day SMA (orange – 108.40), located a couple of points ahead of trend line support, extended from the low 105.59.
The pair caught a healthy bid Tuesday, running through the 50-day SMA (blue – 109.24) and conquering weekly resistance on Wednesday. Note price retested weekly resistance as support at the tail end of the week, chalking up a mild correction.
H4 perspective:
The US dollar ended a shade lower against its Japanese counterpart Friday, erasing more than 20 points and snapping a four-day bullish phase. The after-effects of the US non-farm payrolls initially guided the pair to the underside of 110. Enthusiasm swiftly dwindled, however. Technical selling from 110, along with risk sentiment taking a hit, saw increased demand for the safe-haven Japanese yen. US Treasury yields also took a hit, specifically the 10-year note falling 3.7%, forcing the USD/JPY to lows of 109.53.
USD/JPY support on the H4 timeframe can be seen around December’s opening level at 109.51, though let’s remain cognizant of daily price retesting weekly resistance-turned possible support at 109.68. Indicator-based traders may also note the relative strength index (RSI) recently exited overbought territory, following an earlier peak at 75.00.
Areas of consideration:
Based on the weekly timeframe’s structure, the 2019 yearly opening level at 109.68 remains a probable resistance. A close above the level by seven pips is not a cause for concern on the weekly timeframe.
Daily price shows the unit retesting the weekly level as support, though has yet to pencil in anything of note to the upside.
This leaves H4 movement, which, as highlighted above, is fading 110 with support seen at 109.51
Going on the above, sellers still appear to have the upper hand, and a H4 close beneath December’s opening level at 109.51 would show this and unlock the door for bearish scenarios to the 50200-day SMAs and the 109 handle.
USD/CAD:
Weekly gain/loss: +0.51%
Weekly close: 1.3303
Weekly perspective:
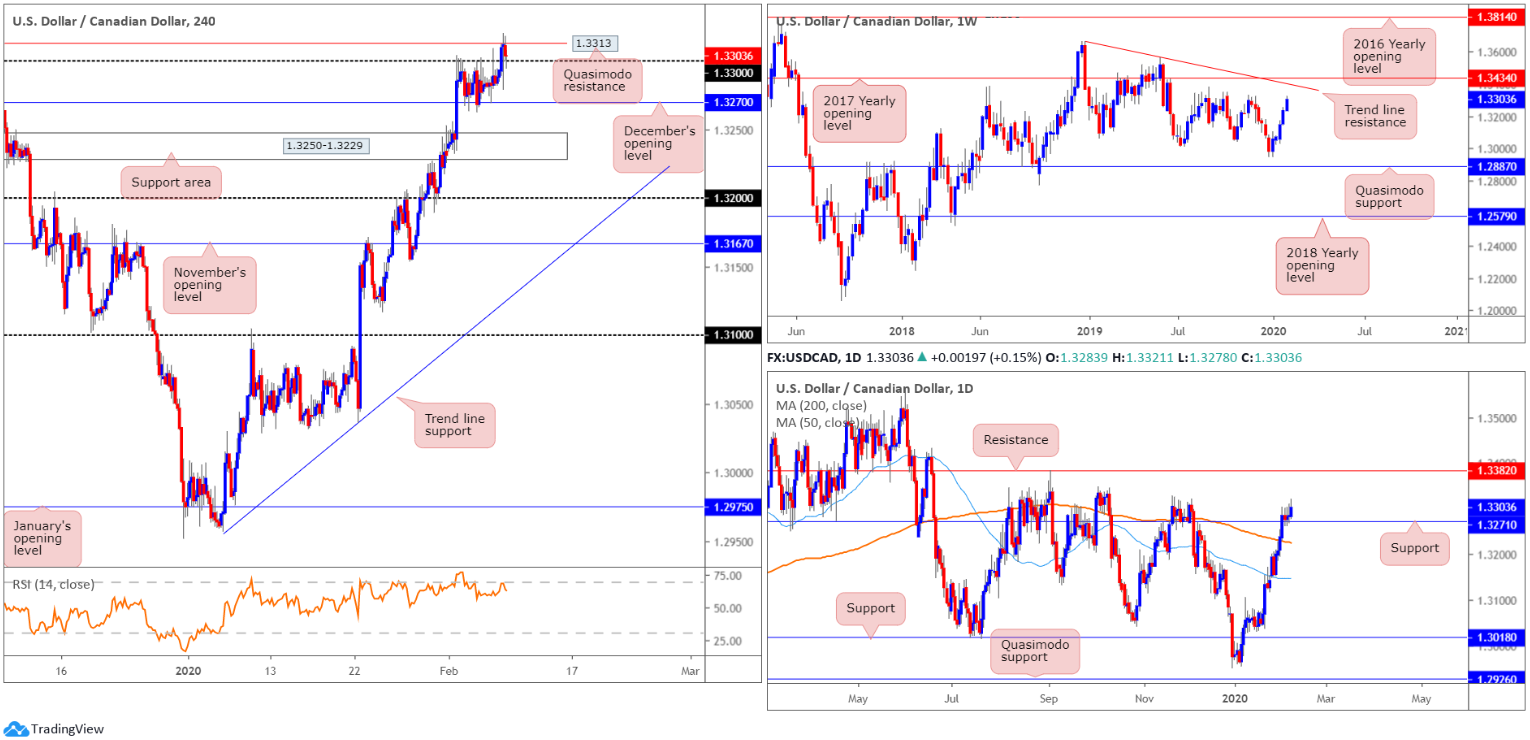
USD/CAD recorded its fifth successive gain last week, adding more than 65 points. Leaving Quasimodo support at 1.2887 unchallenged, and tripping longer-term sell stops beneath the 1.3015 July 15th (2019) low, price action now trades around tops at 1.3317, with trend line resistance (1.3661) and the 2017 yearly opening level at 1.3434 also in sight.
Daily perspective:
Resistance-turned support at 1.3271 currently offers a ‘floor’ in this market. To the upside, the research team sees little in the way of active supply until reaching resistance at 1.3382.
Beneath the said support level, the 200-day SMA (orange – 1.3226) appears to be flattening, sited just ahead of the 50-day SMA (blue – 1.3146), which also appears to be flattening out.
H4 perspective:
US Total nonfarm payroll employment rose by 225,000 in January, and the unemployment rate was little changed at 3.6 percent, the US Bureau of Labour Statistics reported Friday.
Employment in Canada increased by 35,000 (+0.2%) in January, all in full-time work. The unemployment rate fell 0.1 percentage points to 5.5%, according to Statistics Canada. Both metrics reported better-than-consensus values.
Since the beginning of last week, buyers and sellers were squaring off within a narrow range between December’s opening level drawn from 1.3270 and the 1.33 handle.
Beyond 1.33, Quasimodo resistance resides at 1.3313, which entered the mix in early London on Friday. It may also interest some traders to note the relative strength index (RSI) remains languishing beneath its overbought value after reaching highs of around 79.00 earlier in the week, consequently producing bearish divergence. The break above 1.33 likely tripped a number of buy stops while attracting profit taking off the said Quasimodo resistance. While further selling below 1.33 may occur this week, further buying is equally likely as the daily timeframe exhibits scope to press for higher ground.
Areas of consideration:
For traders who read Friday’s technical briefing you may recall the following:
Intraday could observe a break back through 1.33 after tripping additional buy stops and filling sellers off H4 Quasimodo resistance at 1.3313. This may only be good for a move to 1.3270, so positioning protective stop loss orders above the apex of the Quasimodo pattern (1.3321) could be an option, ensuring reasonable risk/reward, should the trade work in favour.
Well done to any readers who managed a sell; a H4 close south of 1.33 is now likely eyed.
In the event we push above 1.3313, buyers may be tempted to enter long. Although a long could work, knowing where we’re positioned on the daily timeframe, trading into weekly tops around 1.3317 may equally encourage sellers into the market.
USD/CHF:
Weekly gain/loss: +1.45%
Weekly close: 0.9770
Weekly perspective:
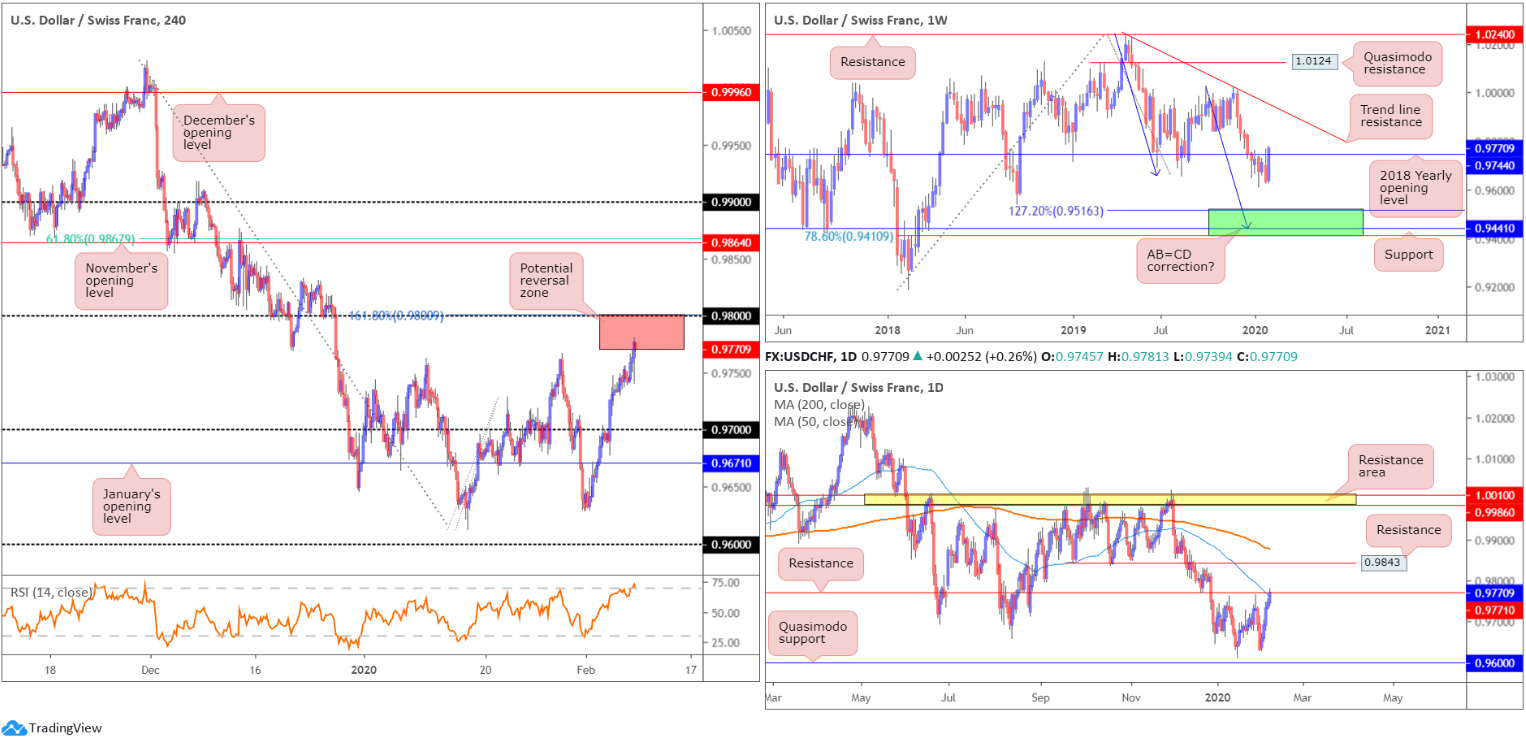
A stronger-than-expected recovery emerged in recent trading, marginally brushing aside the 2018 yearly opening level at 0.9744 and reaching highs at 0.9781.
At this stage, navigating higher is possible this week, perhaps targeting trend line resistance, etched from the high 1.0236. Despite recent buying, the next notable downside target sits within 0.9410/0.9516, comprised of a 78.6% Fibonacci retracement at 0.9410, support at 0.9441 and a 127.2% AB=CD bullish correction (black arrows]) at 0.9516 – green.
Daily perspective:
Shaped by way of five consecutive bullish candles, USD/CHF crossed paths with resistance coming in at 0.9771 into last week’s close, a level that converges with the 50-day SMA (blue – 0.9761). Elbowing above the said resistance this week, in some respects, confirms buyer intent on the weekly timeframe. Daily resistance at 0.9843 is the next target in the firing range, with a break revealing the 200-day SMA (orange – 0.9877).
Turning lower from the current resistance level will, ultimately, draw attention to Quasimodo support at 0.9600.
H4 perspective:
Broad-based USD bidding elevated USD/CHF higher Friday, overthrowing the 0.9766 January 29th high and registering a weekly gain of more than 135 points.
The break of the said high likely tripped buy stops, with upside appearing starved of resistance until reaching the 0.98 handle and converging 161.8% Fibonacci extension. What’s also interesting from a technical perspective is the relative strength index (RSI) is seen testing overbought ground.
Areas of consideration:
While weekly price suggests the possibility of additional buying this week, the combination of daily resistance at 0.9771/50-day SMA and the round number at 0.98/161.8% Fibonacci extension, as well as RSI confirmation, is likely enough to attract sellers (red zone on H4).
Conservative sellers threatened by the recent close on the weekly timeframe, nevertheless, may opt to wait for additional confirmation, though this is trader dependent.
Dow Jones Industrial Average:
Weekly gain/loss: +2.83%
Weekly close: 29088
Weekly perspective:
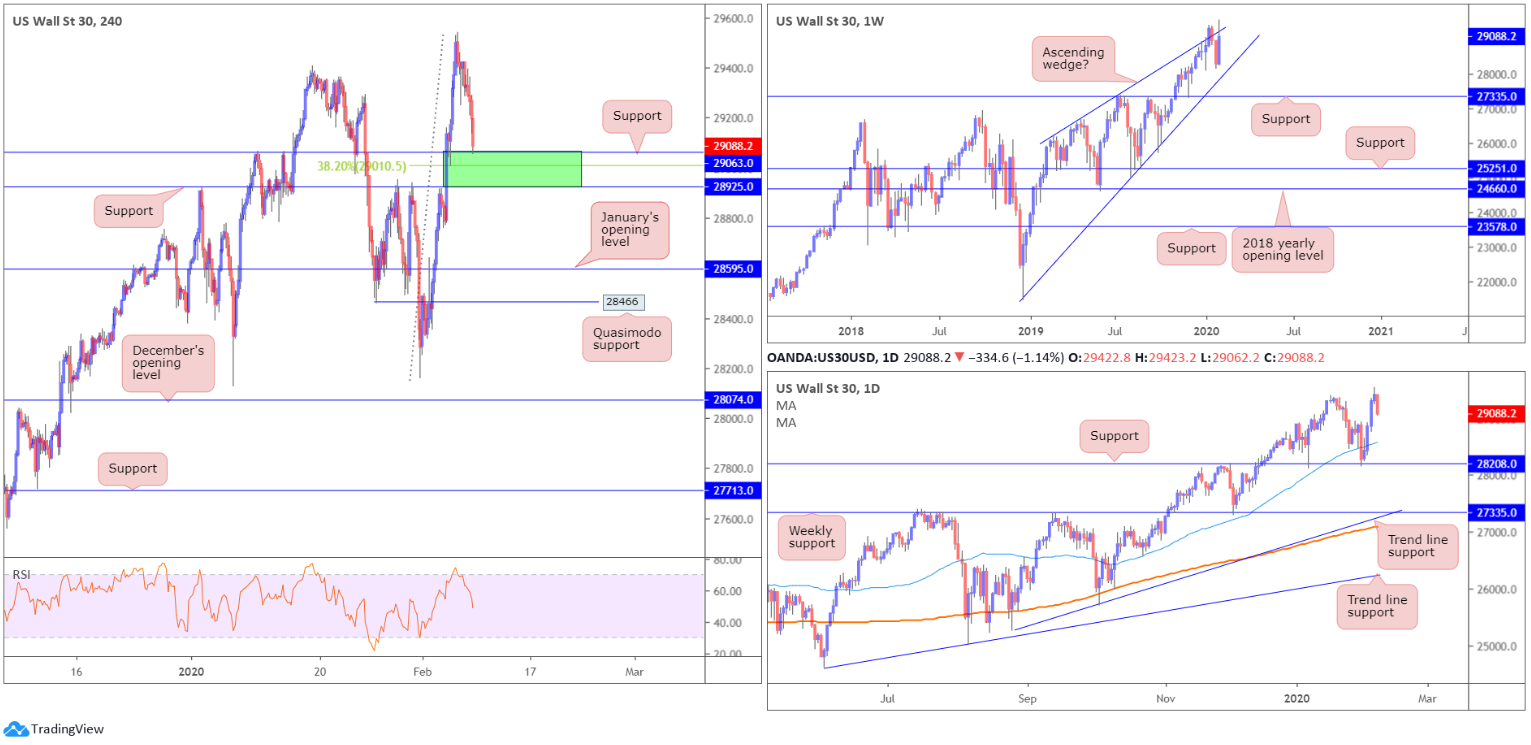
Despite clocking fresh all-time peaks at 29541 last week, the weekly timeframe shows the index has been compressing within an ascending wedge since the beginning of 2019 (21452/26668). Outside of the aforementioned wedge, support rests at 27335.
Daily perspective:
Focus on the daily timeframe, with respect to support levels, remains around the 28208 region. However, traders may also find support draws off the 50-day SMA (blue – 28587).
H4 perspective:
Major US benchmarks dipped Friday amid lingering coronavirus fears, snapping a four-day winning streak. The Dow Jones Industrial Average erased 277.26 points, or 0.94%; the S&P 500 lost 18.07 points, or 0.54% and the tech-heavy Nasdaq 100 ended lower by 44.82 points, or 0.47%.
Although pulling back Friday, the 30-stock benchmark advanced nearly 3% on the week. Structure on the H4 timeframe shows price tested support drawn from 29063 at the tail end of the session. Another layer of support resides close by at 28925, with a break exposing January’s opening level at 28595 and Quasimodo support at 28466.
Areas of consideration:
Either of the H4 supports highlighted above could hold price higher this week, given we recently clocked fresh records. The area marked in green between 28925/29063 is particularly attractive as it holds a 38.2% Fibonacci value at 29010 within.
Waiting for additional confirmation to form may be an idea before committing to a long position; it’s difficult to know which support level will hold, if any. Additional confirmation might be something as simple as a bullish candlestick signal.
XAU/USD (GOLD):
Weekly gain/loss: -1.23%
Weekly close: 1570.1
Weekly perspective:
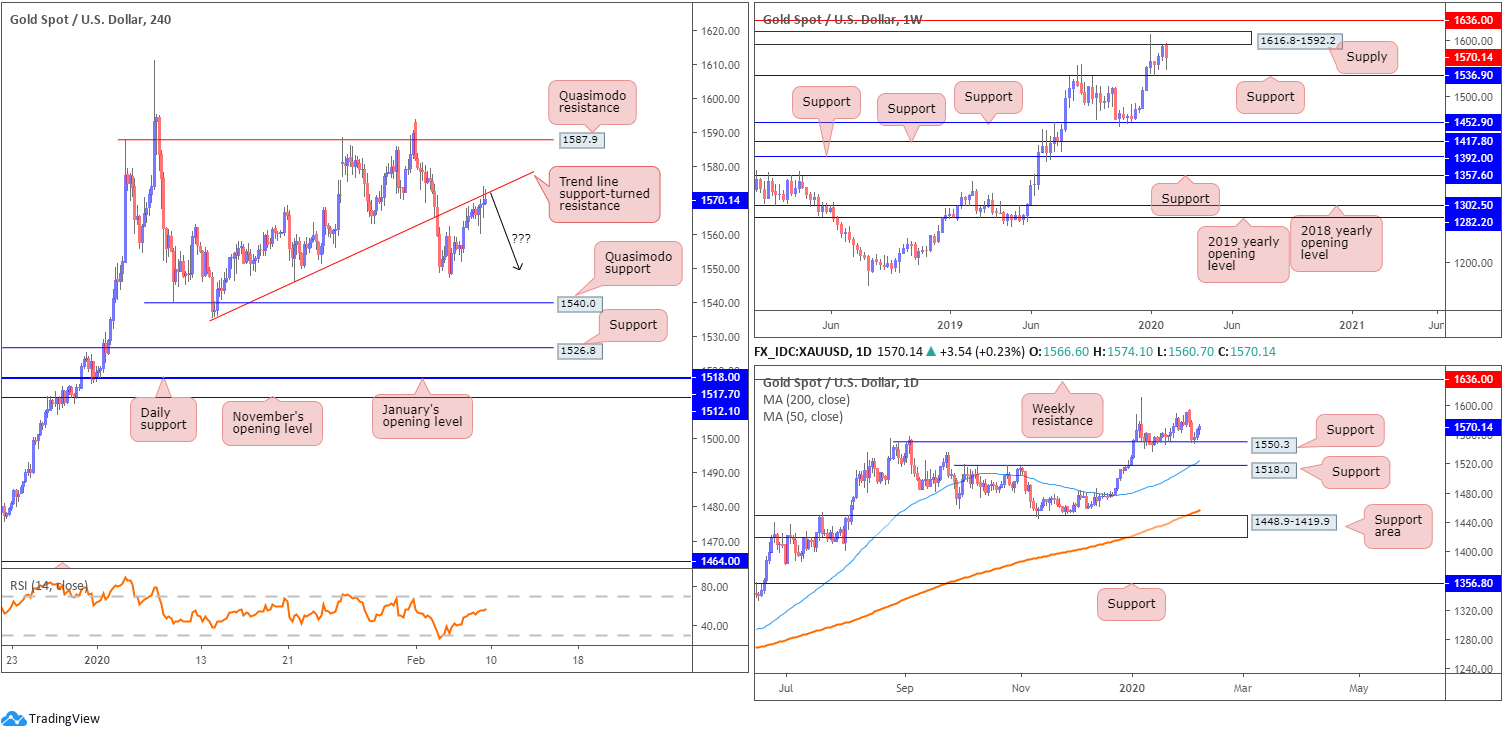
Since the beginning of the year, longer-term candles have been confined to a range between supply drawn from 1616.8-1592.2 and support seen at 1536.9.
Areas outside of this area can be seen at resistance from 1636.0 and support fixed at 1452.9.
Daily perspective:
A closer reading of price action on the daily timeframe has the unit rebounding from support at 1550.3, fixed north of another layer of support at 1518.0, which happens to merge closely with the 50-day SMA (blue – 1524.1). As you can see, weekly and daily structure have diverging views right now.
H4 perspective:
Developments on the technical front has H4 stationed off trend line support-turned resistance, taken from the low 1536.2. Continued bidding from here invites an approach towards Quasimodo resistance coming in at 1587.9, whereas a rejection, aside from Wednesday’s low at 1547.6, has Quasimodo support at 1540.0 to target.
Areas of consideration:
Although further recovery off daily support at 1550.3 may develop, the threat of further selling on the weekly timeframe to support at 1536.9 is certainly there. With higher timeframes usually taking precedence over lower timeframes, a turn lower at the current H4 trend line resistance is achievable. What’s also appealing here is the closing candle produced a shooting star pattern, considered a bearish signal at peaks. Not only does this help identify seller intent, it provides entry and risk levels to work with.
The accuracy, completeness and timeliness of the information contained on this site cannot be guaranteed. IC Markets does not warranty, guarantee or make any representations, or assume any liability regarding financial results based on the use of the information in the site.
News, views, opinions, recommendations and other information obtained from sources outside of www.icmarkets.com.au, used in this site are believed to be reliable, but we cannot guarantee their accuracy or completeness. All such information is subject to change at any time without notice. IC Markets assumes no responsibility for the content of any linked site.
The fact that such links may exist does not indicate approval or endorsement of any material contained on any linked site. IC Markets is not liable for any harm caused by the transmission, through accessing the services or information on this site, of a computer virus, or other computer code or programming device that might be used to access, delete, damage, disable, disrupt or otherwise impede in any manner, the operation of the site or of any user’s software, hardware, data or property.


