
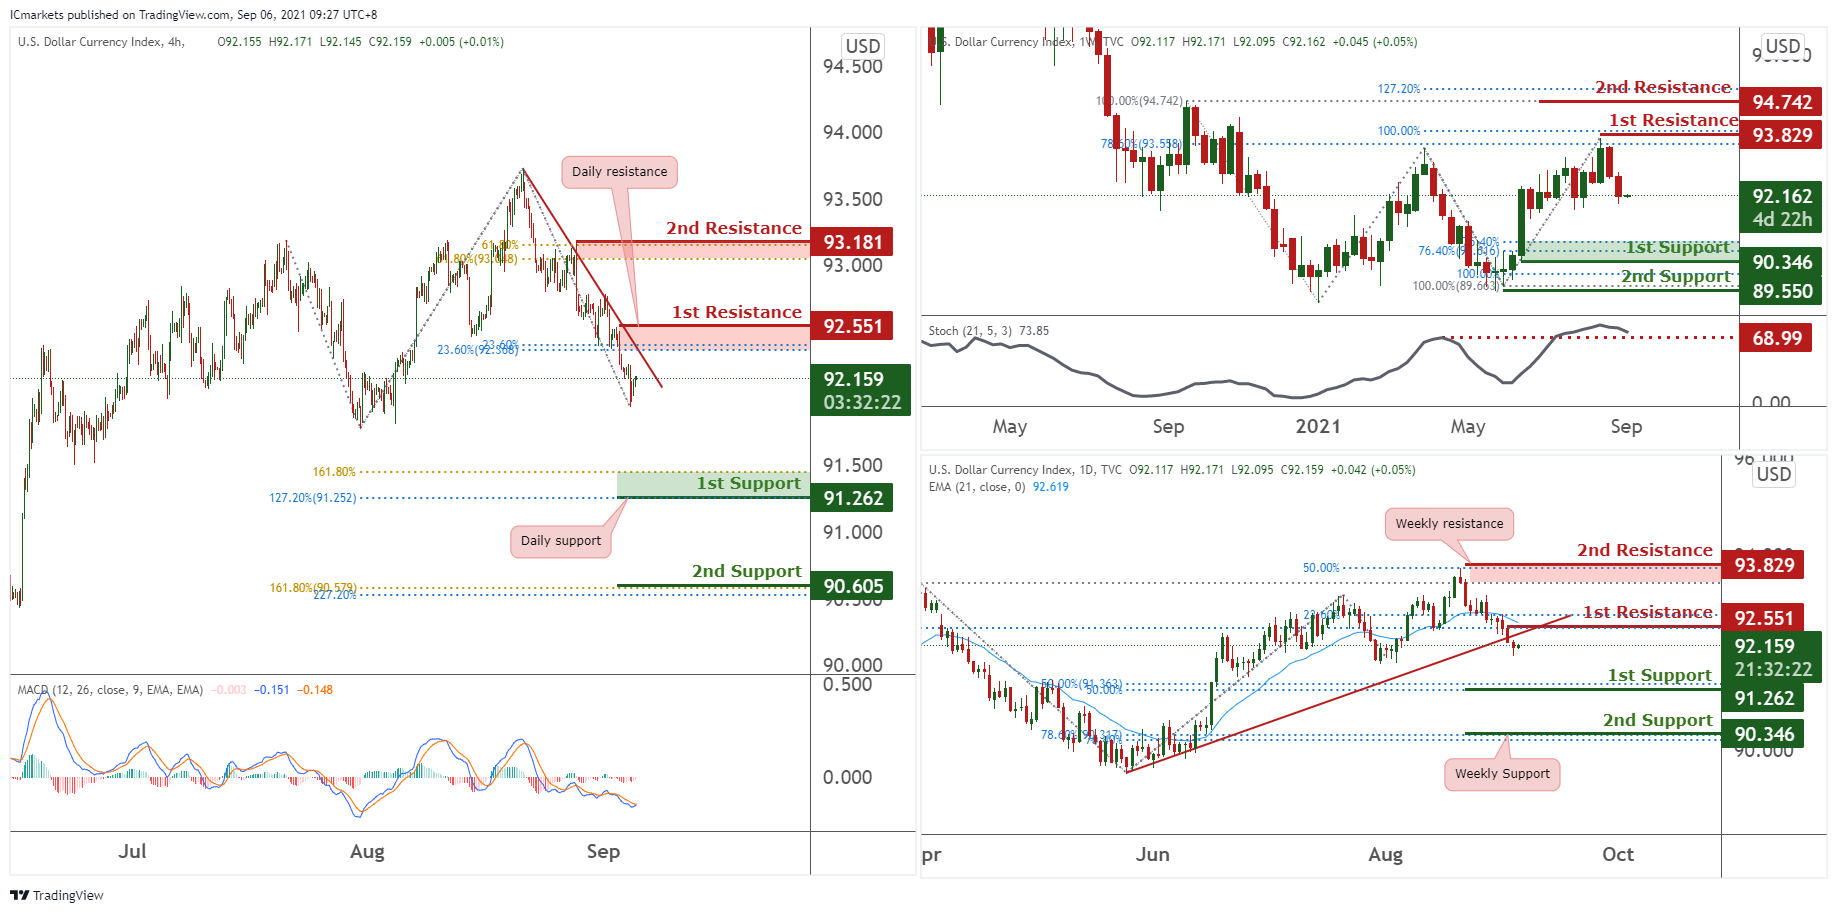
DXY:
Looking at the Weekly chart price may bearish towards the 1st support at 90.346 in line with 76.4% Fibonacci retracement and 76.4% Fibonacci extension. Our bearish bias is further supported by how stochastic testing resistance where price dropped in the past. Otherwise, price may be bullish towards the 1st resistance at 93.829 in line with 78.6% Fibonacci retracement and 100% Fibonacci extension.
On the Daily timeframe, price is below the ascending trendline support (now resistance) and 1st resistance at 92.551 in line with 76.4% Fibonacci retracement and 23.6% Fibonacci extension and may bearish towards the 1st support at 91.262 in line with 50% Fibonacci retracement and 50% Fibonacci extension. Our bearish bias is further supported by price is below the EMA. Otherwise, price may bullish towards the 1st resistance at 92.551 in line with 76.4% Fibonacci retracement and 23.6% Fibonacci extension.
On the H4 timeframe, price is below the descending trendline resistance and may bearish towards the 1st support at 91.262 in line with 127.2% Fibonacci retracement and 161.8% Fibonacci extension. Our bearish bias is further supported by how MACD is shown to be holding below the 0 line. Otherwise, price may bullish towards the 1st resistance at 92.551 in line with 23.6% Fibonacci retracement and 23.6% Fibonacci extension.
Areas of consideration:
- H4 time frame, 1st resistance of 92.551
- H4 time frame, 1st support of 91.262
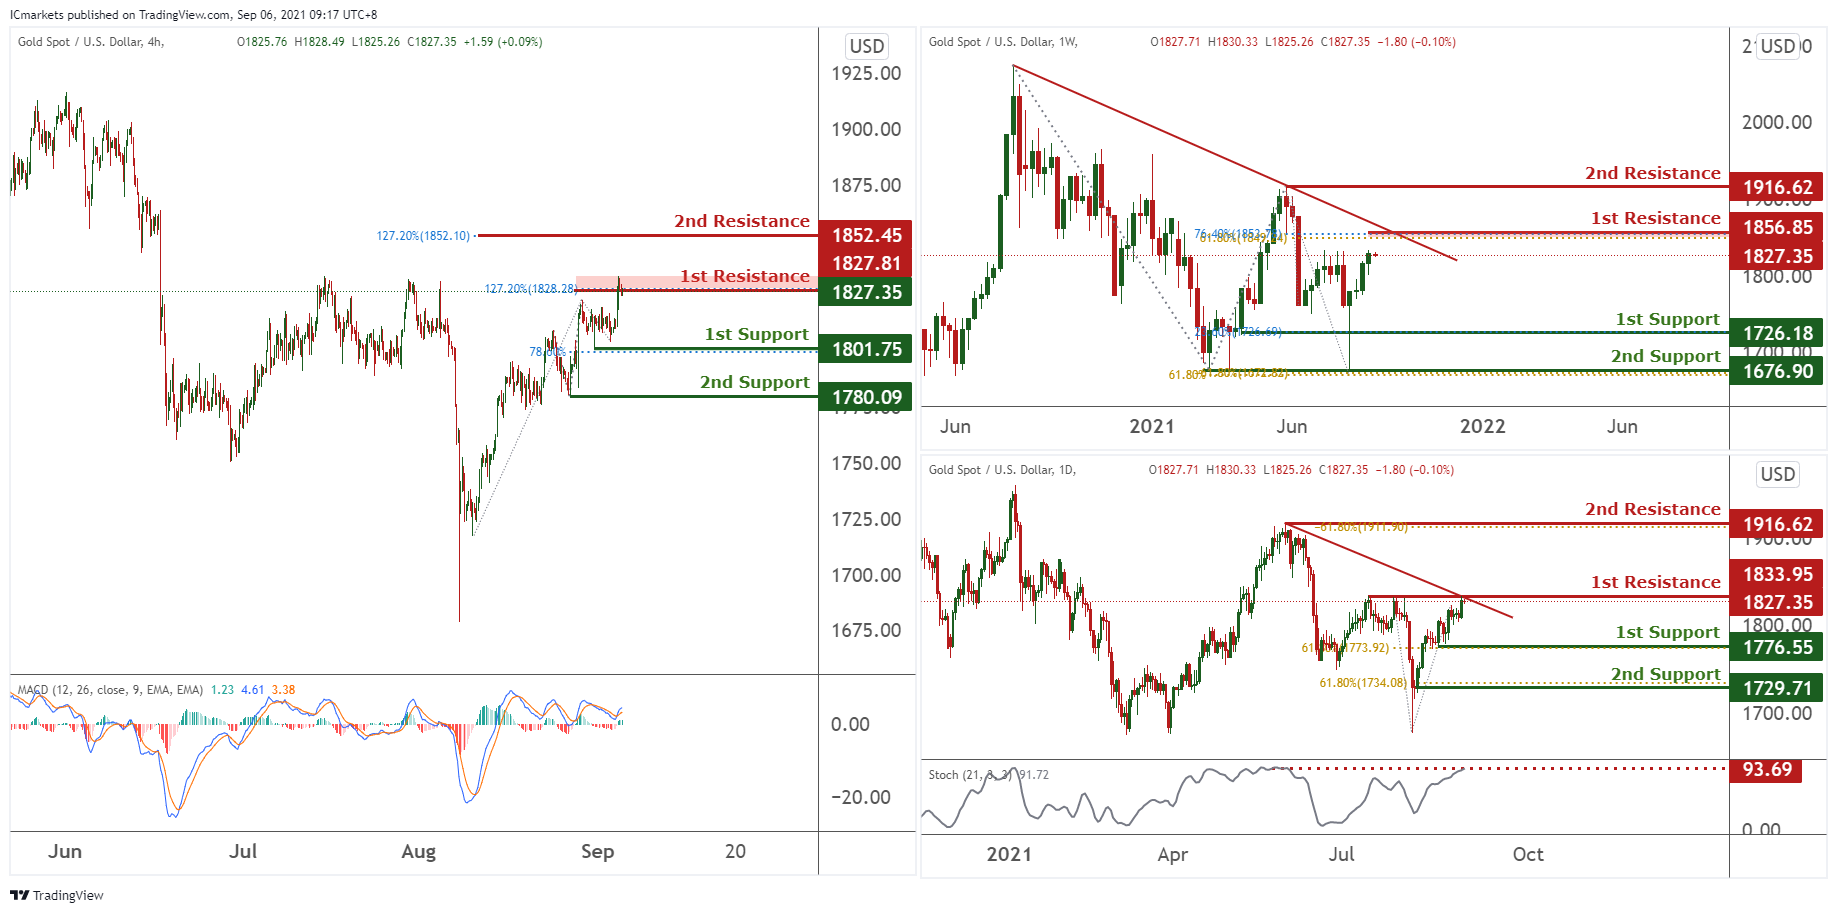
XAU/USD (GOLD):
On the weekly timeframe, price have recently bounced off 2st support at 1676.90 and is approaching 1st resistance at 1856.85. Long term buyers could possibly add to their positions here and push price higher towards graphical resistance at 1856.85 level. Otherwise, a break above our first resistance will see price push higher towards our 2nd resistance at 1916.62.
On the Daily chart, price has moved higher and has touched our 1st resistance at 1833.95. We see a medium possibility of bearish scenario where prices might dip and sellers may enter for shorts, looking for a possible exit at the 1st support level of 1776.55 with 61.8% Fibonacci levels. Stochastics are reacting close to short term intermediate resistance as well. Otherwise, breaking above 1st resistance will see price push towards 2nd resistance at 1916.62.
On the H4 chart, price has broke 1st resistance at 1827.81 and is lingering at area of resistance. We see a medium possibility scenerio where there will be a reversal of trend and price will dip towards 1st support level at 1801.75. Alternatively, breaking the area of resistance might see prices moving higher towards our 2nd resistance level at 1852.45, 127.2% Fibonacci extension. Technical indicators MACD is signalling a reversal of trend as well.
Areas of consideration:
- Daily support at 1776.55
- 4h support at 1801.75
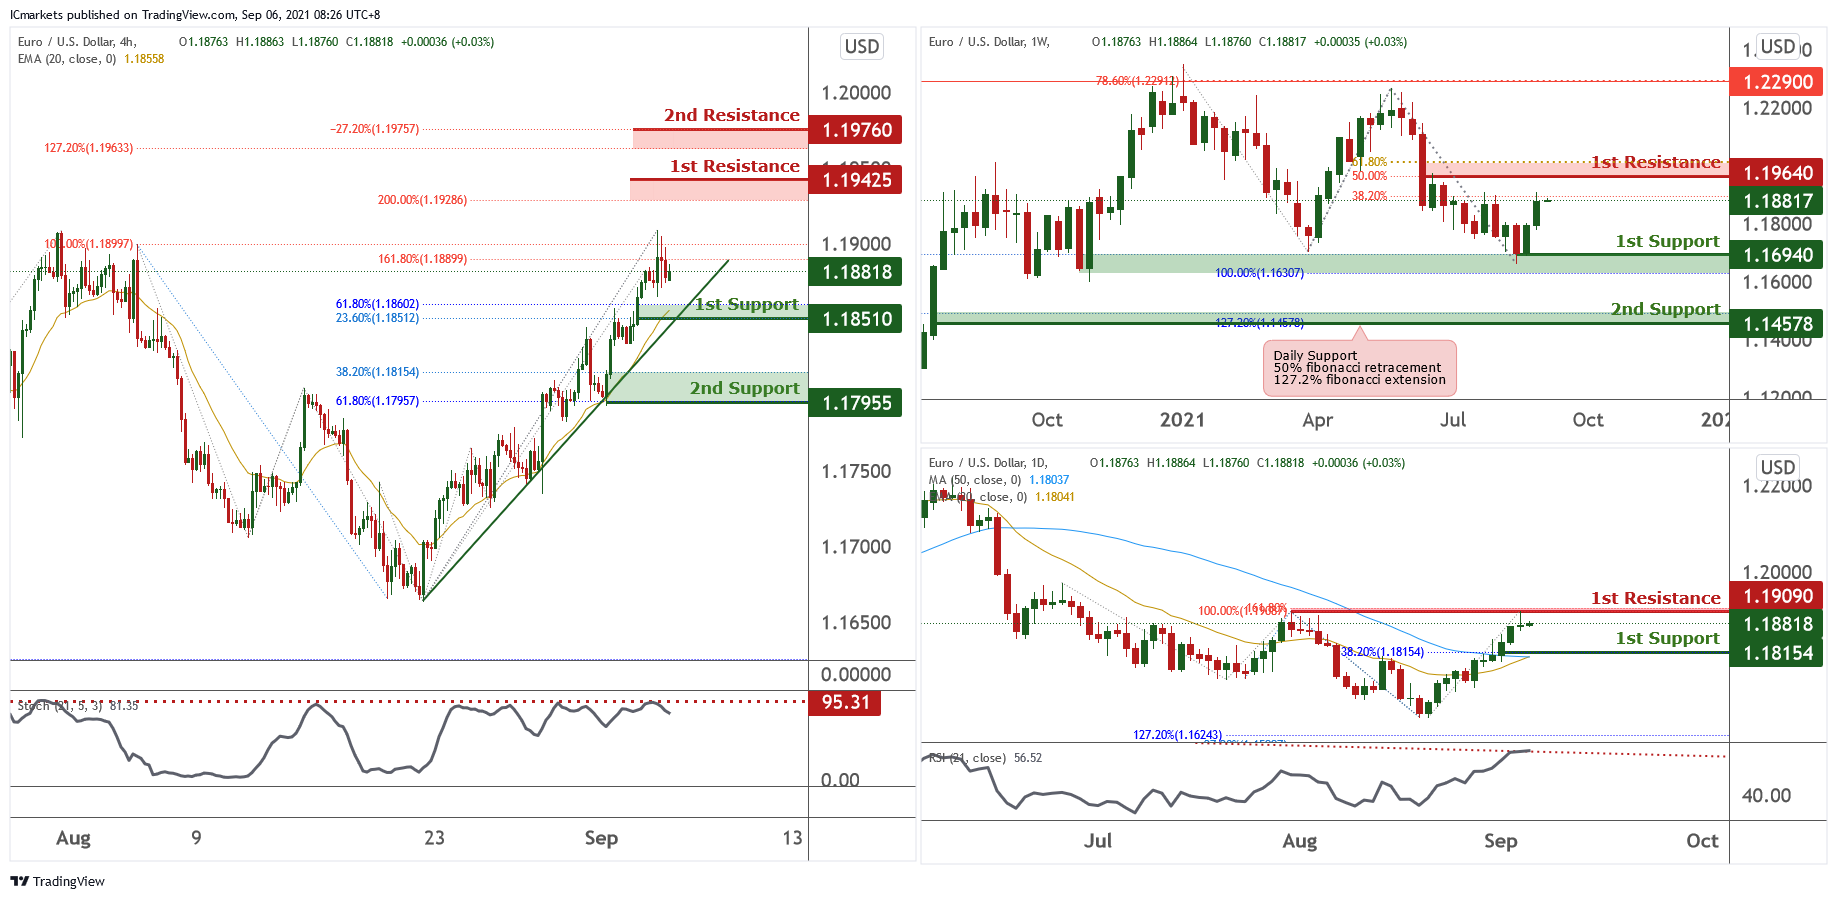
EUR/USD:
Looking at the weekly chart we can see that the price swung towards resistance at 1.19640, in-line with 50% Fibonacci retracement and 61.8% Fibonacci extension. On the Daily chart, price faced bearish pressure from resistance at 1.19090 and pull-back, in-line with 100% Fibonacci retracement and 161.8% Fibonacci extension. We could potentially see price pull-back to support at 1.18154, in-line with 38.2% Fibonacci retracement, 20EMA and 50MA. RSI is also at descending trendline resistance for pull-back
On the H4 timeframe prices swung towards resistance at 1.19000, in-line with 100% Fibonacci retracement and 200% Fibonacci extension. Price could potentially pull-back to test first support at 1.18510, in-line with 23.6% Fibonacci retracement , 61.8% Fibonacci extension and 20EMA. Stochastic is also at resistance level where previous drops occurred. The next potential support could be at 1.17955, in-line with 38.2% Fibonacci retracement and 61.8% Fibonacci extension.
If price bounces higher, it could potentially swing towards first resistance at 1.19425, in-line with -27.2% Fibonacci retracement and 200% Fibonacci extension. The next potential resistance could be at 1.19760, in-line with -27.2% Fibonacci retracement and 127.2% Fibonacci extension.
Areas of consideration:
- H4 time frame, support level at 1.18510 and 1.17955
- H4 time frame, resistance level at 1.19425 and 1.19760
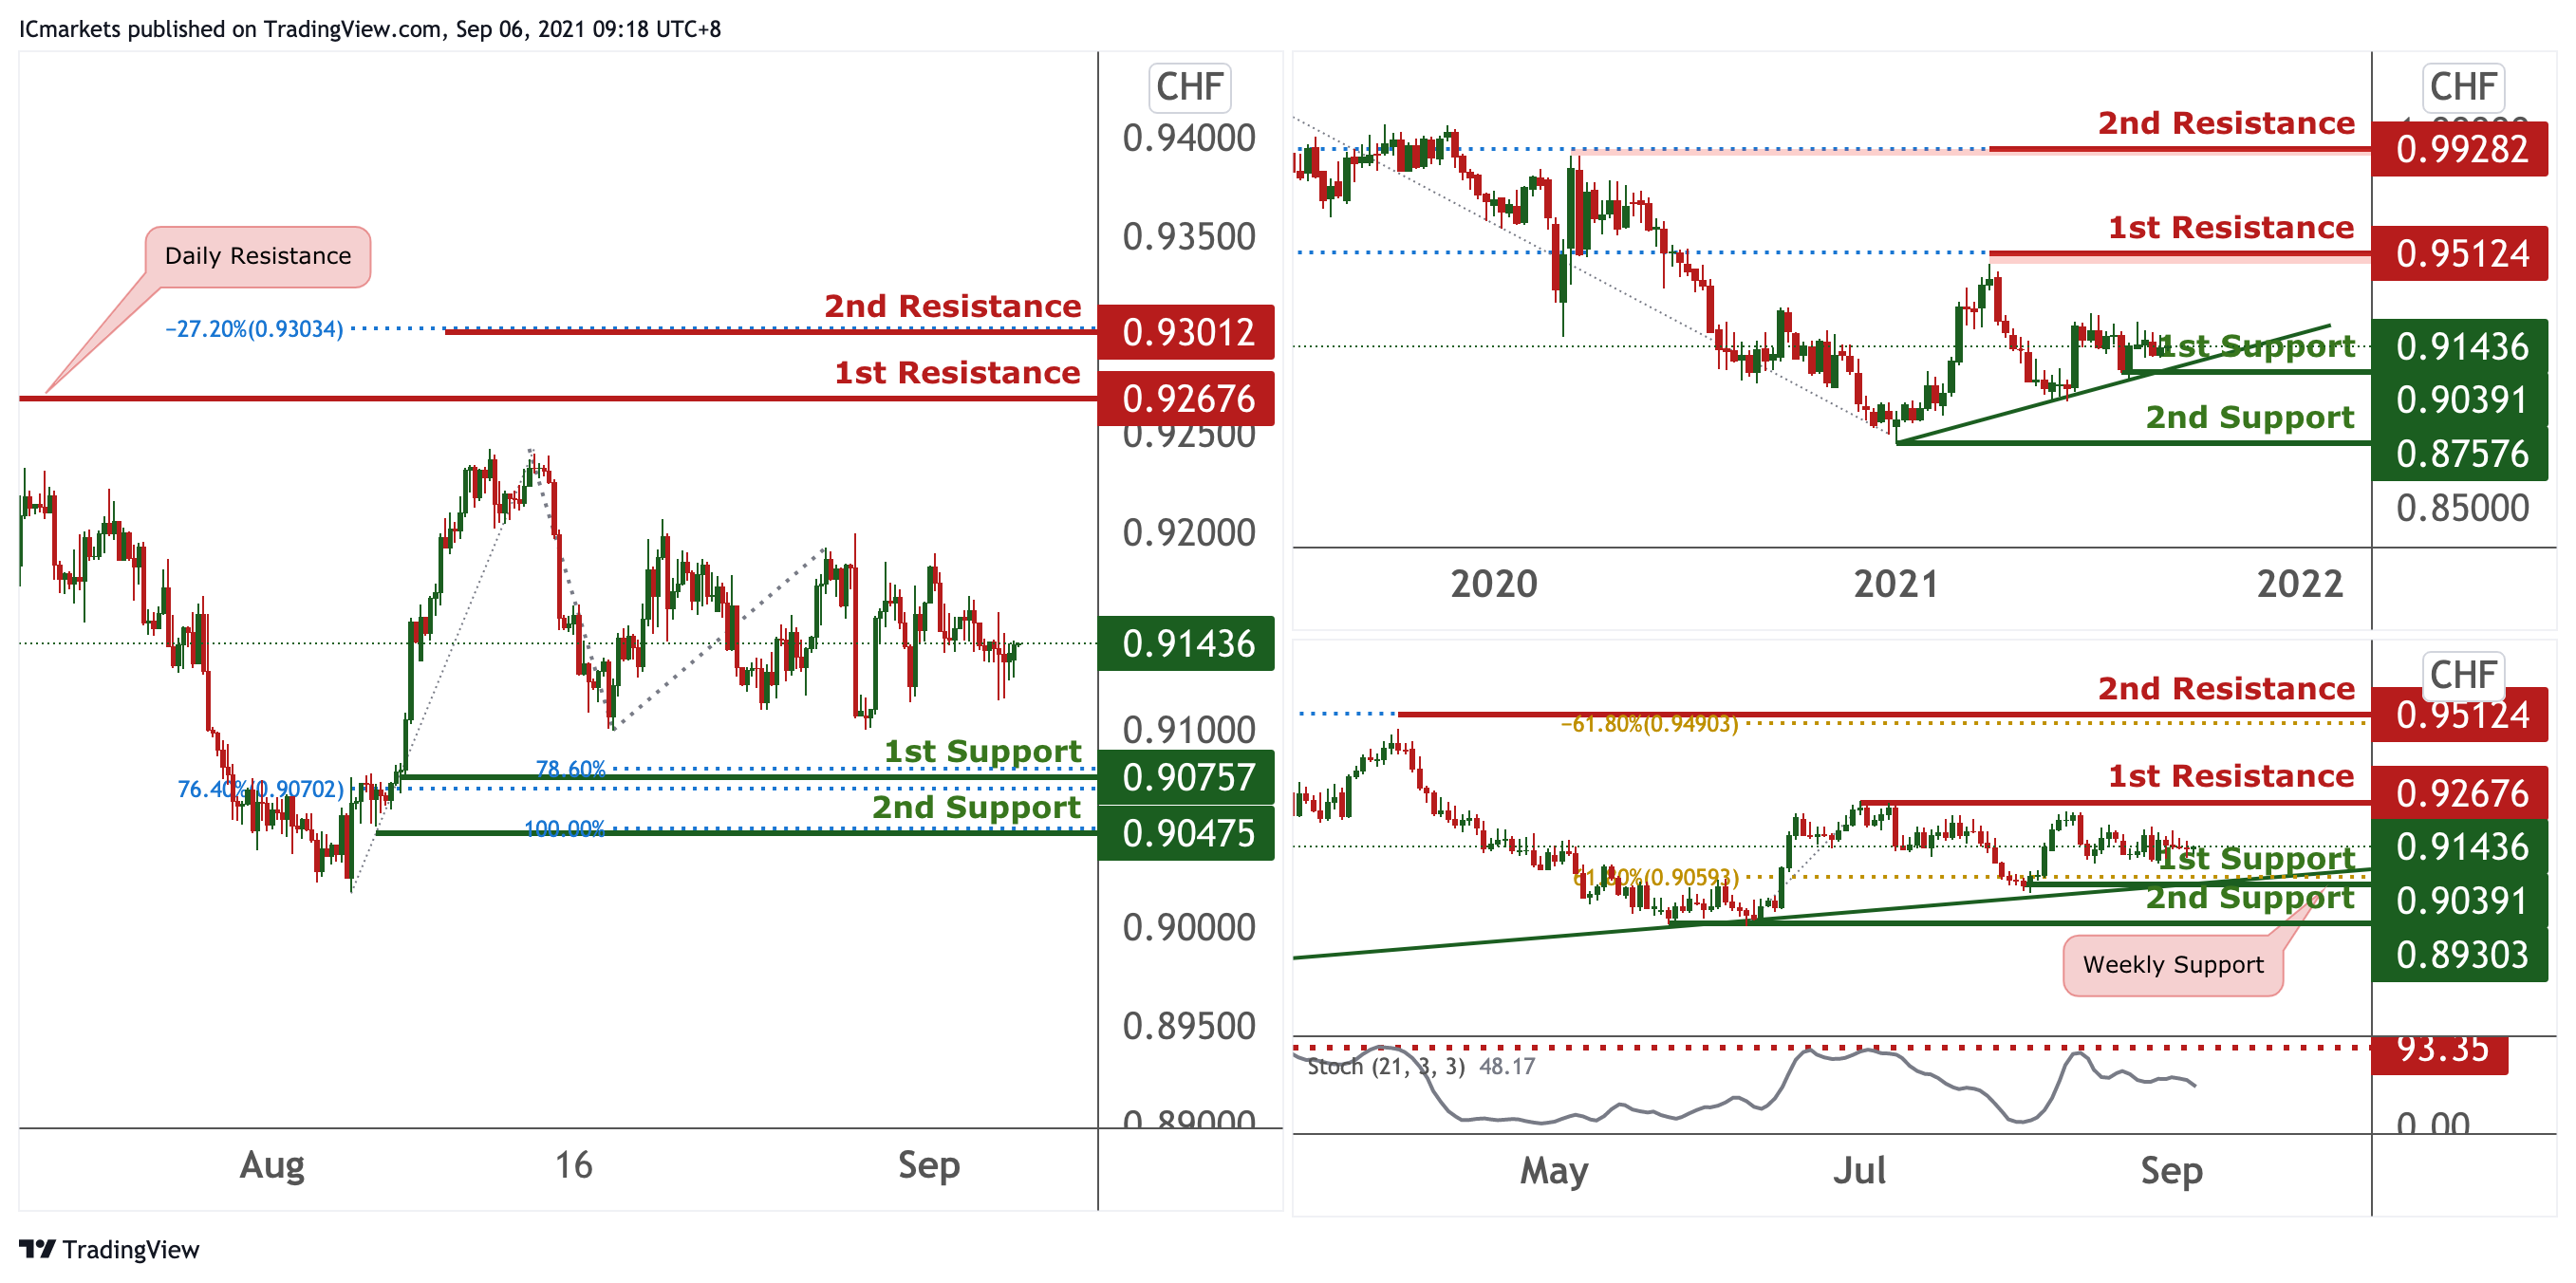
USD/CHF:
On the weekly, price is holding above ascending trendline support and also between 1st resistance at 0.95124 and 1st support at 0.90391. Traders should watch these levels closely for a break to see prices swing higher or drop lower. On the Daily, the price did not reach a graphical swing high. It is seen to have a bearish movement towards the 1st support at 0.90391. With stochastics testing resistance where price dropped in the past, we see a possibility that sellers could enter and push price towards the 1st support at 0.90391
On the H4, price is seen to be reacting in between 1st Resistance at 0.92676 and 1st Support at 0.90757 showing a consistent consolidation of the prices. Our bias for now would be to neutral as the indicators are showing mixed signals.
Areas of consideration:
- Watch 1st resistance at 0.92676
- Watch 1st support at 0.90757
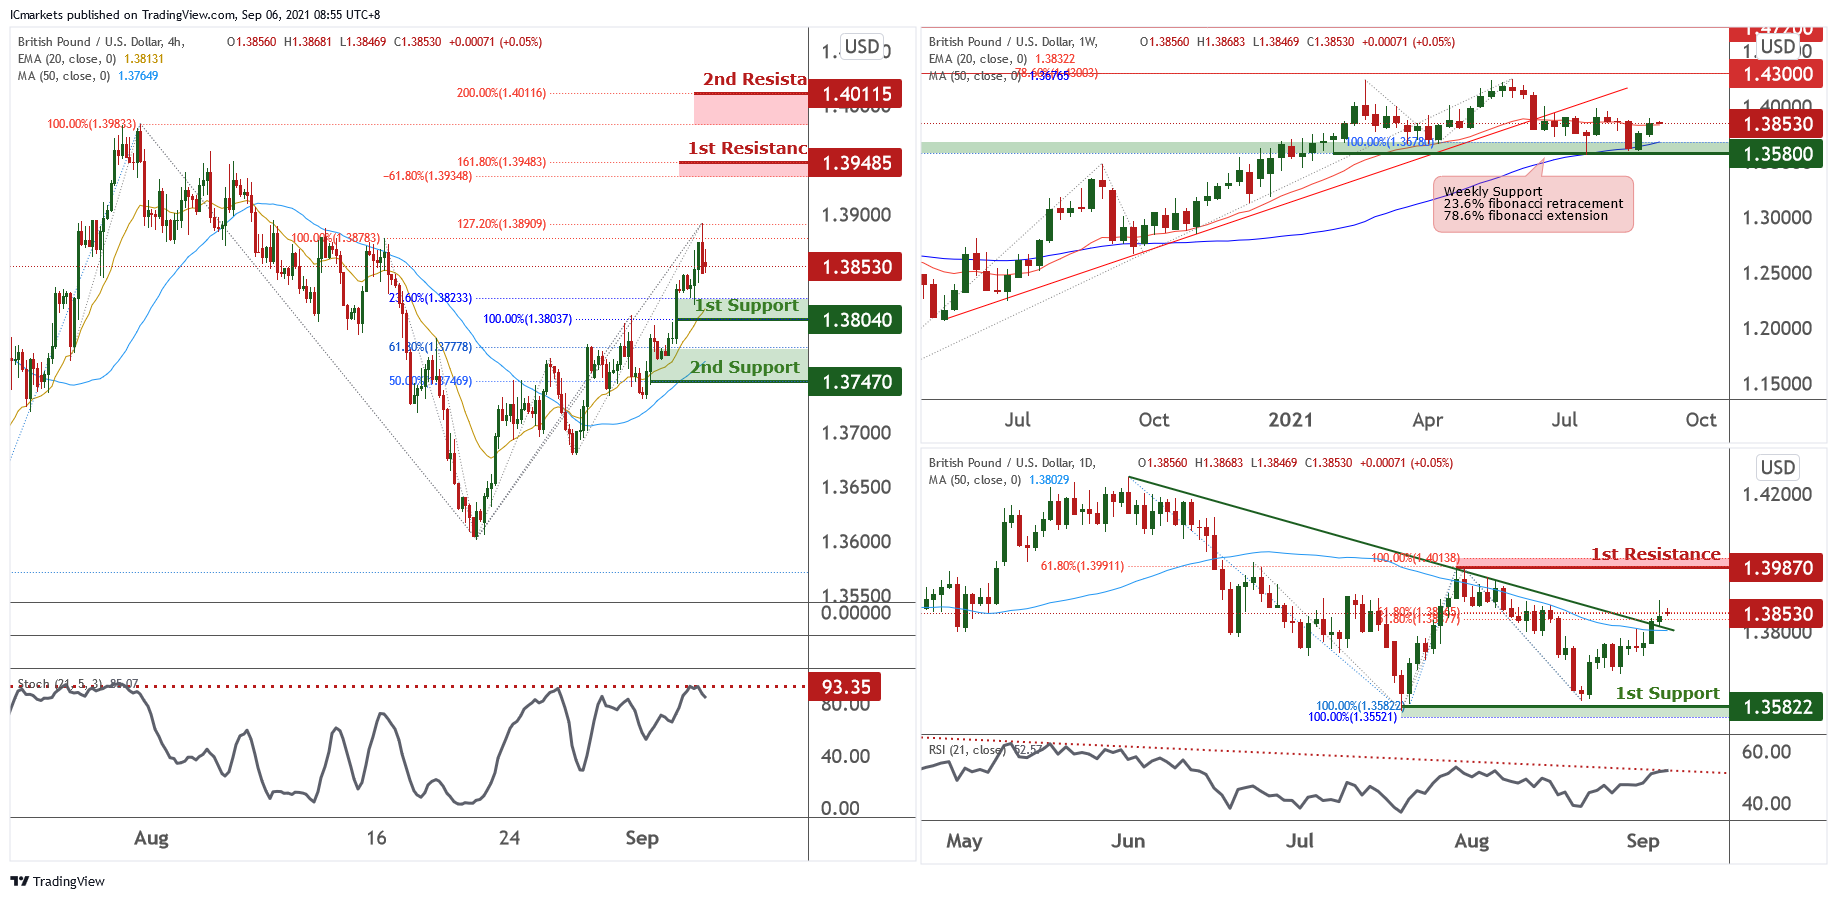
GBP/USD:
Looking at the weekly chart, price rebounded from support at 1.35800, in-line with 23.6% Fibonacci retracement, 78.6% Fibonacci extension and 50MA. On the Daily time frame price swung towards first resistance at 1.38545 and dropped, in-line with 61.8% Fibonacci retracement and 61.8% Fibonacci extension. Price may pull-back to retest the breakout descending trendline. RSI is also coming into descending trendline resistance where pull-back could occur.
On the H4 timeframe, prices swung towards resistance at 1.38780, in-line with 100% Fibonacci retracement and 127.2% Fibonacci extension. Price could potentially pull-back to first support at 1.38040, in-line with 23.6% Fibonacci retracement , 100% Fibonacci extension and 20EMA. Stochastic is also at horizontal resistance level where previous drops occurred. The next potential support could be at 1.37470, in-line with 50% Fibonacci retracement , 61.8% Fibonacci extension and 50MA.
If price bounces higher, it could potentially swing towards first resistance at 1.39485, in-line with -61.8% Fibonacci retracement and 161.8% Fibonacci extension. The next potential resistance could be at 1.40115, in-line with 100% Fibonacci retracement and 200% Fibonacci extension.
Areas of consideration:
- H4 time frame, 38040 and 1.37470 support level
- H4 time frame, 1.39485 and 1.40115 resistance level
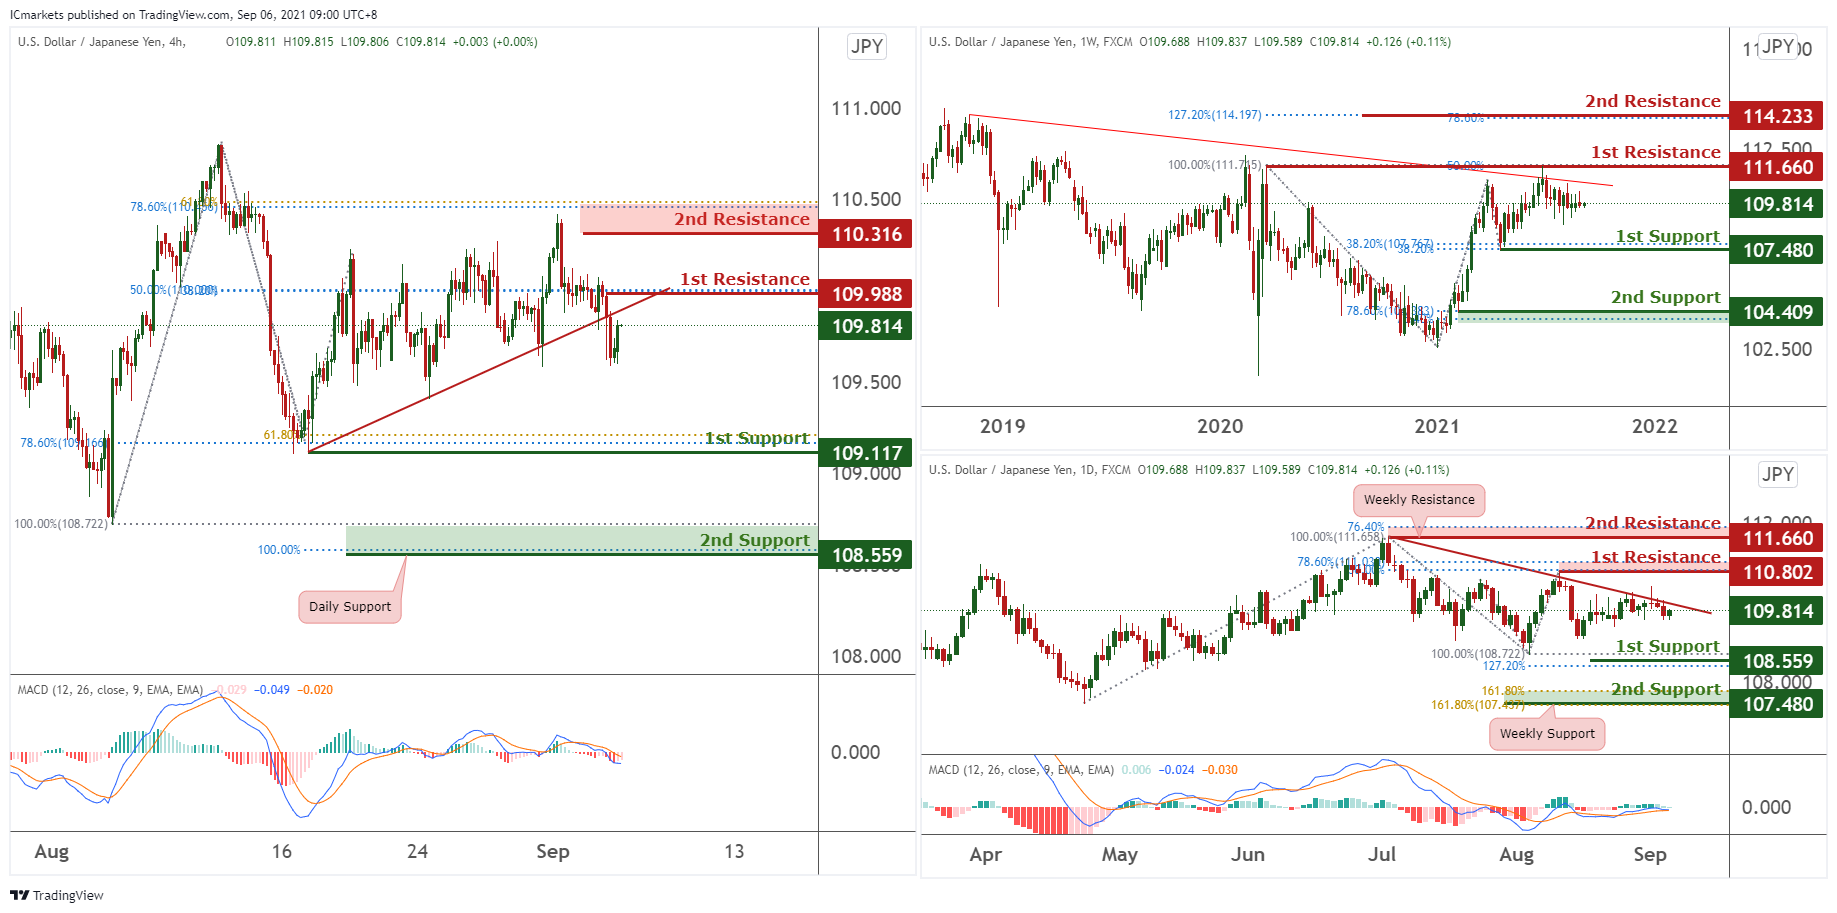
USD/JPY
From the weekly timeframe, price is below the descending trendline resistance, and may bearish to 1st support 107.480 in line with 38.2% Fibonacci retracement and 38.2% Fibonacci extension. Otherwise, price might move towards the 1st resistance at 111.660 in line with Horizontal Swing High and 50% Fibonacci extension.
On the Daily timeframe, price is below the descending trendline resistance and may bearish to 1st support at 108.559 in line with Horizontal Swing Low and 127.2% Fibonacci extension. Our bearish view is further supported by how MACD is holding below the 0 line. Otherwise, price might move towards the 1st resistance at 110.802 in line with 78.6% Fibonacci retracement and 50% Fibonacci extension.
On the H4 timeframe, price broke through the ascending threadline support (now resistance) and is below the 1st resistance at 109.988 in line with 50% Fibonacci retracement and 38.2% Fibonacci extension and may bearish to the 1st support at 109.117 in line with 78.6% Fibonacci retracement and 61.8% Fibonacci extension. Our bearish view is further supported by how MACD is holding below the 0 line. Otherwise, price may bullish towards the 2nd resistance at 110.316 in line with 78.6% Fibonacci retracement and 61.8% Fibonacci extension.
Areas of consideration:
- H4 time frame, 2nd resistance of 110.316
- H4 time frame, 1st support of 109.117
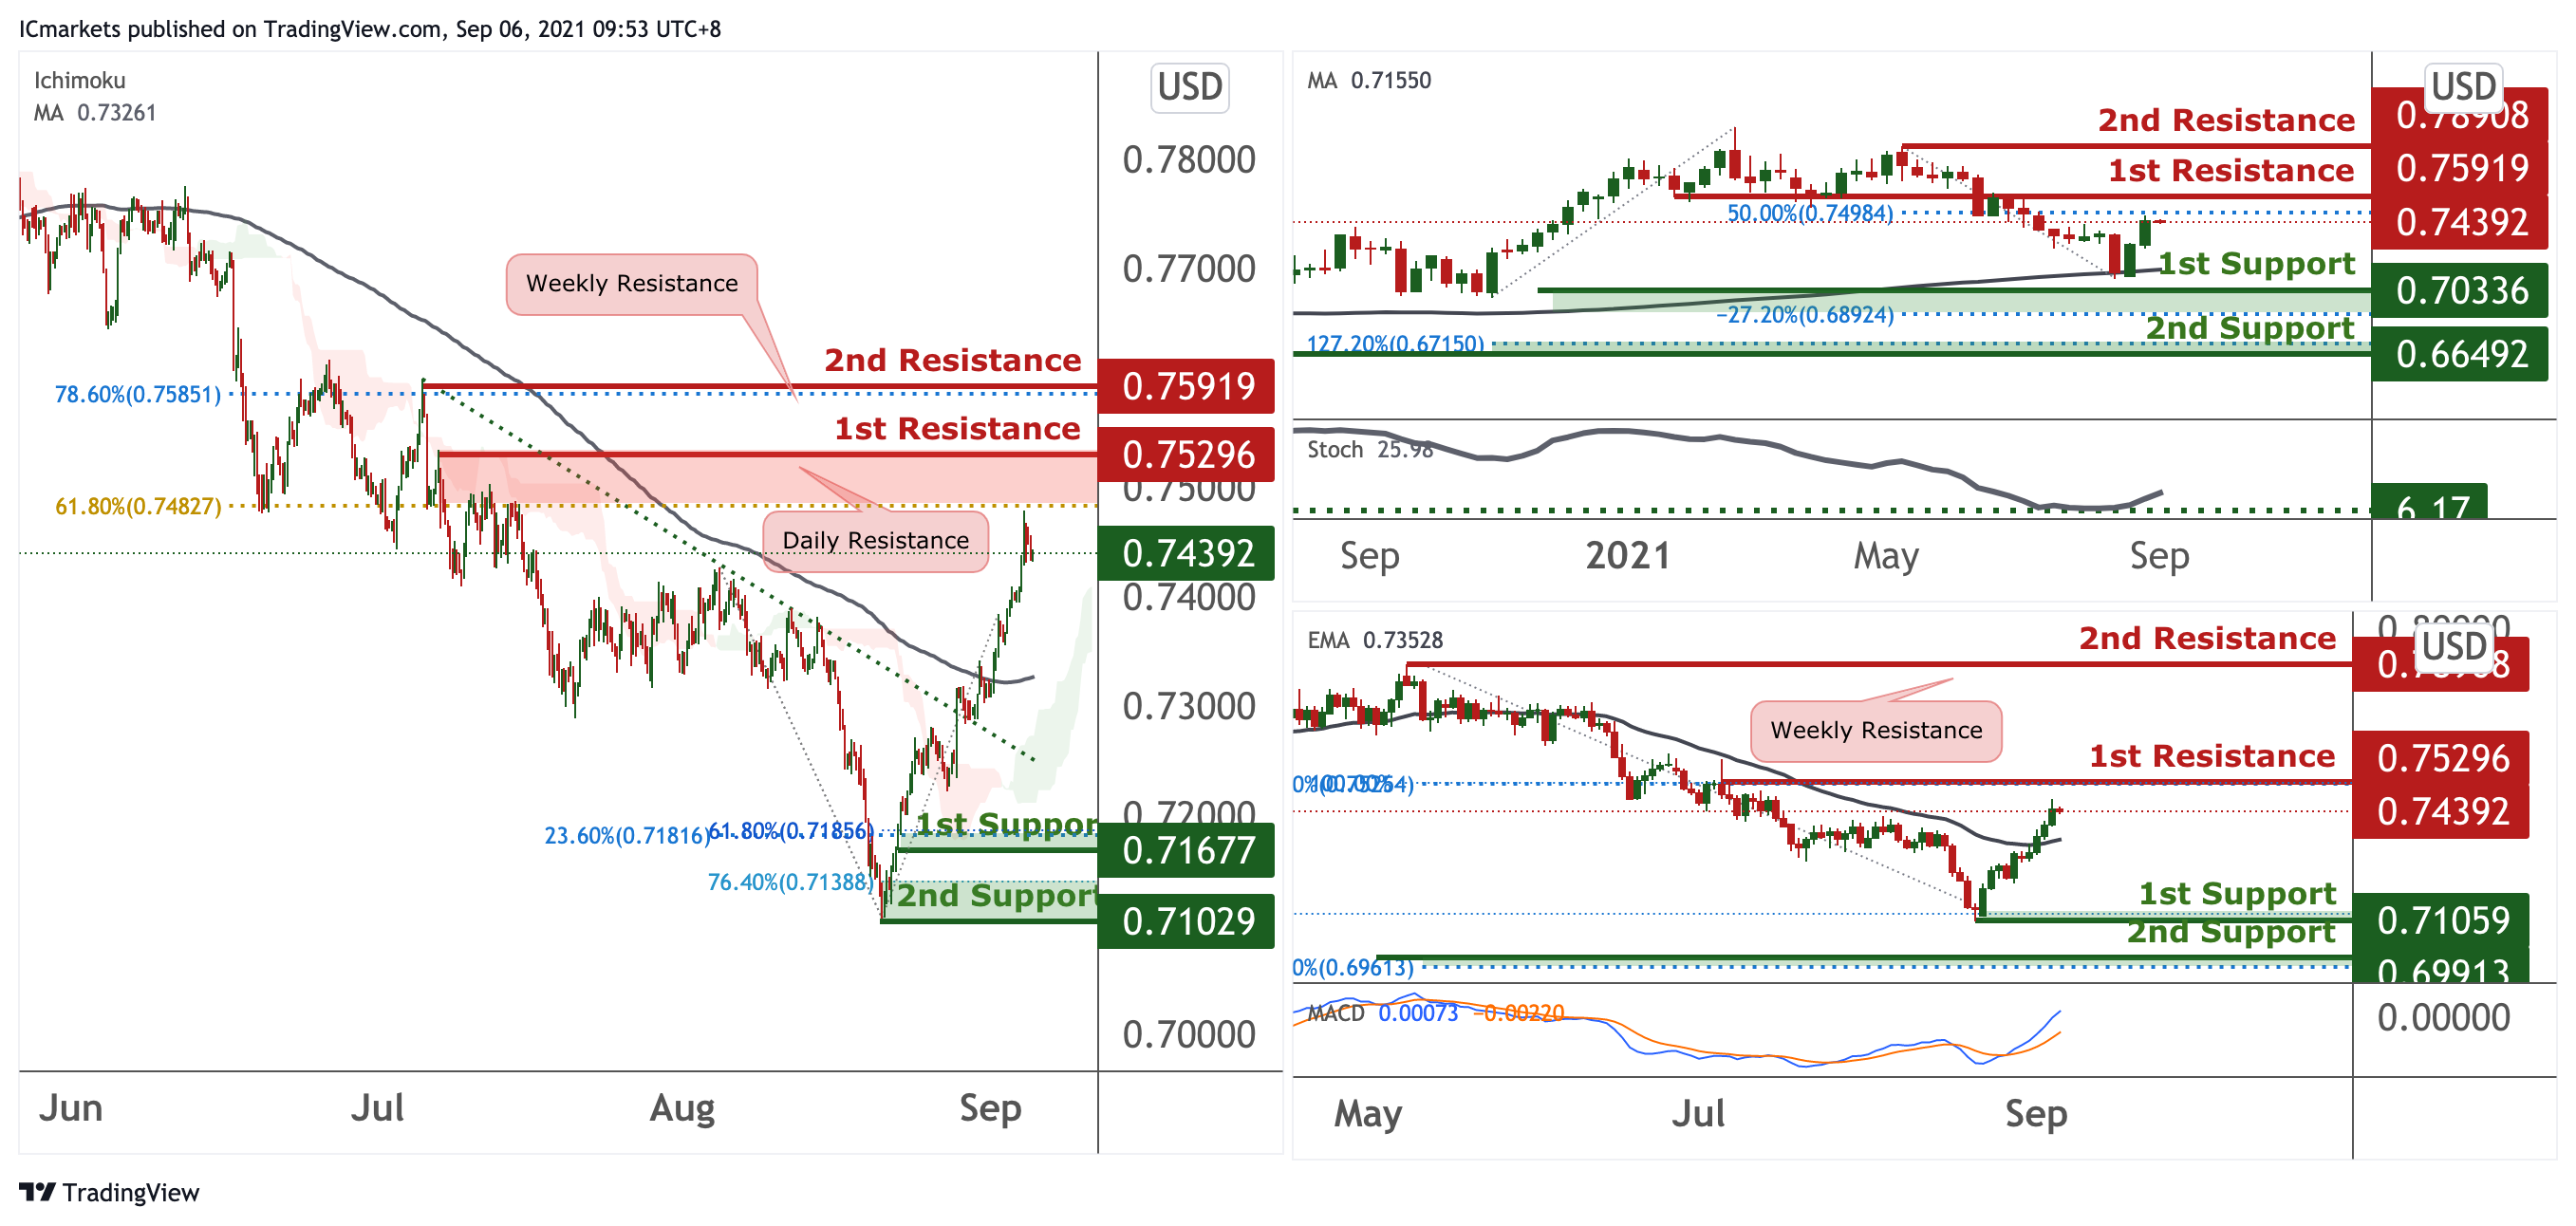
AUD/USD:
On the weekly, price is holding above the MA 100 showing bullish momentum, price is expected to put towards the first resistance in line with the 50% Fibonacci retracement level. Our bullish bias is further supported by the Stochastic indicator, where the K% line bounced off the support level. On the Daily, the price is holding below EMA 34 showing a potential bearish momentum, however price bounced off from the first support towards the first resistance 0.74224 in line with the 61.8% Fibonacci extension and 38.2% Fibonacci retracement. Our potential short term bullish bias is further supported with the RSI indicator that broke the strong support level and bouncing back up.
On the H4, price is seen to have broken off the descending trendline resistance turned support and price is holding above the 200 Period MA. Price is expected to push to the new 1st Resistance level in line with 61.8% Fibonacci Retracement. Our bias for the H4 chart in the short term would be bullish as the Ichimoku cloud indicator shows that the price is holding above it.
Areas of consideration:
- H4 1st resistance level 0.75296
- H4 1st support level 0.71677
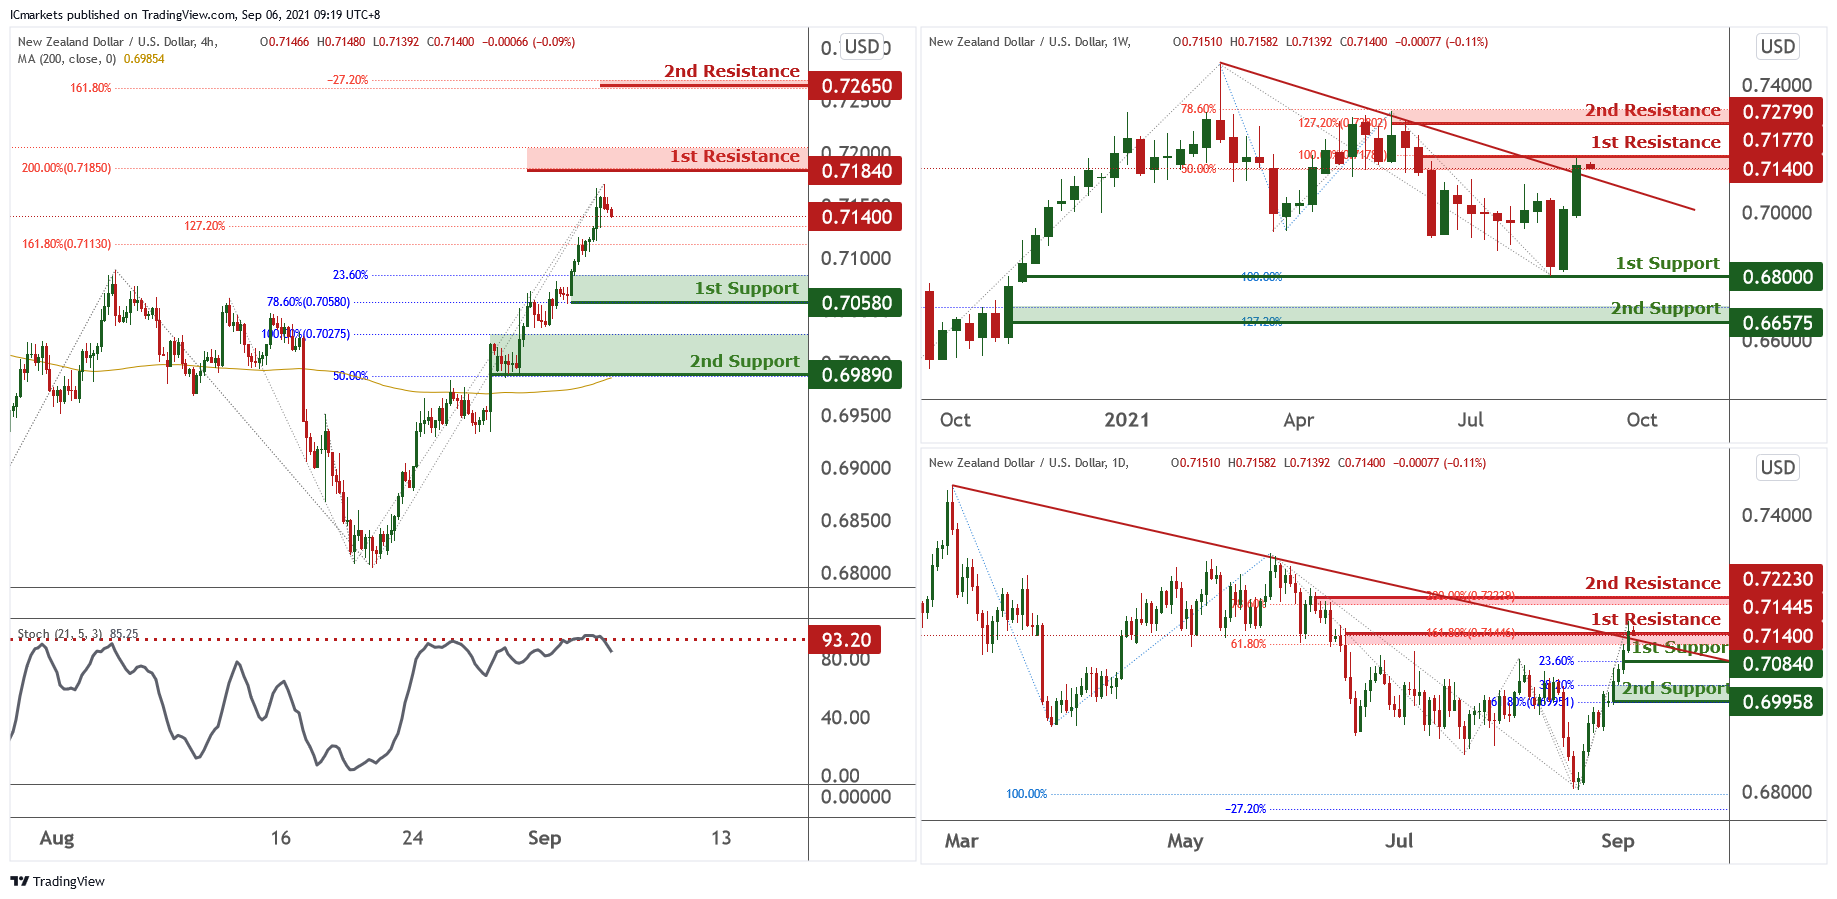
NZD/USD:
Looking at the weekly chart we could see that price is facing resistance at 0.71770, in-line with 50% Fibonacci retracement, 100% Fibonacci extension and descending trendline resistance. On the Daily chart, price swung above resistance at 0.71445, in-line with 61.8% Fibonacci retracement, 161.8% Fibonacci extension. We could potentially see the price pull-back to first support at 0.70460, in-line with 23.6% Fibonacci retracement before any further upside.
On the H4 timeframe, prices swung above previous resistance at 0.71300, in-line with 127.2% Fibonacci retracement and 161.8% Fibonacci extension. Price could potentially pull-back to first support at 0.70580, in-line with 23.6% Fibonacci retracement and 78.6% Fibonacci extension. Stochastic is also at horizontal resistance level where previous drops occurred. The next potential support could be at 0.69890, in-line with 50% Fibonacci retracement, 100% Fibonacci extension and 200MA.
If the price bounces higher, it could potentially swing towards first resistance at 0.71840, in-line with -61.8% Fibonacci retracement and 200% Fibonacci extension. The next potential resistance could be at 0.72650, in-line with -27.2% and 161.8% Fibonacci retracement.
Areas of consideration:
- H4 time frame, support level at 0.70580 and 69890
- H4 time frame, resistance level at 71840 and 0.72650
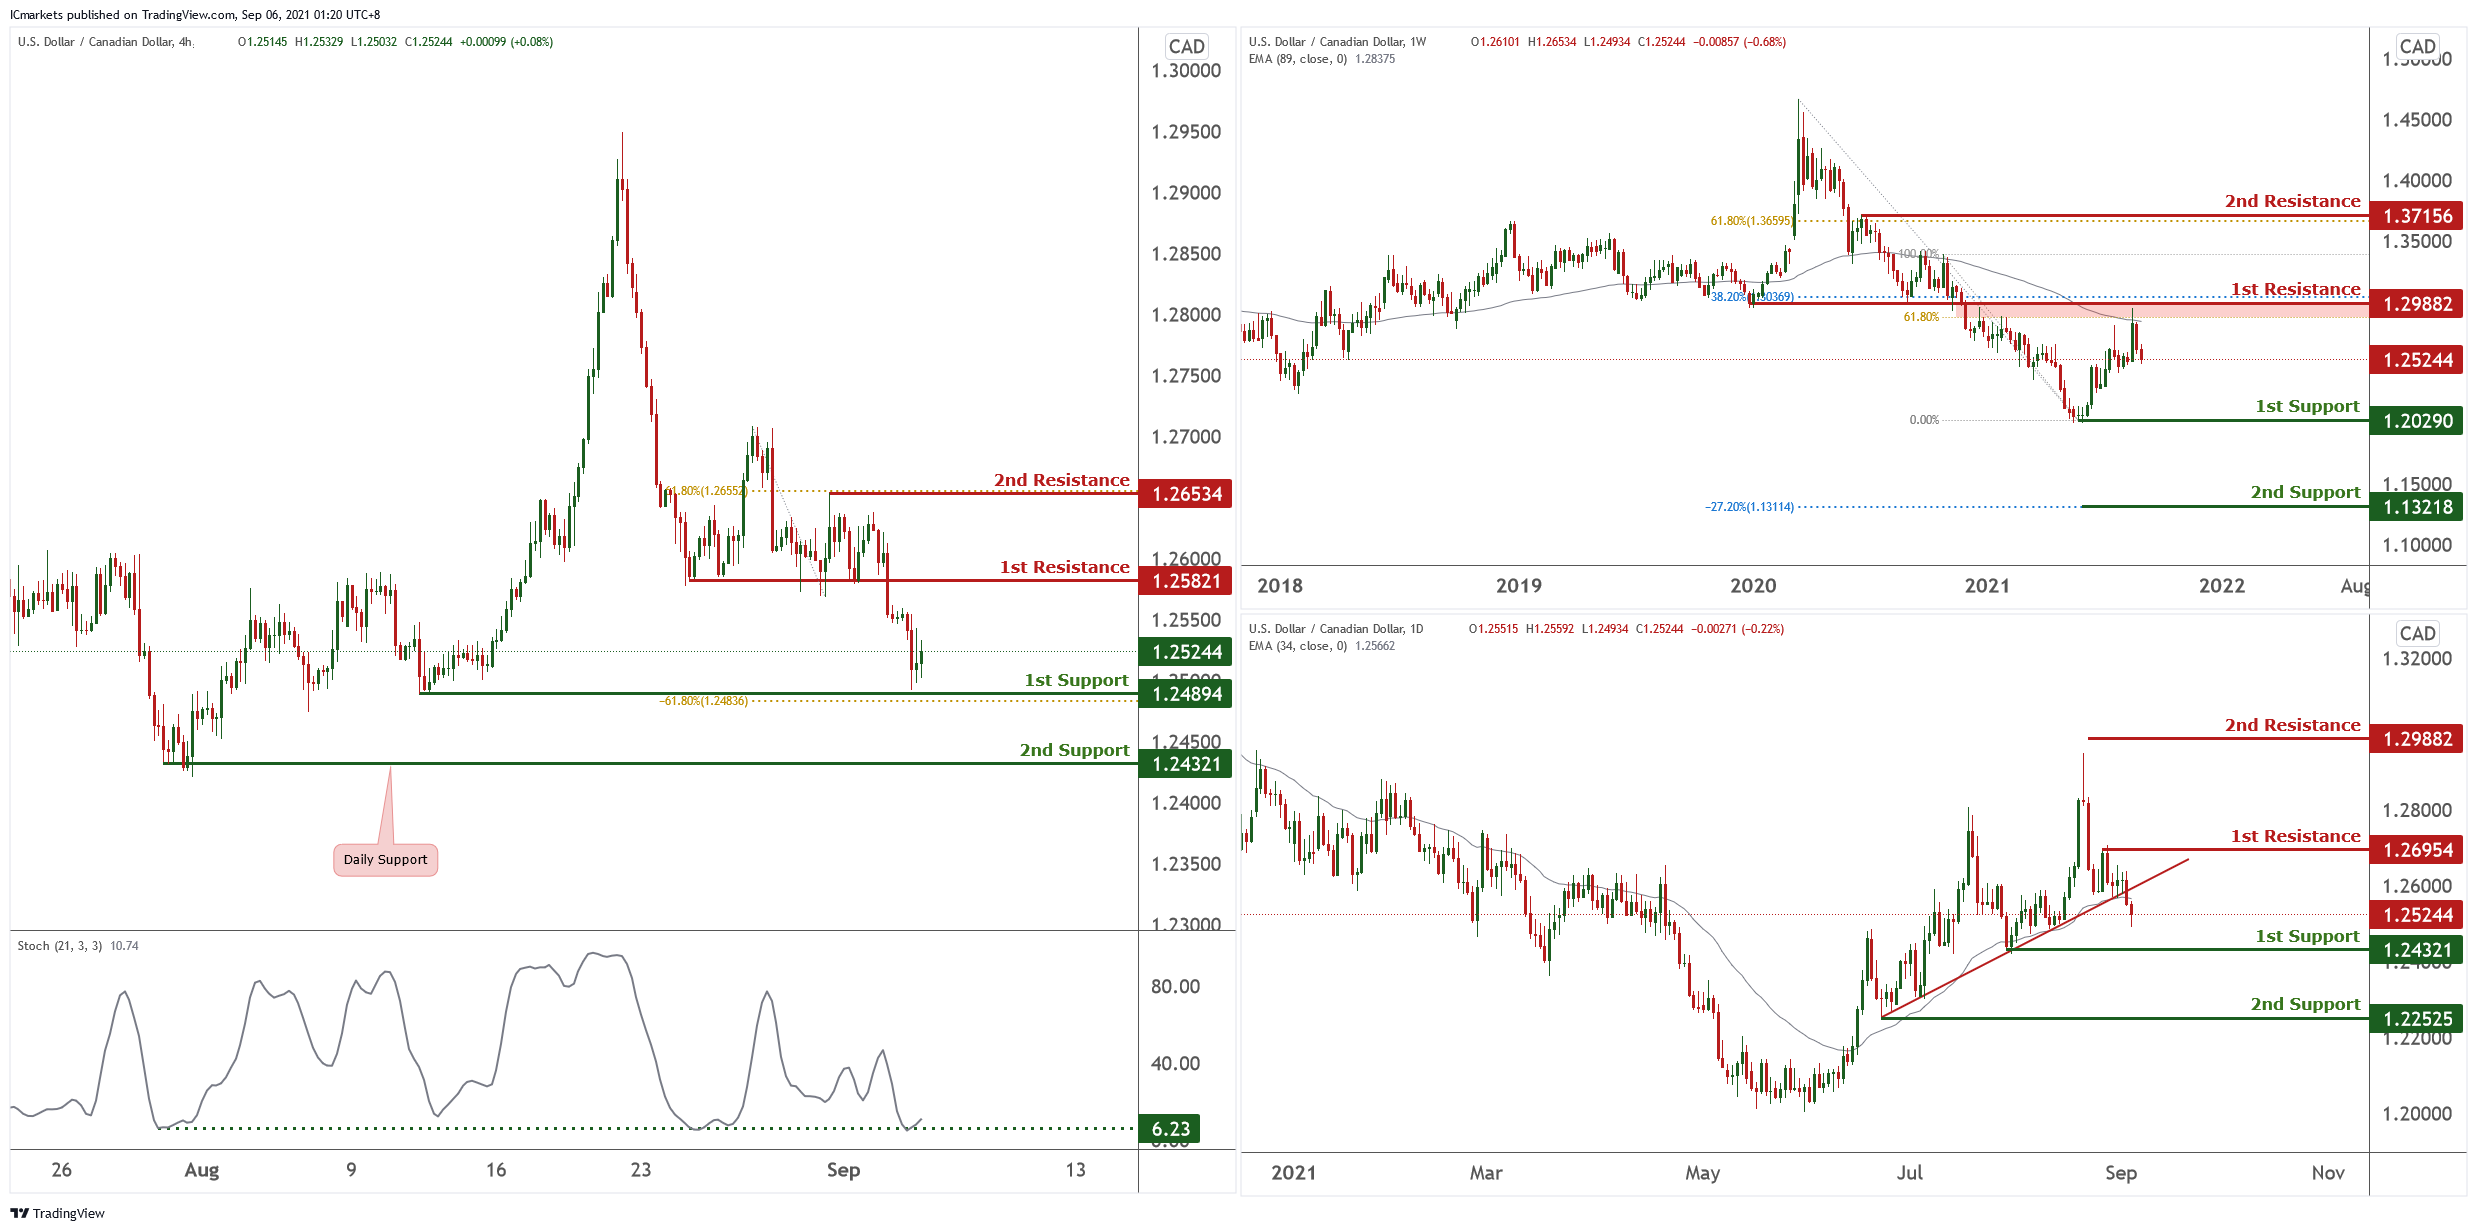
USD/CAD:
On the Weekly timeframe, price tested and reacted below long term moving average and also both 38.2% and 61.8% Fibonacci retracement level at 1.29882. As long as the price is holding below this level, we could potentially see the price facing further bearish pressure in the long term. On the Daily price broke below ascending trendline support (now resistance). With price also holding below moving average, further possible downside towards 1st support at 1.24321 could be possible. Otherwise, price may pullback and come back to test 1st resistance at 1.26954.
On the H4, price approaching strong support at 1.24894. With stochastics testing support where price bounced in the past, we could see a medium probability bullish scenario for a bounce towards graphical overlap resistance and 1st resistance at 1.25821. Otherwise, breaking below 1st support we could see a further drop towards 2nd support at 1.24321.
Areas of consideration:
- H4 time frame, support at 1.24894
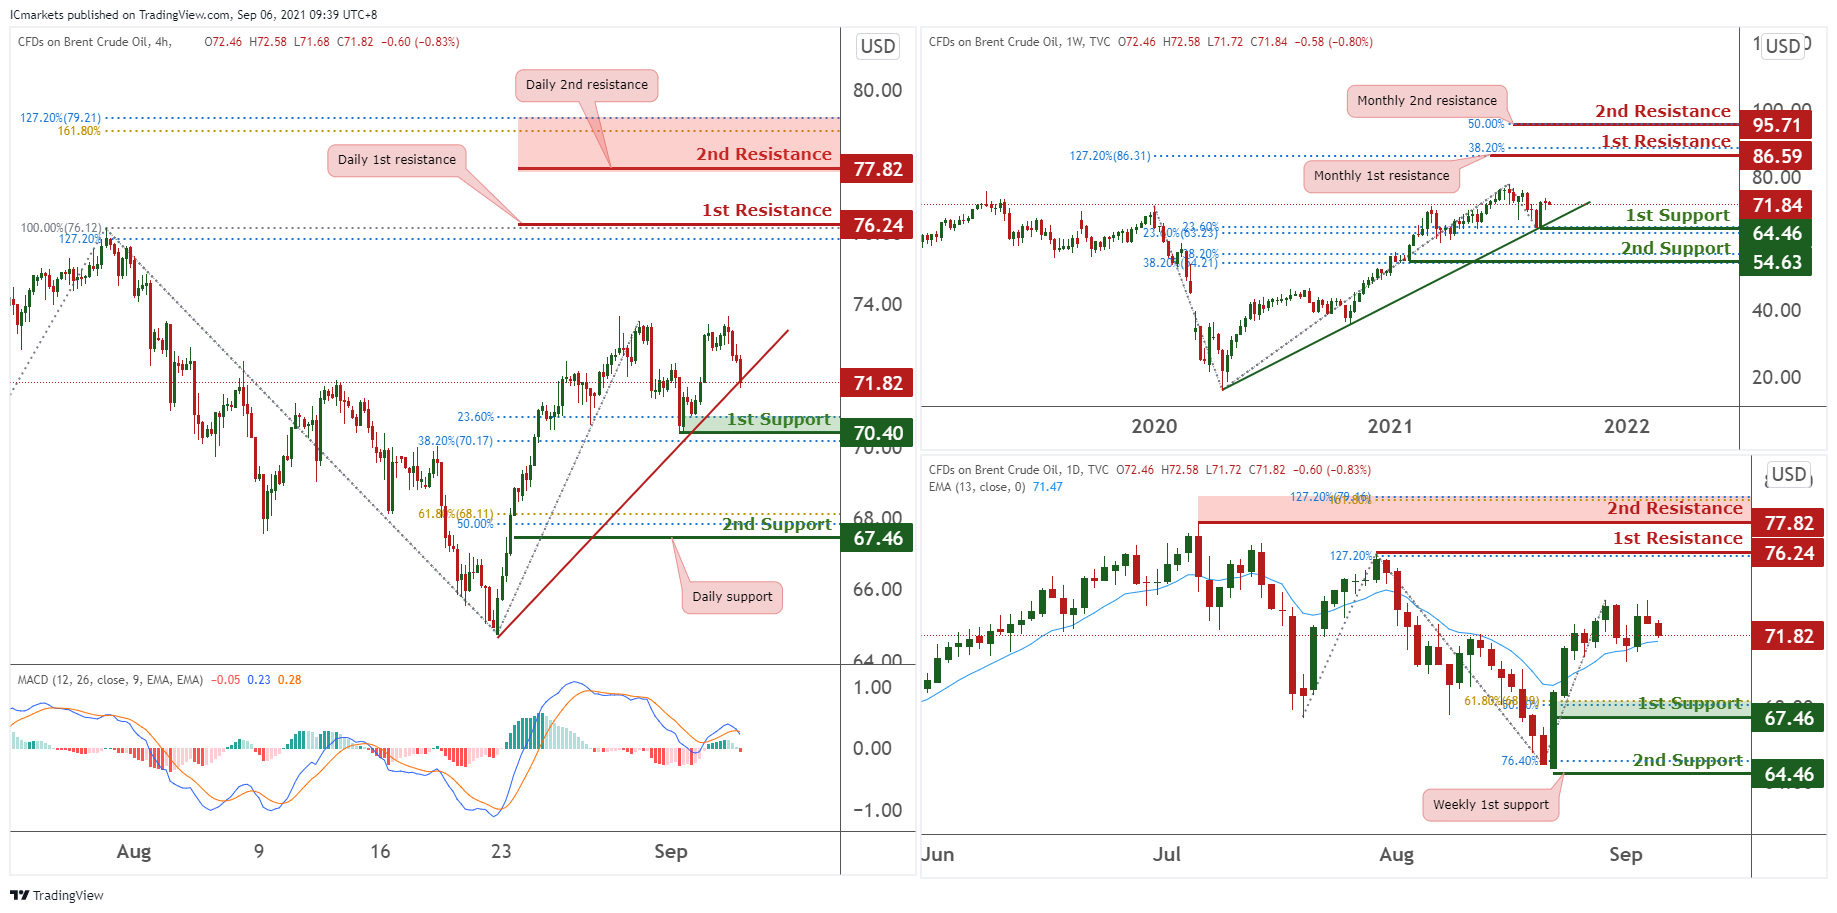
OIL:
On Weekly timeframe, we can see price is above the ascending trendline support and may bullish to first resistance at 86.59 in line with 38.2% Fibonacci retracement and 127.2% Fibonacci extension. However, if price breaks below the ascending trendline line support, price may brearish towards the 1st support at 64.46 in line with 23.6% fibonacci retracement and 23.6% fibonacci extension.
On the Daily timeframe, price is above the first support at 67.46 in line with 61.8% Fibonacci retracement and 50% fibonacci extension and price may bullish towards first resistance at 76.24 in line with horizontal swing high and 127.2% fibonacci extension. Our bullish view is further supported by how price is holding above the EMA. Otherwise price may bearish towards the first support at 67.46 in line with 61.8% Fibonacci retracement and 50% fibonacci extension.
Lastly, on the H4 timeframe, price is retesting the ascending trendline support and may bullish towards the first resistance at 76.24 in line with horizontal swing high and 127.2% Fibonacci extension. Our bullish view is further supported by how MACD is shown to be holding above the 0 line. Otherwise price may bearish towards the first support at 70.4 in line with 38.2% Fibonacci retracement and 23.6% Fibonacci extension.
Areas of consideration:
- H4 time frame, 1st resistance of 76.24
- H4 time frame, 1st support of 70.4
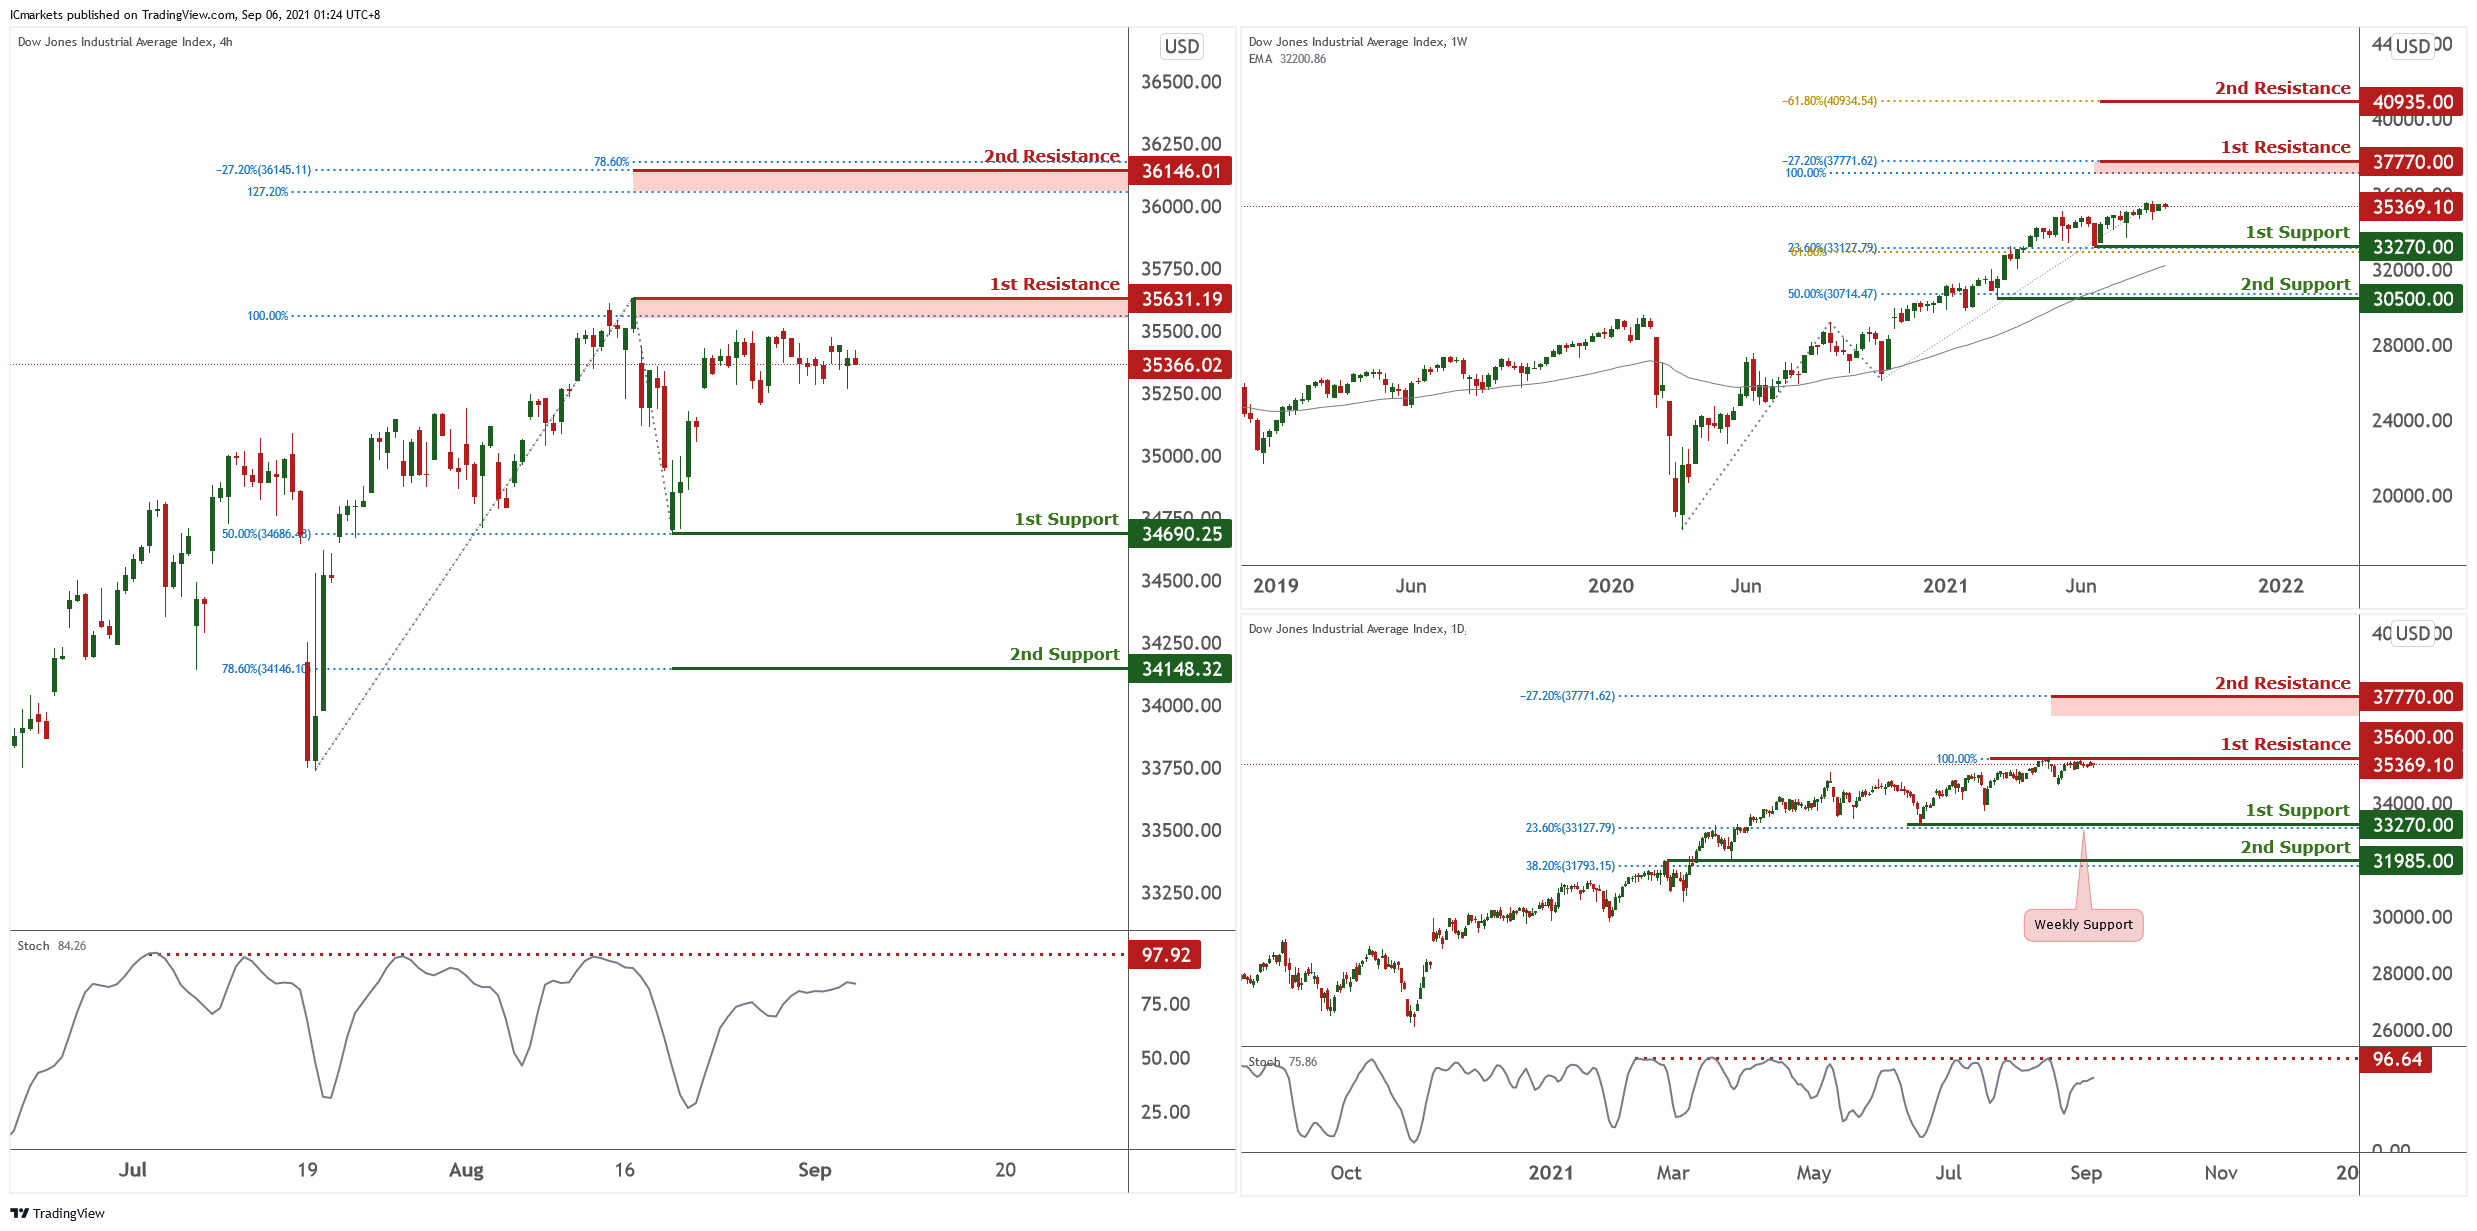
Dow Jones Industrial Average:
On the weekly chart, price is trading sideways holding between 33270 support and 38119.37 resistance. With price holding above long term moving average, we see a possibility of price facing further bullish pressure.
On the Daily chart, price is still testing and capped below resistance at 36021. With stochastic still holding below resistance where price dropped in the past, we see price facing possible bearish pressure.
On the H4, price traded sideways last Friday, but still holding below 1st resistance at 35631. We still see a low probability bearish scenario where sellers may further add to their shorts to push price lower towards our 1st support at 34690. Otherwise a break above our 1st resistance will see price swing higher towards next resistance at 36146. Stochastic is testing resistance where price pulled back lower in the past as well.
Areas of consideration:
- 35631 resistance level on the H4 timeframe
- Stochastics testing resistance on Daily and H4
The accuracy, completeness and timeliness of the information contained on this site cannot be guaranteed. IC Markets does not warranty, guarantee or make any representations, or assume any liability regarding financial results based on the use of the information in the site.
News, views, opinions, recommendations and other information obtained from sources outside of www.icmarkets.com.au, used in this site are believed to be reliable, but we cannot guarantee their accuracy or completeness. All such information is subject to change at any time without notice. IC Markets assumes no responsibility for the content of any linked site.
The fact that such links may exist does not indicate approval or endorsement of any material contained on any linked site. IC Markets is not liable for any harm caused by the transmission, through accessing the services or information on this site, of a computer virus, or other computer code or programming device that might be used to access, delete, damage, disable, disrupt or otherwise impede in any manner, the operation of the site or of any user’s software, hardware, data or property.


