Updated February 2020
Finding it a challenge to pin down a profitable strategy?
It may be time to consider exploring the wonderful world of harmonics.
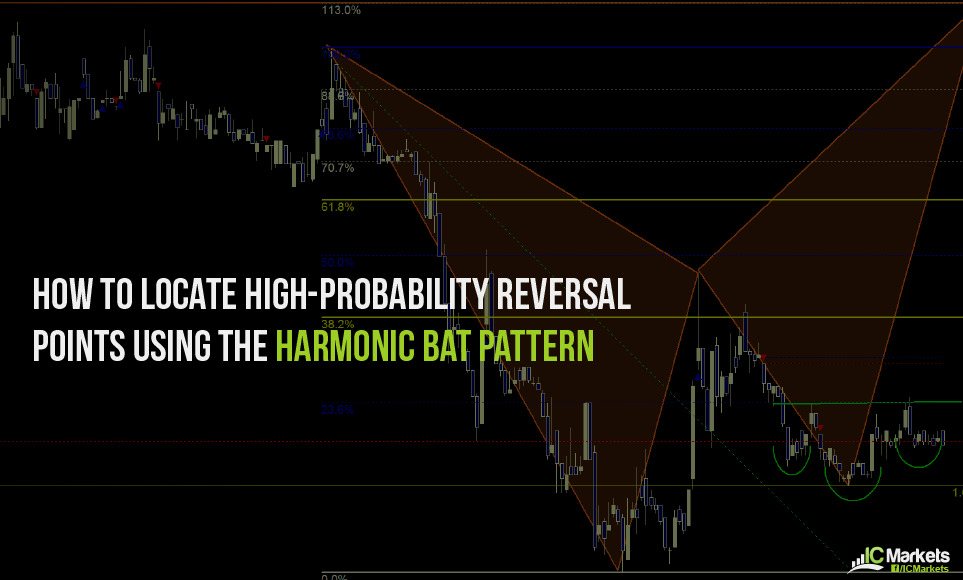
Enter the Harmonic Bat Pattern
Developed by Scott Carney, the harmonic bat pattern, a variation of the Gartley harmonic pattern, is a 5-point retracement structure composed of Fibonacci measurements used to create a potential reversal zone, or PRZ. According to Carney, the Harmonic Bat Pattern is one of the more accurate configurations in the harmonic family, exhibiting a high success rate.
However, without specifying money management rules, instruments traded, tested period, trading experience and applied confirmation methods, the success percentage carries little weight. Your trading success is dependent on how YOU trade your chosen method. Remember, this business is NOT just technically involved; it has a demanding psychological aspect to it.
Breaking Down the Harmonic Bat Pattern
Given this pattern houses several measurements, it is best to take it one step at a time when applying the arrangement on your charts.
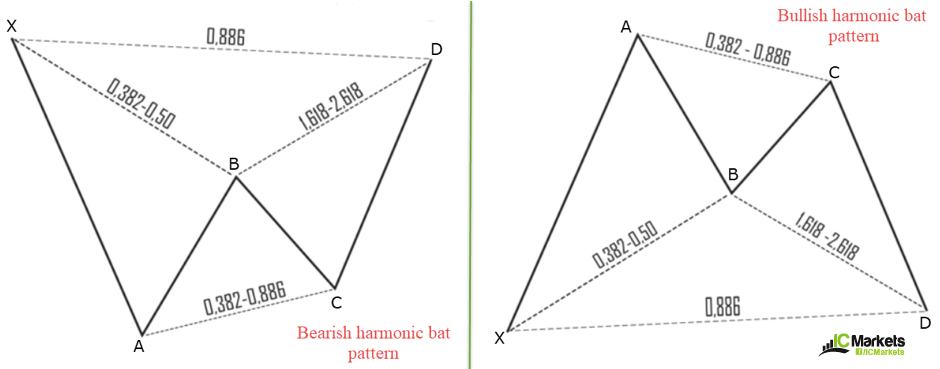
- Locate the impulse leg. This is a strong move in either direction. It can be a mixture of both bullish and bearish candles, but must be a defined move. The beginning of the impulse move is labelled as X and the tip of the move as A.
- Using the Fibonacci retracement tool, measure from the X leg to the A leg. The B point retracement MUST be less than a 0.618% retracement. Hitting this value steers more toward a potential Gartley pattern. Ultimately, a 0.50% or 0.382% retracement is preferable.
- Using the Fibonacci retracement tool again, measure from the A leg to the B leg. Like the Gartley formation, the termination point here is somewhat flexible. If price concludes movement between the 0.382%/0.886% retracement, the pattern is valid. This is your C leg.
- Here you’ll look for the final leg to form: D leg. This is where traders formulate a PRZ.
Important values to look for within the PRZ are as follows:
- It is common to see alternate AB=CD (127.2%/161.8% Fibonacci extensions) patterns form. Although the AB=CD pattern is a great set-up when each leg equals the other exactly, there are many situations where alternative Fibonacci calculations are required to clearly define the Potential Reversal Zone. Although there might be a clear pattern developing, it is not uncommon for the AB=CD to be unequal. These alternate projections should merely complement an area that possesses other harmonic numbers. (Scott Carney – originally outlined in The Harmonic Trader). This is essentially an AB=CD formation that typically extends beyond its symmetrical completion point.
- The XA retracement 0.886% is the defining limit. According to Carney, 0.886% is the most important value/level within the PRZ.
- The BC projection must be at least 1.618%. The most ideal BC projections fall into 1.618%-2.0%. However, 2.618% is also acceptable. Projections can be found on the Fibonacci retracement tool.
As pre-drawn diagrams rarely represent real-life trading, figure 1.1 illustrates a bullish harmonic bat pattern printed on a H4 chart of Bitcoin that’s close to finalising its D leg:
Notice there is a clearly defined move in each of its legs.
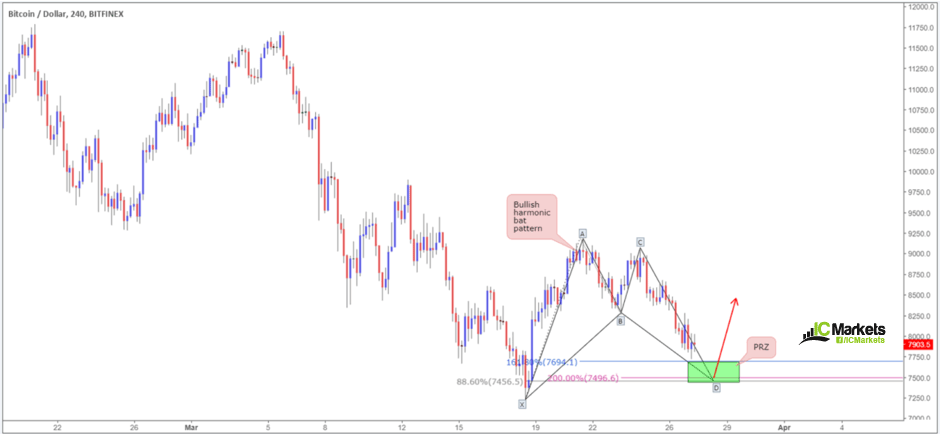
(FIGURE 1.1)
Trade Management
As you can probably imagine, trade management for the bat pattern is similar to the Gartley pattern. The difference is the stop-loss distance. Since the bat pattern’s defining limit is 0.886% of XA, as opposed to the Gartley’s 0.786%, the stop-loss distance will naturally be tighter and offer better risk/reward.
Stop placement: Typically, traders elect to position stops beyond the X point of the pattern. Others, nevertheless, prefer to use the 161.8% Fibonacci extension. This will ultimately be down to the individual trader to decide.
Take-profit target 1: 0.382% Fibonacci retracement of legs A-D. Traders tend to use this figure to reduce risk to breakeven and take partial profits.
Take-profit target 2: 0.618% Fibonacci retracement of legs A-D. This is considered, by some, to be the final take-profit zone. Yet, many traders hold a portion of their position in case the instrument chooses to run beyond this limit.
Can the Harmonic Bat Pattern be Traded in Isolation?
Trading the pattern in isolation may be a possibility. Though, we have yet to meet a trader that has done so on a consistent basis. On the other hand, we do know of traders who manage to scoop consistent profits out of the market using the bat pattern as a confirmation tool around areas of interest, such as, support and resistance, supply and demand and trendlines, for example.
With that in mind, this could be a good time to open a demo account and see just how accurate this pattern really can be. It may just surprise you.
References:
https://harmonictrader.com/harmonic-trader-books/
https://harmonictrader.com/harmonic-patterns/alternate-abcd-pattern/