Updated August 2020
While some disregard harmonic trading, others are incapable of operating without it.
The Gartley pattern, sometimes referred to as a Gartley 222, was introduced by H.M. Gartley in his book Profits in the Stock Market[1], in 1935. Nowadays, however, many traders follow the teachings of Scott M. Carney. In his book, The Harmonic Trader (1998)[2], Carney assigns specific measurements to the Gartley structure using Fibonacci ratios, and is now considered the industry standard among technical analysts.
Carney also coined the term Harmonic Trading, and is behind the development of other harmonic patterns, such as the Bat pattern, the 5-0, the Shark, the Crab pattern and many others[3].
Harmonic Patterns
Harmonic patterns are defined by specific price structures, operating on the premise that Fibonacci sequences can build identifiable structures, areas in which traders can initiate trades from.
Breaking Down the Gartley Pattern
Locating the Gartley pattern, particularly in the beginning, can be a tricky spot. For that reason, it is helpful to work with defined steps.
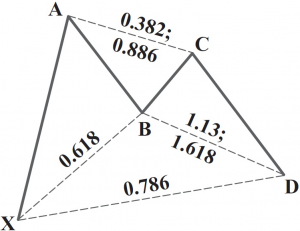
(Figure A – Bullish Gartley Pattern)
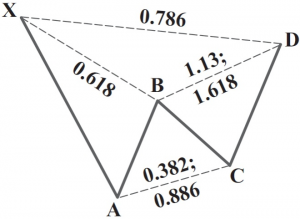
(Figure B – Bearish Gartley Pattern)
Step 1: Locate the impulse leg. This is a strong move in either direction. It can be a mixture of both bullish and bearish candles, yet it must be a defined move. The beginning of the impulse move is labelled X and the tip as A.
Step 2: At this point, a retracement is needed: the B leg. Using the Fibonacci retracement tool, measure from the X leg to the A leg. The Fibonacci retracement ratio targeted here is a 61.8% value.
Step 3: Using the Fibonacci retracement tool again, measure from the A leg to the B leg. The termination point is flexible, as long as price does not exceed point A. According to Carney, price should conclude between 38.2%-88.6%. This is your C leg.
Step 4: Here you’ll look for the final leg to form: the D leg. This is also the point traders formulate a potential reversal zone (PRZ). The PRZ must include a symmetrical AB=CD, where waves A and B equal that of C and D, and the all-important 78.6% retracement ratio of legs X-A. These are the minimum requirements for a valid Gartley. In addition, Carney looks at BC projections as a complementary ratio within the Gartley PRZ that must not exceed 1.618.
Figure C shows a EUR/USD H4 chart, boasting a clear bearish Gartley pattern. The PRZ contained a symmetrical AB=CD formation and a 78.6% Fibonacci retracement ratio. In addition, a 1.27 BC projection was seen.
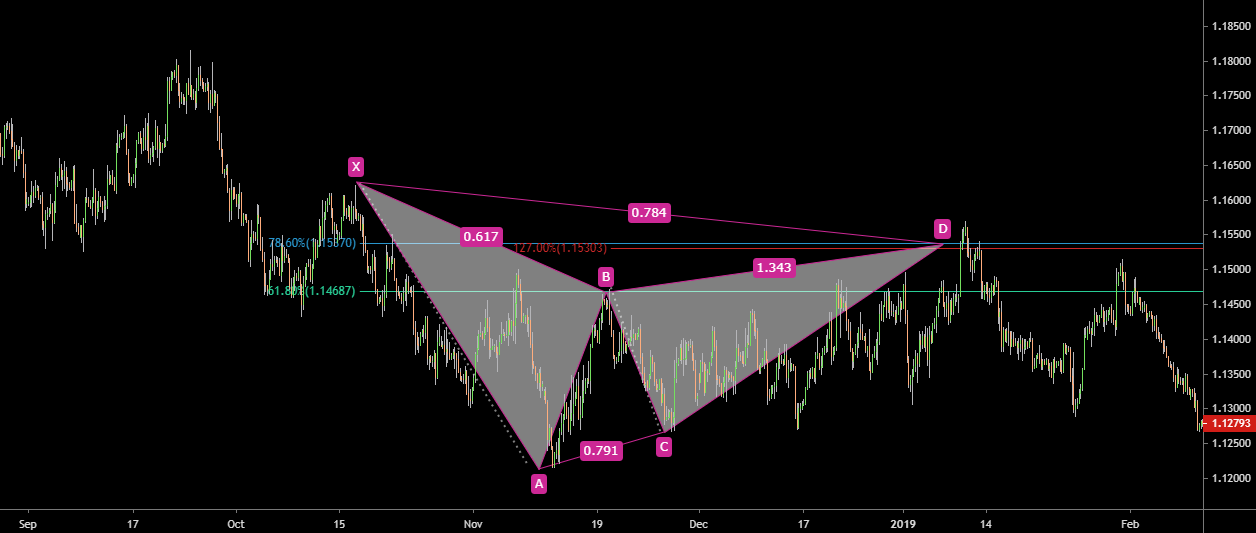
(Figure C)
Gartley Pattern: Trade Management
While many traders define their own rules of engagement, the following guidelines may help provide a foundation for newer traders:
- Entry – it’s ideal for price to test all numbers in the PRZ before entering a position.
- Stop placement is often located 2-5 pips beyond the X-point of the pattern.
- Take-profit target 1: 38.2% Fibonacci retracement of legs A-D. Traders often reduce risk to breakeven at this point.
- Take-profit target 2: 61.8% Fibonacci retracement of legs A-D. At this stage, partial profits are usually banked and a trailing stop is employed.
Trade Confluence
You will find many traders combine Harmonic patterns with additional technical analysis tools.
Should the pattern’s PRZ converge with a trend line, for example, this adds weight to a position moving in favour. Another point to consider is trend direction. Trading this method against the immediate trend can lead to unnecessary losses.
An example of using other tools can be seen in figure D, the EUR/USD H4 chart. The Gartley pattern merged with a clear support and resistance area and found additional confirmation by way of an RSI (relative strength index) overbought signal (figure D).
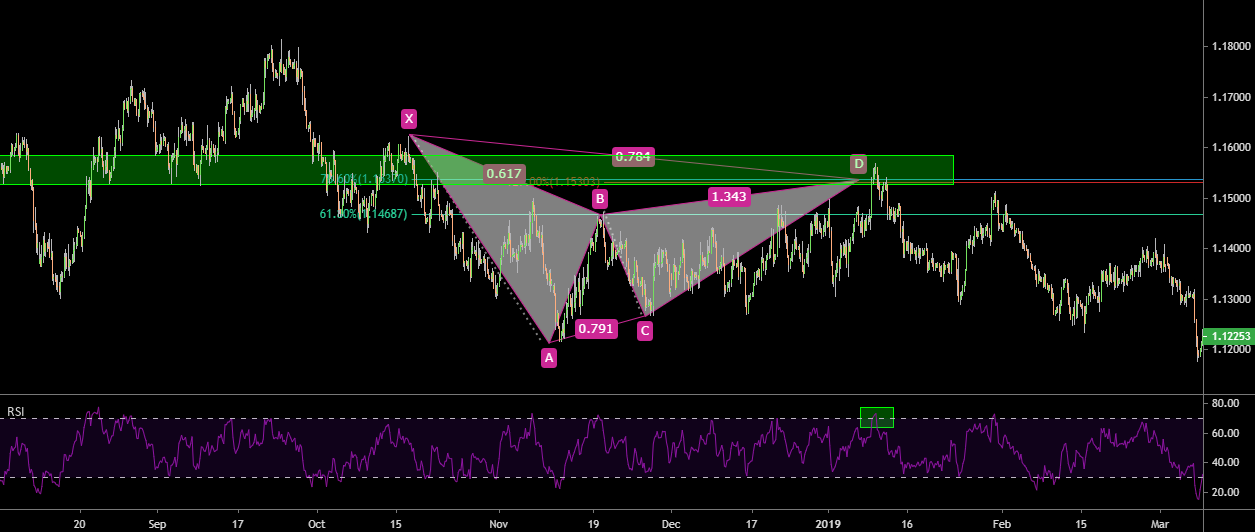
(Figure D)
Conclusion
Harmonic trading provides a clear framework with which to navigate market structure, a strategy which can be employed on all timeframes.
Consider opening a demo account and recording historical setups. It might just surprise you how accurate the Gartley pattern really is.
The accuracy, completeness and timeliness of the information contained on this site cannot be guaranteed. IC Markets does not warranty, guarantee or make any representations, or assume any liability regarding financial results based on the use of the information in the site
News, views, opinions, recommendations and other information obtained from sources outside of www.icmarkets.com.au, used in this site are believed to be reliable, but we cannot guarantee their accuracy or completeness. All such information is subject to change at any time without notice. IC Markets assumes no responsibility for the content of any linked site.
The fact that such links may exist does not indicate approval or endorsement of any material contained on any linked site. IC Markets is not liable for any harm caused by the transmission, through accessing the services or information on this site, of a computer virus, or other computer code or programming device that might be used to access, delete, damage, disable, disrupt or otherwise impede in any manner, the operation of the site or of any user’s software, hardware, data or property.
[1] https://www.amazon.co.uk/Profits-Stock-Market-Charts-Gartley/dp/0939093073
[2] https://www.amazon.co.uk/harmonic-trader-Scott-M-Carney/dp/B0006RELNY