Updated November 2020
All financial markets create trends and identifiable patterns.
At first glance, harmonic configurations may seem puzzling, even mysterious.
Harmonic patterns, however, are established through clear price structure and Fibonacci measurements.
The concept of harmonics, according to research, were first introduced by H.M. Gartley in his book Profits in the Stock Market, originally written in 1935. Since then, a number of authors/traders have improved harmonic structure, one in particular is Scott Carney.
According to Carney, in his book Harmonic Trading, Volume 1[1] (P.35), harmonic patterns are defined by specific price structures quantified by Fibonacci calculations. By calculating the various Fibonacci aspects of a specific price structure, harmonic patters can indicate an area to examine for potential turning points in price action.
The AB=CD Pattern
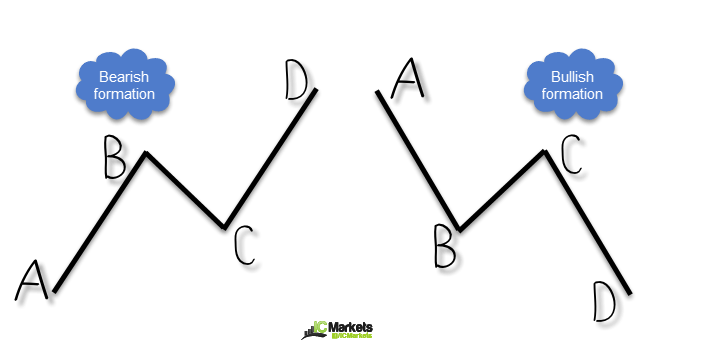
The AB=CD formation is a 4-point pattern in which the AB leg forms the initial price move. Following a correction/pullback of leg AB, price completes the pattern by establishing an equidistant move, the CD leg. Some traders choose to count the number of candles it takes to establish the AB leg and look for a corresponding quantity created on the CD leg.
As shown in figure A:
- An ascending AB=CD pattern is bearish.
- A descending AB=CD pattern is bullish.
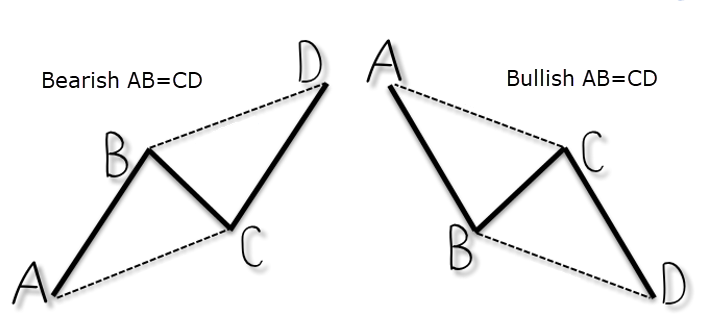
(FIGURE A)
Figure B, the EUR/USD H1 chart, displays a bearish AB=CD equivalent formation, a pattern involving six candles in leg AB and eight candles in leg CD.
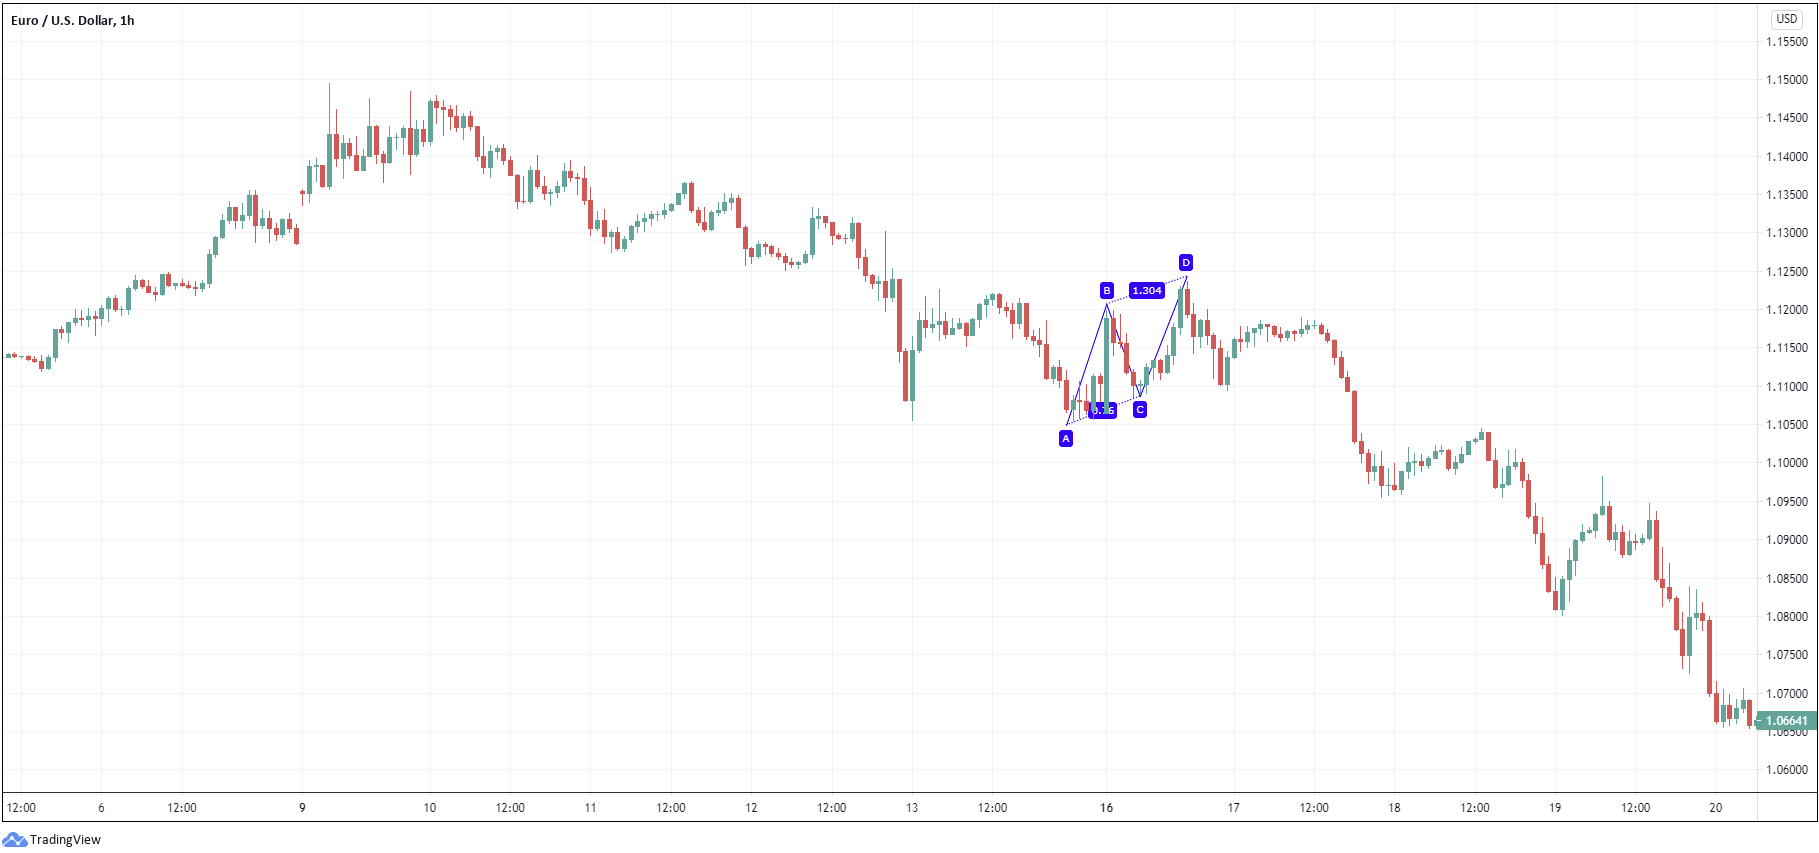
(FIGURE B)
AB=CD Pattern: Fibonacci Studies
While some feel AB=CD price structure is sufficient to navigate markets, Carney added AB=CD reciprocal ratios to complement the PRZ, or potential reversal zone (see figure C).
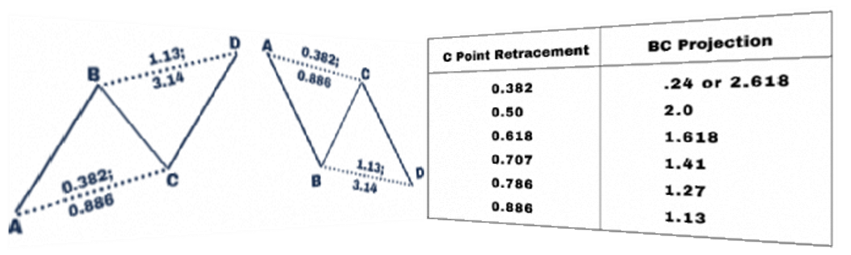
(FIGURE C)
A C-point retracement defines the BC projection value. As an example, a 50.0% C-point retracement suggests a 2.0 BC projection.
According to Carney, the ideal AB=CD structure is characterised by a 61.8% Fibonacci retracement at the C-point, setting up a 1.618 BC projection. As demonstrated in figure D, a bullish AB=CD equivalent pattern can be seen on the GBP/USD H1 chart, complemented by a 1.618 BC projection at $1.2506.
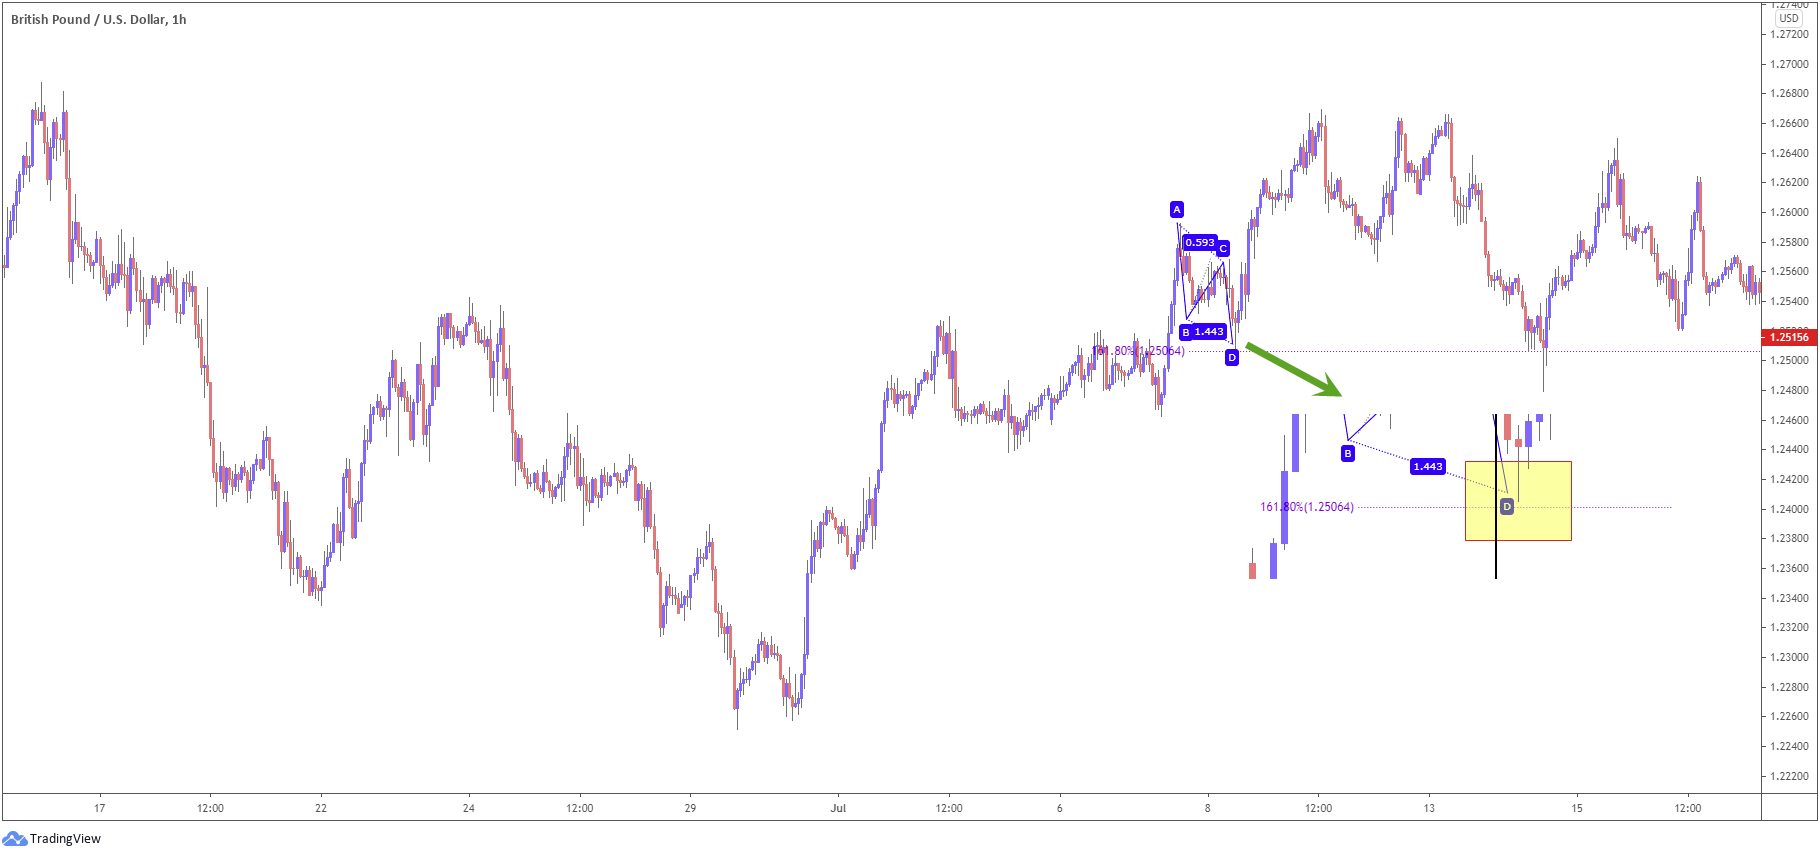
(FIGURE D)
Technical Confluence: Trading AB=CDs
Like most technical chart patterns, they tend to operate better when executed alongside the current trend.
Many claim AB=CD patterns offer poor performance. If trading these patterns against the overall trend or against a reaction off support and resistance, most patterns fail under these circumstances.
Ideal situations have AB=CD structure confirm technical areas – that is support and resistance, supply and demand or trend lines, for example. Additional considerations are the trend of your traded market. Ultimately, AB=CD patterns tend to offer best performance when in line with the immediate trend.
Figure E demonstrates an interesting scenario, visible from the H1 timeframe on GBP/USD. Prior to forming the bullish AB=CD structure highlighted in figure D, price penetrated the upper edge of a pennant pattern and breached a notable high at $1.2542. This suggested the trend had shifted to the upside. With this, and the fact the AB=CD pattern completed within striking distance of a round number ($1,2500) and in the shape of a retest at the upper edge of the pennant pattern, AB=CD buyers were in a healthy position here.
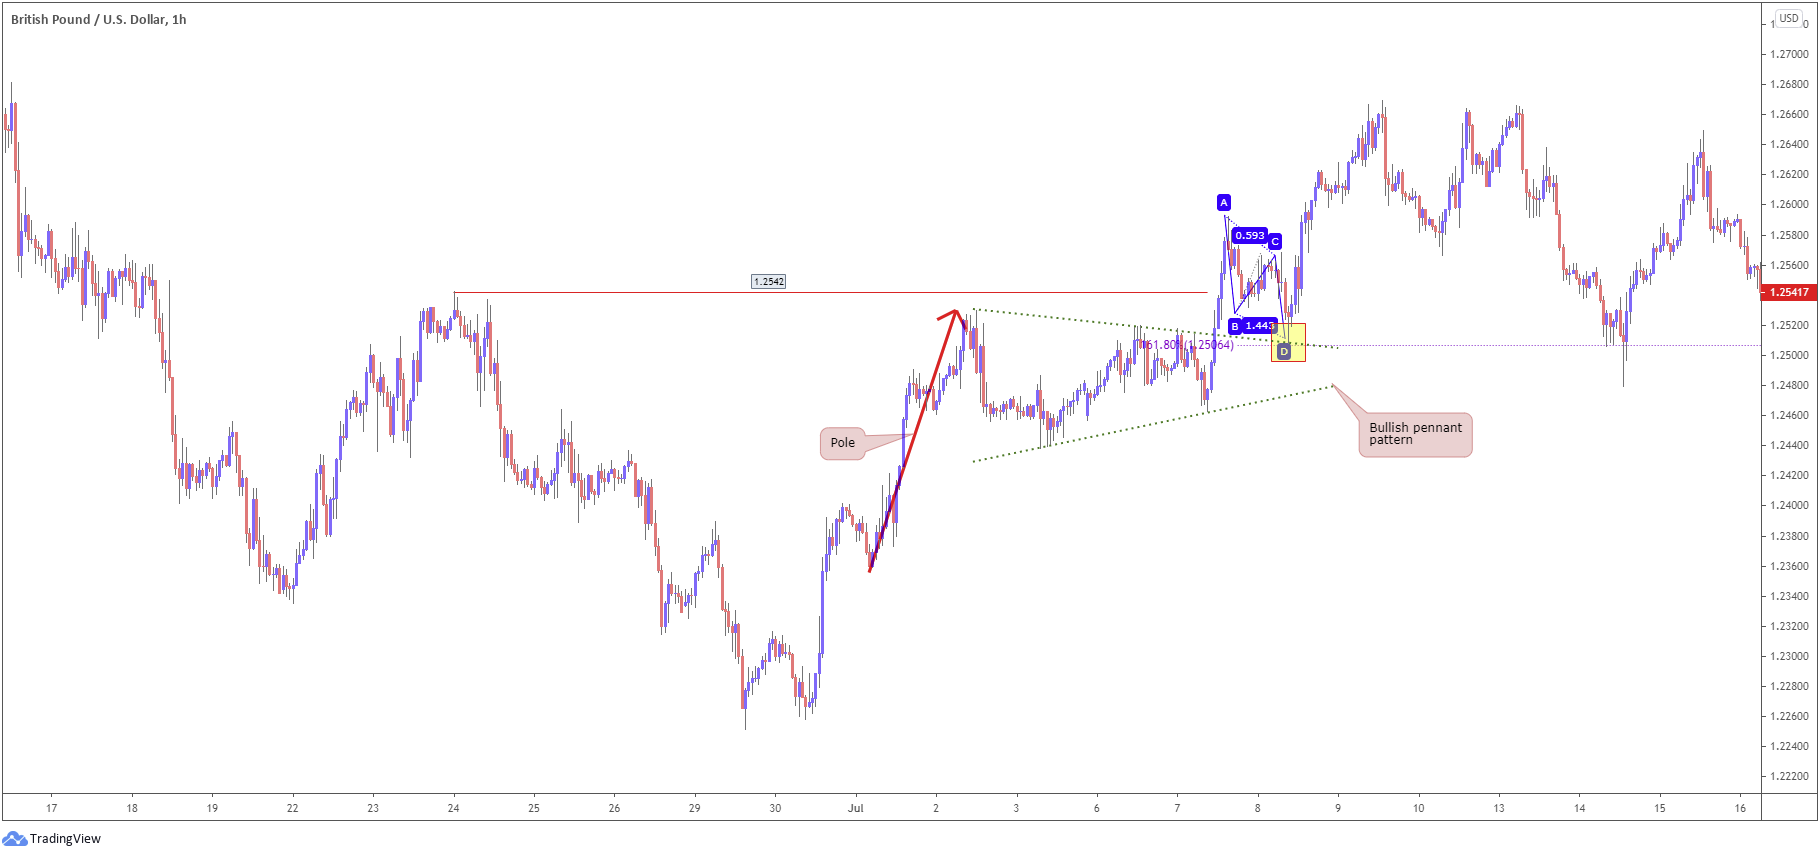
(FIGURE E)
Trade Execution and Management
Trade execution is, ultimately, down to the individual trader, often involving experimentation. Some common methods include assessing price action within the PRZ. This could be bullish or bearish candlestick/bar patterns. For example, an engulfing pattern formed within the PRZ’s limits may be enough evidence to entice traders to take action.
Some traders may even drill down to lower timeframes in search of local AB=CD configurations. As you can imagine, this can position traders in a favourable location within the PRZ.
Trade management, again, is ultimately trader dependent. The initial profit zone most commonly followed among harmonic traders, however, is the 38.2% or 61.8% Fibonacci retracement ratios, derived from legs A-D. This allows traders to not only liquidate partial profits, but also reduce risk to breakeven.
After the initial profit zone has been met, traders often employ a trailing technique. Carney notes a number of approaches in his books, one in particular is the 38.2% Trailer, measured from the reversal points formed after hitting the initial take-profit objective. This allows the trade enough room to breathe but not enough so as to erase all profits.
As for stop-loss placement, traditionally, many traders locate stop-loss orders beyond the PRZ with AB=CD patterns, and also use surrounding price structure (support and resistance, for example). With other harmonic configurations, such as Bat and Gartley patterns, there is an X point to consider for stop-loss placement.
Another key point to note is the initial reaction after testing the entire PRZ. This is called a terminal price bar, the initial bar/candle that tests the PRZ’s entire range. This helps establish a defining limit for the violation of the PRZ. Therefore, calculation of protective stop-loss orders should include the terminal bar’s extreme. If trading without additional confirmation, positioning stop-loss orders either beyond the PRZ, or beyond the next available structure point is the alternative.
The accuracy, completeness and timeliness of the information contained on this site cannot be guaranteed. IC Markets does not warranty, guarantee or make any representations, or assume any liability regarding financial results based on the use of the information in the site.
News, views, opinions, recommendations and other information obtained from sources outside of www.icmarkets.com.au, used in this site are believed to be reliable, but we cannot guarantee their accuracy or completeness. All such information is subject to change at any time without notice. IC Markets assumes no responsibility for the content of any linked site.
The fact that such links may exist does not indicate approval or endorsement of any material contained on any linked site. IC Markets is not liable for any harm caused by the transmission, through accessing the services or information on this site, of a computer virus, or other computer code or programming device that might be used to access, delete, damage, disable, disrupt or otherwise impede in any manner, the operation of the site or of any user’s software, hardware, data or property.
[1] https://www.amazon.co.uk/Harmonic-Trading-One-Profiting-Financial/dp/0137051506